Introduction
Obesity is a multifactorial, complex disease that contri-butes directly to cardiovascular risk [1]. Visceral adipose tissue has been shown to play an essential role in the development of cardiovascular disease [2]. Earlier, radiologic measurements of fat volume in the abdominal cavity were an important factor in the discovery of visceral fat as an endocrine organ influencing cardiovascular risk directly and independently from body mass index [3-5]. Recently, epicardial fat – the fat tissue layer between the myocardium and the visceral layer of the pericardium – has emerged as another metabolically active organ, affecting cardiac functions [6,7]. Due to its anatomical proximity to the myocardium, epicardial fat can make the myocardium more susceptible to arrhythmias [8]. Moreover, epicardial fat releases proinflammatory mediators, contributing to coronary artery disease (CAD) [9]. While there are diffe-rent options of measuring epicardial fat, quantification in computed tomography of the heart is the most common technique [10]. There are different studies examining the correlation between epicardial fat volume and severity of CAD but the results differ significantly [11,12]. Only a few studies to date have examined the relationship between epicardial fat volume and coronary artery disease – the reporting and data system (CAD-RADS) score in particular [13,14]. The aim of the present study was therefore to measure epicardial fat volume and investigate its correlation with CAD-RADS score and the occurrence of cardiac tachyarrhythmia in patients with acute chest pain. Furthermore, a threshold value should be defined to predict the likelihood of cardiac tachyarrhythmia in dependence of epicardial fat volume.
Material and methods
This study was approved by an institutional review board (application number EA4/129/21). Ninety-six patients who underwent CT coronary angiography (CTCA) in our hospital from 2018 to 2022 were included in this study. Patients received CTCA following an abnormal electrocardiogram, atypical angina pectoris, or suspicious elevation of heart-specific laboratory parameters with a range from low to medium pre-test probability for CAD [15]. Patients with intrathoracic devices that caused beam hardening artifacts within the contour of the heart were excluded from the study. A retrospective analysis of the data was performed. Patients’ history and laboratory information were obtained from electronic patient files, while imaging data were retrieved from the radiology and clinical information system. The local Ethics Committee approved this study, and a waiver for informed consent was granted due to the retrospective design of this study.
Image acquisition
CTCA was performed using the following standard operating procedure: patients with an average heart rate greater than 60 beats per minute received intravenous antiarrhythmic medication of up to 100 mg of esmolol hydrochloride (AOP Orphan Pharmaceuticals Germany GmbH, Germany) 5 to 10 min prior to the start of the CT scan to reduce heart rate to values lower than 60 beats per minute. Furthermore, if no contraindication was present, 2 puffs or approximately 0.8 mg of glycerol trinitrate spray (G. Pohl-Boskamp GmbH & Co. KG, Germany) were applied sublingually 2 min before scan start to maximise vasodilatation of the coronary vessels for better evaluability. A few (n = 2) patients received retrospective electrocardiogram-gated CT coronary angiography when cardiac arrhythmia or a persistently high heart rate over 70 beats per minute occurred. Most patients were scanned using prospective electrocardiogram-gated CT angiography (n = 94). All CTCA scans were carried out on a 320 detector row Canon Aquilion Prime CT system (Canon Medical Systems GmbH, Germany) at 0.5 mm slice thickness using the following standard protocol: First, a non-contrast scan of the heart for coronary calcium scoring was performed in 3-mm slice thickness. Second, CTCA was accomplished by intravenous injection of 60 ml non-ionic iodinated contrast medium, namely 60 ml Imeron 400 with a concentration of 400 mg/ml (Bracco Imaging Deutschland GmbH, Germany) through a common 18-Gauge intravenous catheter in the right cubital fossa with a flow rate of 4 ml/s succeeded by a flush of 50 ml 0.9% saline solution. Soft tissue kernel image reconstruction was conducted at multiple phases of the cardiac cycle for optimal evaluation of the coronary arteries.
Image analysis
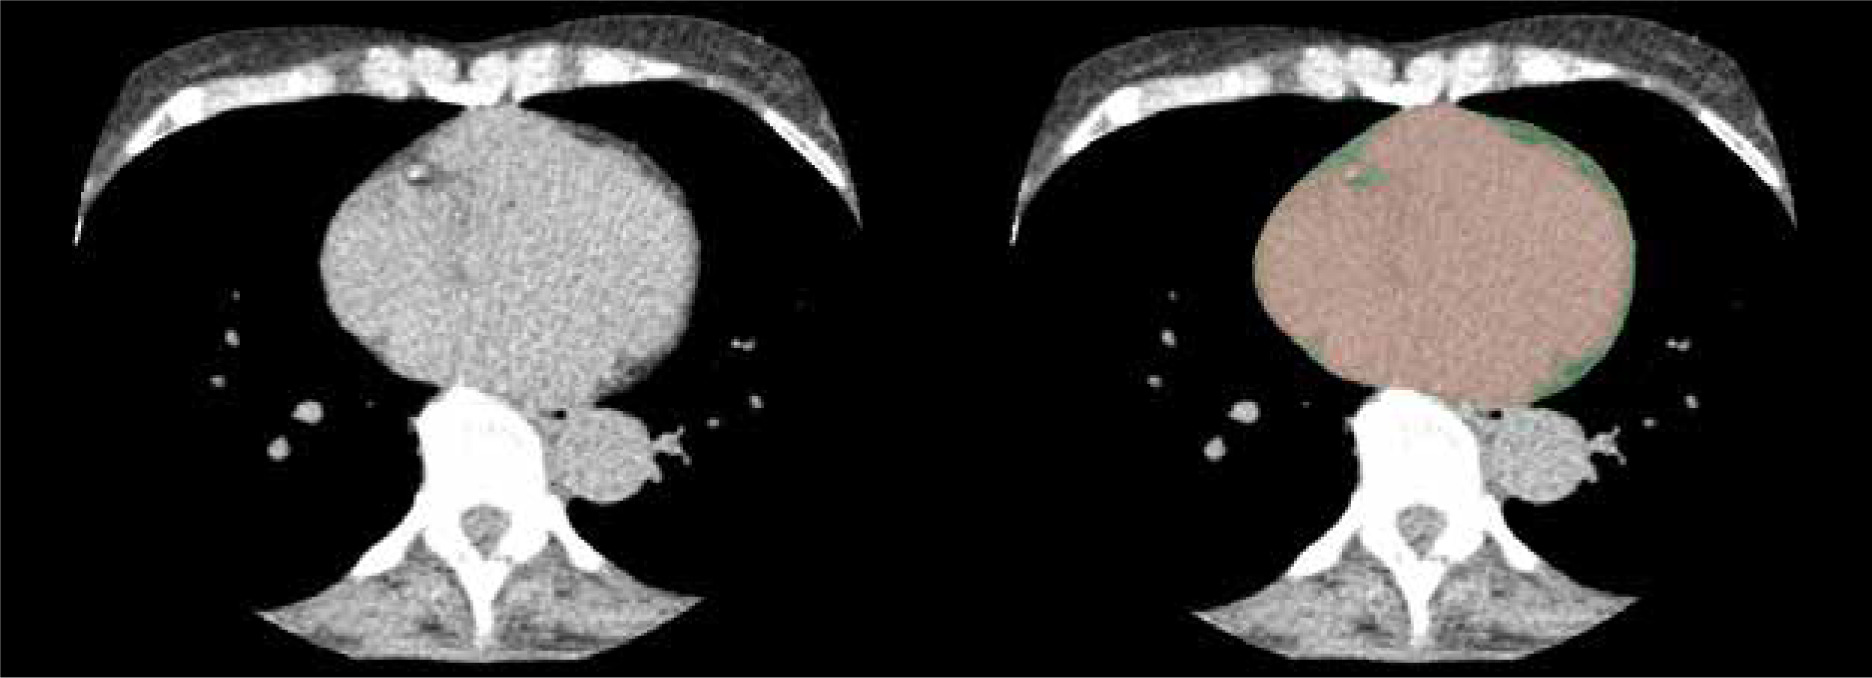
Calcium scores were calculated with the Agatston scoring system, and three-dimensional image reconstructions of the coronary vessels were created using Vitrea® post-processing software (Canon Medical Systems GmbH, Neuss, Germany) to facilitate analysis. The CAD-RADS scoring system 2.0 was applied for graduation of the extent of CAD in all patients. Epicardial fat volume was calculated after exporting 3 mm axial non-contrast scans of the heart to a separate open-source imaging analysis software (3D Slicer, Slicer Community, https://www.slicer.org), similarly to previously published algorithms [16,17]. Accordingly, an observer with 5 years of experience (M.W.) manually segmented every slice of 3-mm thickness excluding pericardial fat or other mediastinal fat, therefore minimising errors compared to automated approaches. First, the area below the visceral layer of the pericardium was marked with a circle-shaped brush tool in the image analysis software, leaving a mask for the content of the visceral pericardial sac. Afterwards, another mask was created in a different layer using a threshold value of –200 to –30 Hounsfield units to mark all fat-isodense areas within the DICOM image dataset [14,18]. Lastly, a logic operations tool was applied to subtract both layers from each other, leaving the fat-isodense areas within the first mentioned mask marked in a different colour, i.e. the epicardial fat layer (Figure 1). With the help of quantification tools within 3D Slicer, a volume was calculated from all marked epicardial fat-isodense areas measured in cubic centimetres.
Figure 1
View from an axial section of the non-contrast cardiac CT (calcium scan, left picture) for the measurement of epicardial fat volume. The heart contour up to the visceral pericardial layer is masked with a painting brush tool (red, right picture). Epicardial fat tissue is then subtracted with the help of a Hounsfield unit threshold value tool, leaving the epicardial fat layer as a fringe (green, right picture)
Statistical analysis
The analysed data included each patient’s age, body mass index (BMI), Agatston score, CAD-RADS score, epicardial fat volume, and existence of cardiac tachyarrhythmia during their stay in the emergency unit. Due to the relatively small sample size of patients, no normal distribution of data was assumed. To examine the relation of variables, Pearson correlation was used for interval-scaled variables and Spearman correlation for ordinally scaled variables. Data were presented using descriptive statistics (Table 1) showing either mean values with standard deviation or absolute numbers with percentages. The Mann-Whitney test was applied to compare the above-mentioned data categories between patients with and without cardiac tachyarrhythmia. Receiver operating characteristic curve analysis was performed to determine a threshold value of epicardial fat volume to predict the occurrence of cardiac tachyarrhythmia. The level of significance was defined as a p-value less than 0.05. Statistical analysis was performed using IBM SPSS Statistics Version 23 for Mac OS.
Table 1
Descriptive statistics of comorbidity prevalence, body composition parameters, epicardial fat volume, as well as Agatston and CAD-RADS scores of the patient population
Results
Patient population characteristics
Ninety-six patients were included in the study, with ages ranging from 18 to 88 years (mean 57 years). The population consisted of 59 men and 37 women. Fifteen patients had diagnosed diabetes mellitus, 50 arterial hypertension, and 39 dyslipidaemia. Twenty patients presented with known CAD. Twenty-six patients were actively smoking. The mean calcium score (Agatston score) in this population was 89.11.
Characteristics of computed tomography coronary angiogram data
CAD-RADS scoring revealed the following results: 45 patients showed no signs of CAD (CAD-RADS 0); in 12 patients a minimal non-obstructive CAD with minimal stenosis (1-24%, CAD-RADS 1) or plaque without a resulting stenosis was detected; 14 patients showed mild stenosis between 25 and 49% (CAD-RADS 2); 5 patients presented with moderate coronary artery stenosis between 50 and 69% (CAD-RADS 3); 12 patients showed severe stenosis of the coronary arteries – 8 patients with 70 to 99% stenosis in one or 2 vessels (CAD-RADS 4A) and 4 patients with either more than 50% stenosis of the left main coronary artery or an obstruction greater that 70% in three separate coronary arteries (CAD-RADS 4B); and total occlusion of a coronary artery was detected in 8 patients (CAD-RADS 5).
Relation of comorbidities, BMI, Agatston score, CAD-RADS, and epicardial adipose tissue volume
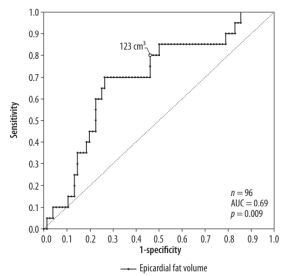
A positive, significant (p < 0.01) correlation was found for the comorbidities arterial hypertension, diabetes, and dyslipidaemia with epicardial fat volume and CAD-RADS score. For active smoking, no significant correlation with epicardial fat volume or CAD-RADS score was found. Linear regression with CAD-RADS score as a dependent variable showed a statistically significant relation with epicardial fat volume (p < 0.001, r2 = 0.31) and the patients age (p < 0.001, r2 = 0.26). Moreover, a statistically significant relation was found between BMI as a dependent variable and epicardial fat volume (p < 0.001, r2 = 0.26). There was a weak relation between the epicardial fat volume as a dependent variable and patients age (p < 0.001, r2 = 0.16). Additionally, a significant relation between Agatston score as a dependent variable and CAD-RADS (p < 0.001, r2 = 0.14) as well as age (p < 0.05, r2 = 0.11) but not with epicardial fat volume (p = 0.1, r2 = 0.03) were discovered. In a second step, the patients’ population was divided into subsets, those with tachyarrhythmia and those without. T-test for independent variables showed that there was a significant difference in epicardial fat volume between these groups (p < 0.001) as well as in CAD-RADS scores (p < 0.001). Receiver operating characteristic curve analysis led to a threshold value of 123 cm3 epicardial fat volume at a sensitivity value of 80% for tachyarrhythmia (Figure 2). The population of patients with tachyarrhythmia or no arrhythmia was subdivided into 2 groups according to the above-mentioned cut-off value of 123 cm3. The χ2 test showed that above the epicardial fat volume cut-off value the number of patients with tachycardiac arrhythmia was significantly higher than below the cut-off value (Figure 3). Vice versa, the number of patients without tachycardiac arrhythmia was significantly lower above the cut-off value than below (p < 0.01). Lastly, a subset of patients with supraventricular tachycardia was compared to patients without arrhythmia, showing a significantly higher epicardial fat vo-lume in patients with supraventricular tachycardia (p < 0.01).
Figure 2
Receiver operating characteristics curve model for the prediction of cardiac tachyarrhythmia by epicardial fat volume. The best cut-off to differentiate between tachyarrhythmic and non-arrhythmic patients is marked in the figure (123 cm3)
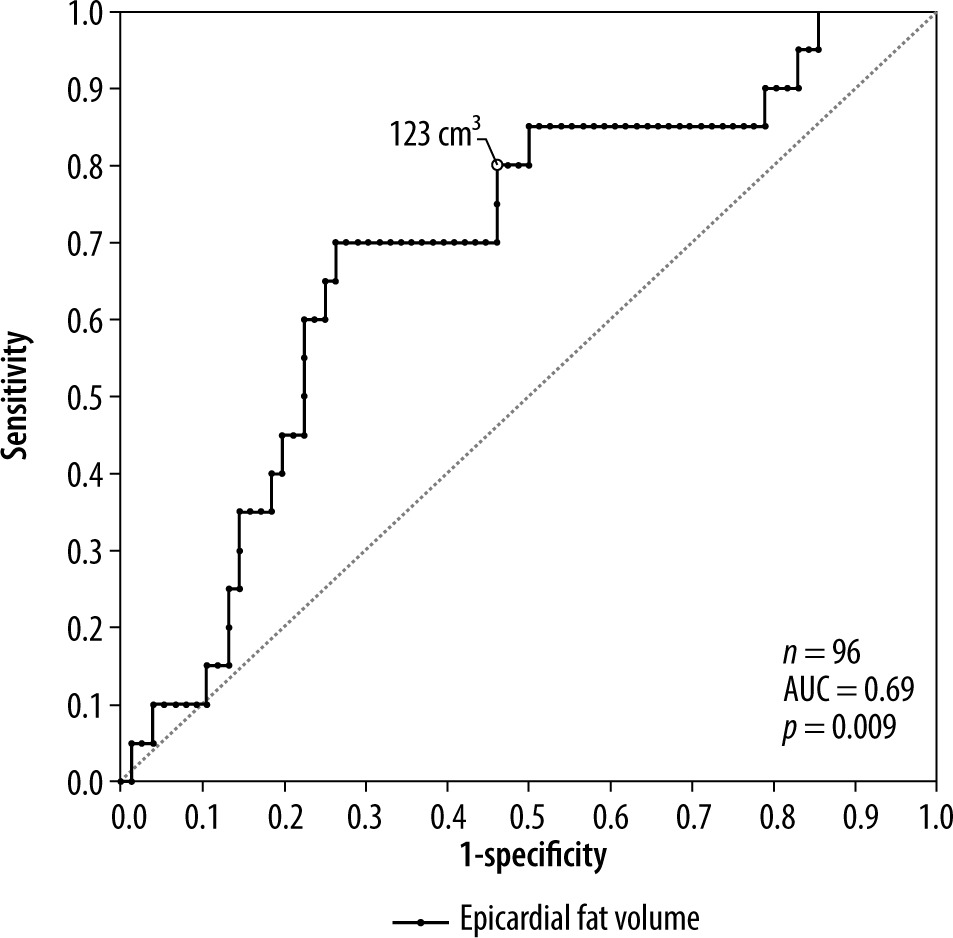
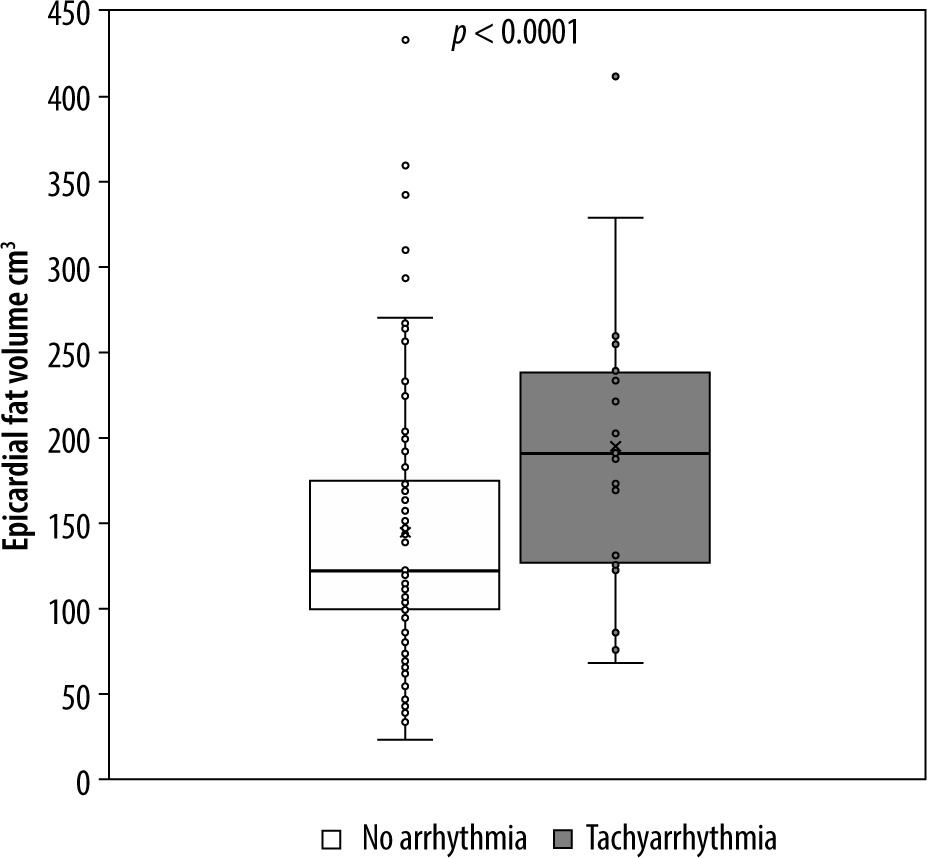
Figure 3
Boxplot of epicardial fat volume in patients without cardiac arrhythmia and patients with tachycardiac arrhythmia. Upper border of the boxes represents the 75th (Q3) and lower border of the box represents the 25th quartile (Q1), confining the interquartile range (IQR). The line inside the box represents the median. The cross stands for the mean value. Whiskers stand for minimum (pointing down, Q1-1.5*IQR) and maximum (pointing up, Q3+1.5*IQR). Dots represent every single data point respectively (epicardial fat volume in cm3)
Discussion
Our study demonstrates that cardiac CT is a viable me-thod to quantify and detect significant differences in epicardial fat volume in subgroups of patients with acute chest pain and low to medium pre-test probability of coro-nary heart disease. To the best of our knowledge, this is the first study showing that above a volume of epicardial fat (123 cm3) the incidence of cardiac tachyarrhythmia is significantly higher than below this cut-off. Additio-nally, our study shows that patients with supraventricular tachycardia have significantly higher epicardial fat vo-lume than patients without this condition. Furthermore, the significant correlation between CAD-RADS score and the epicardial fat volume could be confirmed [19]. In our collective, epicardial fat and CAD-RADS score were also significantly correlated with BMI and patient age.
Recently, epicardial fat volume has been studied with contradictory data: On the one hand, Panda et al. found a positive correlation between epicardial fat volume and Agatston score [14]. This was not the case in our collective of 96 patients, which nearly doubles the patient number in the mentioned study (n = 54) but is still a relatively small patient population. An explanation could be the composition of our patient population that might have had an influence on regression analysis for Agatston score and CAD-RADS score. The distribution of gender – a larger male population – and the number of patients with diabetes – a less diabetic population in our study – are pre-viously found influencing factors of Agatston score and differ substantially from the study of Panda et al. [14,20-22]. Most likely reason is that the mean Agatston score in our population is about half that found in the compared study by Panda et al. As discovered by Mahabadi et al. the association of epicardial fat volume on the progression of coronary calcification is more emphasised in subjects with low body mass index and decreases with the degree of adiposity [23]. This might also explain our differing results from Panda et al., but BMI was not measured in their study.
Possner et al. investigated 275 patients with known or suspected CAD and could not establish a further value in the quantification of epicardial fat as a prognostic value for major adverse cardiac events in addition to calcium scoring [24].
The newly derived cut-off value of 123 cm3 of epicar-dial fat volume in native calcium scoring scans might be useful in daily clinical work. A high amount of epicardial fat paired with cardiac tachyarrhythmia in the ECG should alert radiographers and radiologists to choose – depending on the available equipment – a suitable image acquisition technique (e.g. change to fast pitch or retrospective acquisition methods) before starting CTCA [25,26]. A range of evidence is pointing towards the proarrhythmic features of epicardial fat in the context of supraventricular arrhythmia, especially atrial fibrillations, and it has even been shown that epicardial fat volume is a better predictor of atrial fibrillation than common body composition parameters for measurements of adiposity [8,27-29]. This strengthens our argument that epicardial fat volume is a useful diagnostic marker for risk stratification in CAD. More studies and a broader understanding of the local function and proinflammatory properties of epicardial fat are needed to elucidate causal mechanisms behind this phenomenon.
Our study confirms a significant correlation between CAD-RADS score and epicardial fat volume, supporting other studies, which show that epicardial fat as a distinct endocrine tissue directly influences the presence and chronicity of atrial fibrillation [30]. Furthermore, the amount of epicardial fat is associated with coronary plaque, severe coronary stenosis, and high-risk coronary plaque features [19]. A study examining the volume of vascular specific epicardial adipose tissue around the left coronary artery in patients with stable chest pain showed an incremental predictive value of the epicardial fat volume for myocardial ischaemia [13] fitting the potential chain of causality from local pro-inflammatory mediators promoting remodeling of coronary arteries leading to CAD, finally culminating in myocardial ischaemia [8,31].
In our study epicardial fat and CAD-RADS score were significantly correlated with BMI and patient age, suggesting a significant influence of lifestyle-associated body composition factors and aging processes on epicardial fat volume and eventually CAD risk. This is similarly described for the metabolic derangement of visceral adipose tissue in obesity and aging, leading to a systemic pro-inflammatory environment [32].
The following limitations have to be taken into account: First, the retrospective approach limits the formation of subgroups (age, gender, comorbidities). Second, the relatively small patient population from a single institution aims for validation of our results in a larger multicentre study.
Conclusions
In our study, the threshold value of 123 cm3 for epicardial fat volume was found in non-contrast calcium scoring scans, above which there was a significantly higher incidence of tachycardiac arrhythmia. In daily clinical life, this finding should be used to choose – depending on the available CT-hardware – a suitable imaging protocol to ensure best imaging quality of CTCA. Furthermore, epicardial fat volume significantly correlated with CAD-RADS, BMI but only weakly with patient age. Patients with supraventricular tachycardia had significantly higher epicardial fat volume than patients without this condition, supporting findings from literature.