Introduction
Shear wave elastography (SWE) is a noninvasive, safe, and widely available ultrasonic technology that allows for assessment of tissue elasticity. While SWE is only one of the available sonoelastography methods, it has significant advantages that include repeatability, avoidance of operator-based subjectivity, and the ability to obtain results that are both qualitative and quantitative [1]. Research and clinical applications of SWE are systematically expanding. The European Federation of Societies for Ultrasound in Medicine and Biology (EFSUMB) presented elastography guidelines that cover the most common use, which is assessment of the liver, as well as information on examining other organs and tissues, such as breast, thyroid gland, prostate, nerves, pancreas, gastrointestinal tract, spleen, kidney, vessels, and testes, and also musculoskeletal applications for tendons, nerves, and muscles [2].
Current studies have presented possible SWE applications in both diagnosing and monitoring of muscle-related symptoms and diseases, such as cerebral palsy and diseases leading to spasticity; myopathies, including dystrophinopathies; muscle and tendon trauma; and musculoskeletal tumours [3].
However, clinical applications of SWE should take into account confounding factors, including the depth of the performed measurement (as both those too superficial or those deeper than 4-5 cm have proved to be biased), elasticity changes due to dynamic and static stretching, physical effort of the muscles preceding the SWE, and response to pressure applied by the probe [4,5]. It is also worth taking into account the rehabilitation impact – the relaxation after massage reduces muscle stiffness [6].
Studies concentrating on measurement methodologies and quantifying such confounding issues are scarce and inconsistent. While EFSUMB guidelines state that “as minimal a force as possible should be applied”, the most common method used – standoff coupling gel – leads to deterioration of SWE reliability [2,7]. Because elastography is still a relatively new technique, the need for further evaluation and standardization of study protocols has been raised by many authors [8,9]. At the time of writing this article, there are no unequivocal data on how and to what extent compression impacts the obtained parameters, especially in paediatric populations. In the authors’ opinions, due to prevalent problems with good understanding of study protocols and cooperation, this particular population may be more prone to errors resulting from passive compression with the probe.
We strongly believe that while electrophysiological studies still prove to be irreplaceable tools in the diagnosis and monitoring of neuromuscular diseases, due to certain characteristics (e.g. the need for cooperation, difficulties in obtaining and interpreting children’s electromyography (EMG) results, and patient discomfort), the use of an additional diagnostic technique that is repetitive, painless, noninvasive, and relatively low-cost seems to have practical justification. However, knowing the limiting factors and their effects on results is crucial.
The main aim of our study was, therefore, to evaluate the impact of ultrasound probe mechanical pressure on the stiffness of the gastrocnemius muscle in a healthy paediatric population. The secondary goal was to assess the factors that may affect the observed influence of probe pressure.
Material and methods
The present study was evaluated and approved by the Ethics Committee of the Medical University of Silesia, Katowice, Poland (No. PCN/CBN/0022/KB1/52/I/21, dated 12 October 2021). This research received no external funding.
Participant characteristics
The study group was recruited from among children aged 5-16 years who were hospitalized in the Department of Paediatric Neurology at the John Paul II Upper Silesian Child Health Centre in Katowice, Poland, due to headaches, history of single seizure or loss of consciousness that did not meet the criteria for epilepsy, behavioural or school problems, tics, or peripheral facial nerve palsy. Participants were recruited from July to December 2022. Written informed consent for additional elastography examinations and participation in the study was obtained from parents or legal guardians after detailed discussions about the study and prior to the examination. All participants, regardless of age, gave verbal consent to participate in the study.
The following exclusion criteria were applied:
age younger than 5 years and older than 16 years,
history of neuromuscular disease diagnosis or symptoms, significant motor development delay, or epilepsy,
history of significant surgical procedures or trauma in the assessed limb,
current inflammation, general or localized, or trauma to the examined area,
lack of cooperation from the child during examinations.
Only one participant was excluded from the study due to lack of cooperation. The rest of the recruited participants met the inclusion criteria without meeting any exclusion criteria.
Measurement method
The study was based on 2-dimensional (2D) real-time shear-wave measurements of the dominant limb’s gastrocnemius muscle. An ultrasound probe using physical pressure of 0, 1, 2, and 3 N was applied during the examination. Physical pressure was measured with a custom-made, 3-dimensional (3D)-printed cover equipped with strain gauge pressure sensors (SondaSys sp. z o.o., Katowice, Poland).
The customized covers were individually 3D designed based on the ultrasonography probe’s image from a 3D scan. For that purpose, a high-precision optical scanner (HP 3D Structured Light Scanner Pro S3; HP Inc., Palo Alto, CA, USA) and its dedicated software were used. After analysis of the 3D image, the customized cover was designed using Fusion 360 software (Autodesk, San Francisco, CA, USA). The external shape of the cover was modified to allow for effortless measurement of the physical pressure during examination. Due to the patients’ ages and comfort, the external dimensions of the cover were minimized to reduce stress related to the use of additional equipment. Finally, the external parts of the cover were manufactured using an UP 3D printer (Beijing Tiertime Technology Co. Ltd., China) using dedicated ABS material in a white colour. The result is presented in Figure 1.
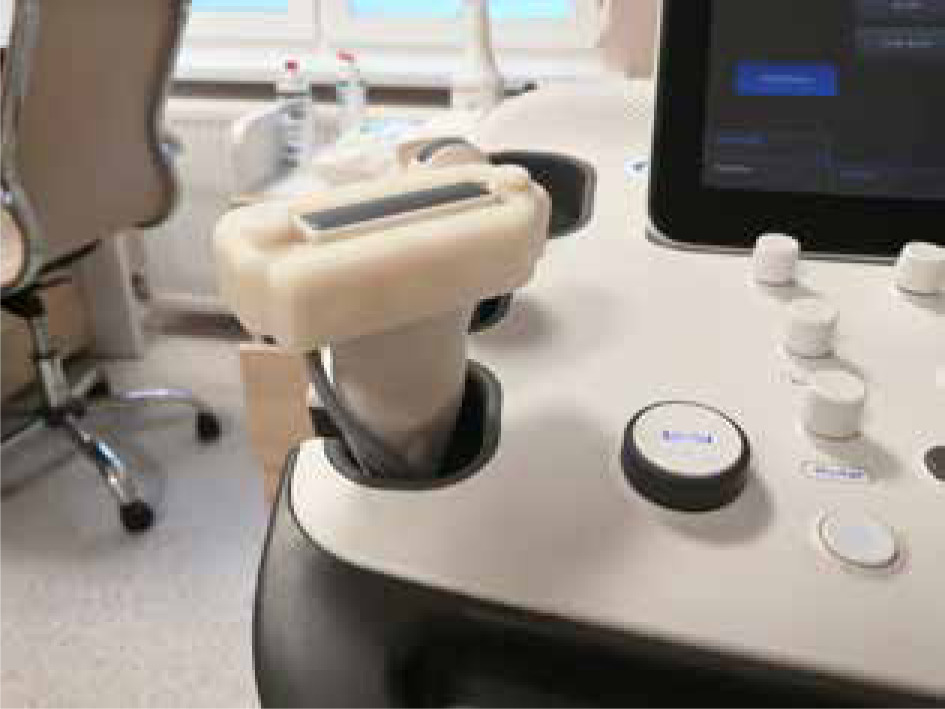
Figure 1
A 3D-printed cover for the ultrasound probe that was used to measure the mechanical pressure exerted by the probe during an elastographic examination
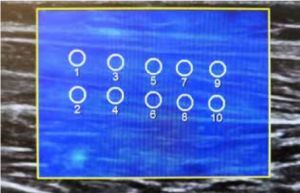
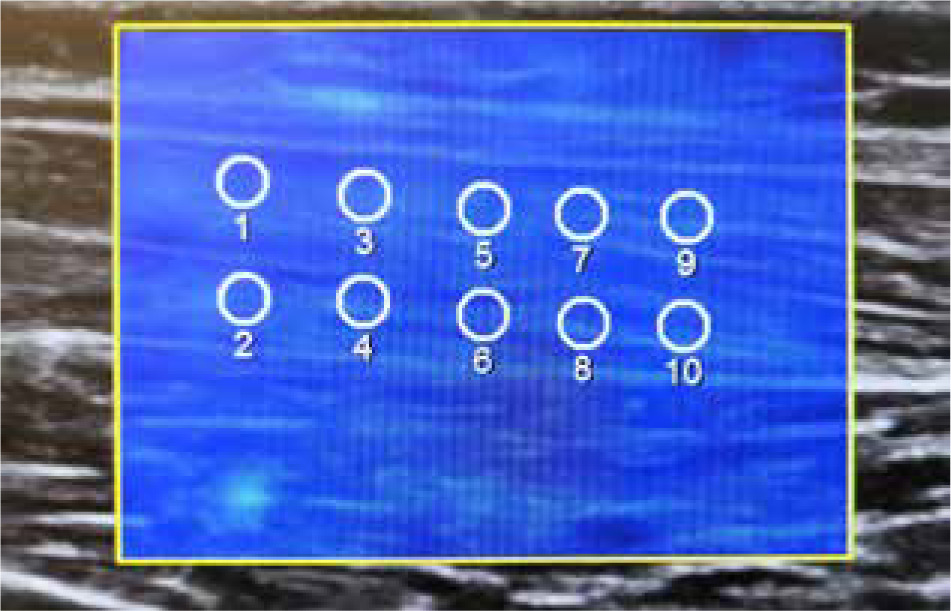
The examination was performed in the prone position, with one foot freely positioned off the couch. The ultrasonography probe was located longitudinally to the long axis of the muscle, at the widest and thickest part of the muscle belly. A Samsung RS85 ultrasound system with an LA2-9A linear probe (Samsung Healthcare, Seoul, South Korea) was used. To minimize the effects of the placement of the region of interest (ROI) on the measurements that have been reported to date, 10 ROIs with a diameter of 6 mm were placed in 2 rows (upper and lower) during each pressure step, with a minimal reliability index of 0.7 (Figure 2) [10,11].
The stiffness parameters of each ROI and their mean values were noted. Measurements were made in kilopascals with one decimal place of accuracy. Based on previous reports, the depth of 4 cm was adopted as the allow-able maximum. All elastography measurements were performed by the same radiologist, who had over 8 years of experience in ultrasound diagnostics and 7 years of experience with sonoelastography examinations.
Age, height, weight, leg dominance, and calf circumference were noted on the examination date. The calf circumference was the mean of 3 separate measurements taken while standing freely on both legs. Leg dominance was asserted by patient self-reporting, patient answers to the question, “Which leg would you use to kick a ball?”, and observations of patients kicking a ball and jumping on one leg [12].
Statistical analysis
Statistical analyses were performed using Statistica version 13.5 (TIBCO Software, Palo Alto, CA, USA). Descriptive data are presented as mean (standard deviation) or number (%). The normality of the distribution was checked with the Shapiro-Wilk test. Due to a lack of normal distribution, the analysis was carried out using the Kruskal-Wallis and post hoc tests against multi-state variables or the Mann-Whitney U test against binary variables. Correlation was calculated with Spearman’s test. The p-value of 0.05 was assumed for this work. The database had no missing data.
Results
The study group consisted of 24 children (13 females and 11 males) aged 8.99 ± 2.74 years (8.99 ± 2.39 and 9.00 ± 3.11 years for females and males, respectively). The mean BMI of the patients was 16.72 ± 2.54 kg/m2. The full characteristics of the recruited group are presented in Table 1.
Table 1
Characteristics of recruited study group
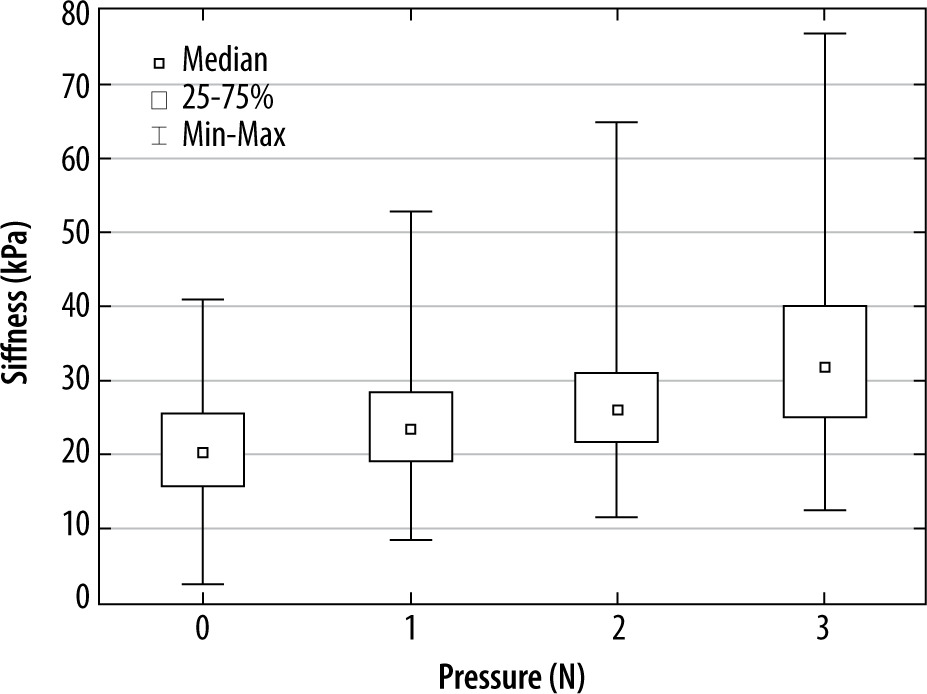
We observed a significant difference in the stiffness parameter at a pressure of 1 N, with further increases when the force increased (p < 0.001).
The relationship shown in Figure 3 was visible regardless of the patient’s sex or measurement row.
Figure 3
A box and whisker plot for gastrocnemius muscle stiffness depending on the pressure of the ultrasound probe during the elastographic examination
A significantly higher stiffness in measurements from the upper ROI row in comparison to the lower ROI row was observed (p < 0.001), and this was seen for all steps of probe pressure (p < 0.001 for all steps).
Out of a fear of bias, our team decided not to perform in-depth, sex-based analyses because in our study group the boys were significantly older (p = 0.002) and had larger calf circumferences (p < 0.001).
A significant but very weak positive correlation of age and stiffness was observed (p < 0.001, r2 = 0.022), which was maintained for all levels of probe pressure apart from 3 N, where the correlation was no longer statistically significant (p = 0.084). In other words, there was a very weak increase in stiffness with age for 0, 1, and 2 N of pressure, but not for 3 N. The correlation of stiffness and calf circumference was not significant (p = 0.193). There was no significant correlation between BMI and stiffness measurements, regardless of probe pressure.
Discussion
In our work, we demonstrated a significant change in muscle stiffness under 1 N pressure and more. We did not observe significant stiffness changes in relation to BMI, height, or calf circumference. We also did not demonstrate a clinically significant correlation between age and muscle stiffness.
Limitations of our study include analysis of only the gastrocnemius muscle in a relatively small paediatric group and the lack of a comparison with adult volunteers. The small size of the group did not allow for reliable analysis after age-based division. Due to factors independent of the authors’ need to finish recruitment, it was not possible to enlarge the study group. The technical limitations of the designed device did not allow for assessment of compression less than 1 N, and we were thus not able to establish the lowest interfering pressure value.
While muscle applications of SWE are still developing, they may prove to be useful for both the diagnosis and monitoring of disease progression and treatment effects, particularly in diseases such as cerebral palsy, Duchenne disease, neonatal brachial plexus palsy, and spinal muscle atrophy [4,13-16]. Currently, monitoring of the course and treatment of neuromuscular disease is often based on different clinical and functional scales. One of the greatest advantages of SWE is its quantitative character and high-level objectivity that surpasses observer-based assessments [17,18].
One of the problems in wider clinical applications of elastography methods is the undetermined impact of potential confounders. To date, the probe load impact on elastography results has proven to be significant in studies of other soft tissue – for example, breast or thyroid gland [2,19,20]. To the best of our knowledge, there is no previous qualitative in vivo study of how probe pressure changes the SWE results of muscles with an objective evaluation of compression on paediatric patient populations.
Our results showed a significant influence of the probe on the stiffness values of the examined tissue, with further result changes due to increasing pressure. This tendency raises another open question – whether this change in stiffness or its ratio for given pressure values might prove to have diagnostic value. Further study is needed on the matter.
Our study results are congruent with ex vivo studies. Wang et al. [21] analysed the influence of manually applied probe pressure on pork tenderloin muscle elastography with different thicknesses of couplant. Significant differences were found between light contact with the examined tissue and compression of 1.5 kPa and 3.0 kPa, regardless of couplant thickness or the depth for data acquisition, which was between 0.5 and 5 cm. Rominger et al. [22] proved that manual compression of examined porcine muscles resulted in significant increases of mean shear wave velocity (SWV; 5.29 m/s and 7.21 m/s for no pressure and a weight of 500 g, respectively, p < 0.001).
The results of existing in vivo studies are less congruent. In a work by Carpenter et al. [3], the authors found that while adding probe load significantly increased the mean velocity of the rectus femoris muscle, there was no difference for the gastrocnemius and vastus lateralis muscles. In another study, the authors analysed changes seen after application of 3 different compressions: light, with a copious but undefined amount of gel; medium, defined as slight deformation of a superficial layer of the rectus femoris muscle; and hard pressure, which deformed the thickness of the muscle. While the study proved that both maximum and mean SWV changed due to different pressures, this division might be hard to repeat and differentiate, and it remains very operator dependent [23]. Furthermore, both aforementioned studies were based on adult populations.
Based on the existing studies, there is an open question as to whether, as presented by Carpenter, compression influence might vary depending on the muscle being examined. While no significant changes were seen for the gastrocnemius muscle in the mentioned study, our results were different. Because there is a clear difference in study age group (children vs. adults), further research is needed to determine whether this inconsistency is due to the age factor. In our study, the elasticity changes due to compression were less pronounced in older children, but while the effect was of statistical significance, it was very weak. We considered that both age-related changes in musculoskeletal tissues and growth-related changes, resulting in artificial layers serving as a buffer for compression, might be the reason for this pattern.
The matter of muscle tissue stiffness due to changes with the aging process remains inconclusive in current studies. Some authors have described an increase of muscle stiffness due to aging based on in situ studies and elastography [24,25]. Based on a comparison of the passive elongation of single muscle fibres and bundles of fibres from the vastus lateralis muscle in different age groups, Pavan et al. [26] concluded that this pattern of age-related muscle stiffness increase is due to changes in the extracellular matrix, mainly collagen accumulation. Conversely, there were no age-related changes in SWV results for general gastrocnemius muscle elasticity in a group of 127 healthy volunteers between 17 and 63 years old in a study by Arda et al. [27], which used the standoff gel method for evaluation. At the same time, in a study by Şendur et al. [28], based on SWE examinations, there was a decrease with age in the mean stiffness of the gastrocnemius muscle.
For now, EFSUMB guidelines state that elastography examinations should be performed with the “lightest transducer pressure possible”, but they do not define exactly what that means or how the pressure influences the results [2]. Various solutions to this problem have been presented in various studies, including applying “as low as possible” pressure, controlling the probe load by limiting it to stress that does not deform the superficial layer of epimysium, and the use of a standoff gel method, while other studies have not provided any information about probe pressure [3,4,9,27].
With suggestions to use a significant amount of ultrasonography gel as an additional layer between the probe and skin, the exact amount varied between studies, but it was most often a layer of 4 to 5 mm [9,27]. While this method is both easy and repeatable, in 2018, Alfuraih et al. [7] presented a study comparing minimal probe pressure with standoff gel methods and their influence on the reliability of SWE. The authors found that while the difference of mean stiffness did not reach statistical significance, there was a decrease of SWE reliability from good (ICC = 0.83) for minimal probe pressure to moderate (ICC = 0.62) for the standoff gel method. The authors suggested that this change might have been due to the gel’s microbubble effect on the quality of push pulse [7].
In the opinion of the authors, to better explore the subject matter, it would be necessary to conduct another prospective study comparing the impact of ultrasound transducer pressure on muscle stiffness in a wider group of children and adults. Factors improving the quality of such a study would be the use of external electromyography to assess muscle activity during the measurement, recruitment of adults in different age groups, and reference of the obtained results to the lifestyles and physical activity of participants. In addition, the authors believe that a study assessing the change of stiffness in relation to applied pressure and including measurement of muscle elasticity would be valuable.
Conclusions
Ultrasound elastography has potential application in the diagnosis and monitoring of neuromuscular diseases, but the methodology of muscle ultrasound elastography is not clearly established. The ultrasound transducer significantly influenced results with 1 N of mechanical pressure, although calf circumference and BMI of the patient did not affect the previously discussed effects.