


Thirty years ago, the traditional approach to mechanical ventilation consisted of achieving normali-zation of PaCO2 and pH, for which patients were ventilated with tidal volumes (VT) of up to 10–15 mL kg-1 of predicted body weight (PBW) [1].
The large multicentre ARDSnet trial demonstrated a decrease in mortality close to 25% in more than 800 patients with acute respiratory distress syndrome (ARDS) when 6 mL kg-1 of VT was used instead of 12 mL kg-1 PBW, confirming that VT limitation is a fundamental strategy to improve survival in patients with ARDS [2]. Since that trial, use of 6 mL kg-1 PBW (based on height and gender) has become a dogma for ventilating patients, either with ARDS or in the operating theatre. However, it is increasingly established and recognized that 6 mL kg-1 of VT may be excessive for some patients and insufficient for others [3].
The paradigm of protective ventilation aims to individualize ventilatory support. Traditionally, the mainstay of this approach is given by low VT and avoiding high airway pressures [4]. Indeed, although alveolar pressure is easy to estimate clinically through plateau pressure (Paw plateau), the latter represents the distending pressure of the entire respiratory system. Ventilator settings based only on airway pressure measurements are inappropriate for most critically ill patients [4]. Currently, protective ventilation can be better understood in terms of limiting global and regional mechanical stress (pressure applied to the lungs) and strain (deformation from its resting position). Lung injury can occur due to overdistention (volutrauma/barotrauma), and recruitment and repetitive tidal collapse (atelec-trauma), both mechanisms resulting in heterogeneous insufflation of areas of occupied or collapsed alveoli [5]. To carry out intraoperative protective mechanical ventilation, medical literature has focused on positive end expiratory pressure (PEEP), Paw plateau, and airway driving pressure (ΔPaw). However, considering its limitations, other parameters have emerged that represent a better reflection of isolated lung stress, such as transpulmonary pressure (PL) and transpulmonary driving pressure (ΔPL). These parameters are less genera-lized in clinical practice due to the requirement of an oesophageal balloon for their measurement and therefore their cumbersome application in the operating theatre. However, their study and comprehension help us to better interpret the traditional parameter alterations to be able to take subsequent behaviours.
This review aims to develop the traditional concepts of protective ventilation and clarify definitions of the most representative parameters and their determinants. In addition, limitations on their use are mentioned and practical points are summarized to transfer their interpretation to the monitoring and ventilation configuration of the patient under gene-ral anaesthesia.
PROTECTIVE VENTILATION PARAMETERS
Tidal volume
Because high VT ventilation can prevent or minimize pulmonary atelectasis, in the past it was common practice to use a VT of 800–1000 mL, which translated into a VT of up to 10–15 mL kg-1 [6]. Volumes that have been used in patients without ARDS under mechanical ventilation have been progressively decreasing [7]. In a 39-year period from 1975 to 2014, VT decreased significantly in ICUs (annual decrease of 0.16 mL kg-1) and in the operating theatre (annual decrease of 0.09 mL kg-1) [8].
However, there is usually a misconception that the benefits of ventilating critically ill patients with low VT of 6–8 mL kg-1 are irrelevant in surgical patients, due to the relatively healthy lungs and shorter duration of ventilation in the latter [6]. Intraoperative ventilation at low VT has been shown not only to decrease airway pressures and generation of pro- inflammatory cytokines, but also to improve patient-centred outcomes, such as need for reintubation, length of hospital and ICU stay, and postoperative pulmonary complications (PPCs) [9–12]. PPCs are increased by VT in a “dose-dependent” manner and generate higher mortality in patients undergoing mechanical ventilation for general anaesthesia [13].
Volume selected in a protective way (6–8 mL kg-1) can be distributed differently according to the aerated lung volume that a certain patient has to receive. This means that even the same set VT can produce different lung stress (distending pressure applied to lung parenchyma) between patients with similar PBW [14]. The size of the aerated lung can vary considerably in patients with consolidation, fluid, pulmonary exudate, or atelectasis [15]. It is precisely these patients that are at risk of overdistention injury even when ventilating with low VT, because they have reduced aerated lung volumes [15]. In patients with low lung compliance, such as ARDS patients, or in the operating theatre those with pulmonary atelectasis, even VT below 6 mL kg-1 of PBW can result in high strain (lung deformation from its resting position) [16].
In this sense, 3 randomized clinical trials have demonstrated a decrease in postoperative pulmonary complications in protectively ventilated surgical patients with VT of 6–8 mL kg-1 together with positive end-expiratory pressure (PEEP) levels between 6 and 12 cm H2O, a ventilatory strategy that was related to lower airway distending pressure (airway driving pressure or ΔPaw) and greater lung compliance [12, 17, 18]. On the other hand, the use of strategies with low VT is associated with hypercapnia and acidosis, probably due to less efficient alveolar ventilation [7]. These patients could benefit from strategies such as reducing instrumental dead space, increasing respiratory rate, lung recruitment manoeuvres associated with selection of an optimal PEEP, and prone position [15].
Therefore, titration of VT according to PBW could be a starting point, but it does not ensure the absence of damage. A possible solution is titrating VT according to ΔPaw [5, 14, 16] or to transpulmonary pressure (PL) [15]. These parameters could be better surrogates for limiting ventilator-induced lung injury (VILI) due to overdistention [15].
Limitations
If we use VT as a target, there are situations in which ventilatory strategies based on low VT do not confer lung protection [19]. For example, when ventilating obese patients during laparoscopic surgeries in the Trendelenburg position, a VT of 6–8 mL kg-1 PBW with low PEEP can be harmful. In this scenario, atelectasis with collapse and cyclic reopening of alveolar units in one zone of the lung coexist with pulmonary overdistention in another zone and may cause injury [20]. The open lung approach consists of opening up lung parenchyma where areas of atelectasis and overdistention coexist, using lung recruitment manoeuvres and optimal PEEP selection, achieving an increase in aerated lung volume with greater availability of alveolar units for the same VT [21]. As a result, more homogeneous ventilation is obtained, with less overdistention and collapse, and less lung damage [22, 23]. On the other hand, in patients without pulmonary pathology subjected to general anaesthesia and ventilated with an open lung approach, pulmonary recruitment and titrated PEEP, a VT of 6 mL kg-1 or more may not be harmful to the lung if ΔPaw is less than 13–15 cm H2O [15, 24].
Application in clinical practice
Pulmonary ventilation with low VT constitutes a fundamental parameter of protective ventilation; therefore, a set VT of 6–8 mL kg-1 PBW serves as an initial setting parameter [20]. However, it has been postulated that an even more beneficial strategy would be to titrate it individually. VT could be chosen integrating other parameters such as optimal peep levels with or without recruitment maneuvers and the use of driving pressure. The target would be to select a VT value based on reducing driving pressure and increasing respiratory system compliance [15, 19, 25].
PEEP
PEEP is the positive pressure at the end of expiration. Low PEEP levels (5 cm H2O) are routinely used in patients undergoing mechanical ventilation. This practice aims to keep the lung open at the end of expiration, prevent small airway and alveoli closure, minimize the damaging effects of cyclic opening and collapsing of the alveoli, and increase the lymphatic flow, facilitating drainage of pulmonary oedema [16, 26]. Furthermore, PEEP would facilitate lung homogenization by recruiting previously non-ventilated alveolar units, thus avoiding excessive tension in the margins between aerated and non-aerated regions of the lung parenchyma (stress raisers) [1, 4, 27]. Both mean airway pressure (MAP) and the plateau pressure (Paw plateau) will increase with increasing PEEP, but this increase may be accentuated to a greater or lesser extent depending on the compliance of the respiratory system (if the latter is low, the increase in pressures will be higher, and vice versa). In contrast, airway driving pressure is not affected by changes in PEEP levels unless they result in changes in lung compliance. Increases in PEEP will only be protective when they result in an increase in lung compliance, which will be reflected in a decrease in ΔPaw [7, 28]. PEEP, therefore, should be selected individually according to the patient’s requirements [29].
PEEP = PEEPvolume × Ers,
where PEEP is the positive pressure at the end of expiration, PEEPvolume is the volume generated by PEEP, which is calculated as the difference between EELV (end expiratory lung volume) and FRC (functional residual capacity), and Ers is the respiratory system elastance (Figure 1 and Table 1).
FIGURE 1
Determinants of protective ventilation parameters. Where Paw peak is airway peak pressure, delta peak plateau is the difference between the peak and the plateau pressure, Paw plateau is airway plateau pressure, VT is tidal volume, PEEPvolume is volume generated by PEEP, Ers is respiratory system elastance, EL is lung elastance, Ecw is chest wall elastance, Paw PEEP is positive end expiratory pressure or PEEP, ΔPaw is airway driving pressure or respiratory system driving pressure (ΔPrs), PL PEEP is transpulmonary pressure at end of expiration, ΔPL is transpulmonary driving pressure or lung driving pressure, ΔPes is oesophageal driving pressure or driving pressure across the chest wall (ΔPcw) or the change in pleural pressure between the end of inspiration and the end of expiration (ΔPpl), PL plateau is transpulmonary pressure at the end of inspiration, Pes plateau is oesophageal pressure at the end of inspiration, and Pes PEEP is oesophageal pressure at the end of expiration
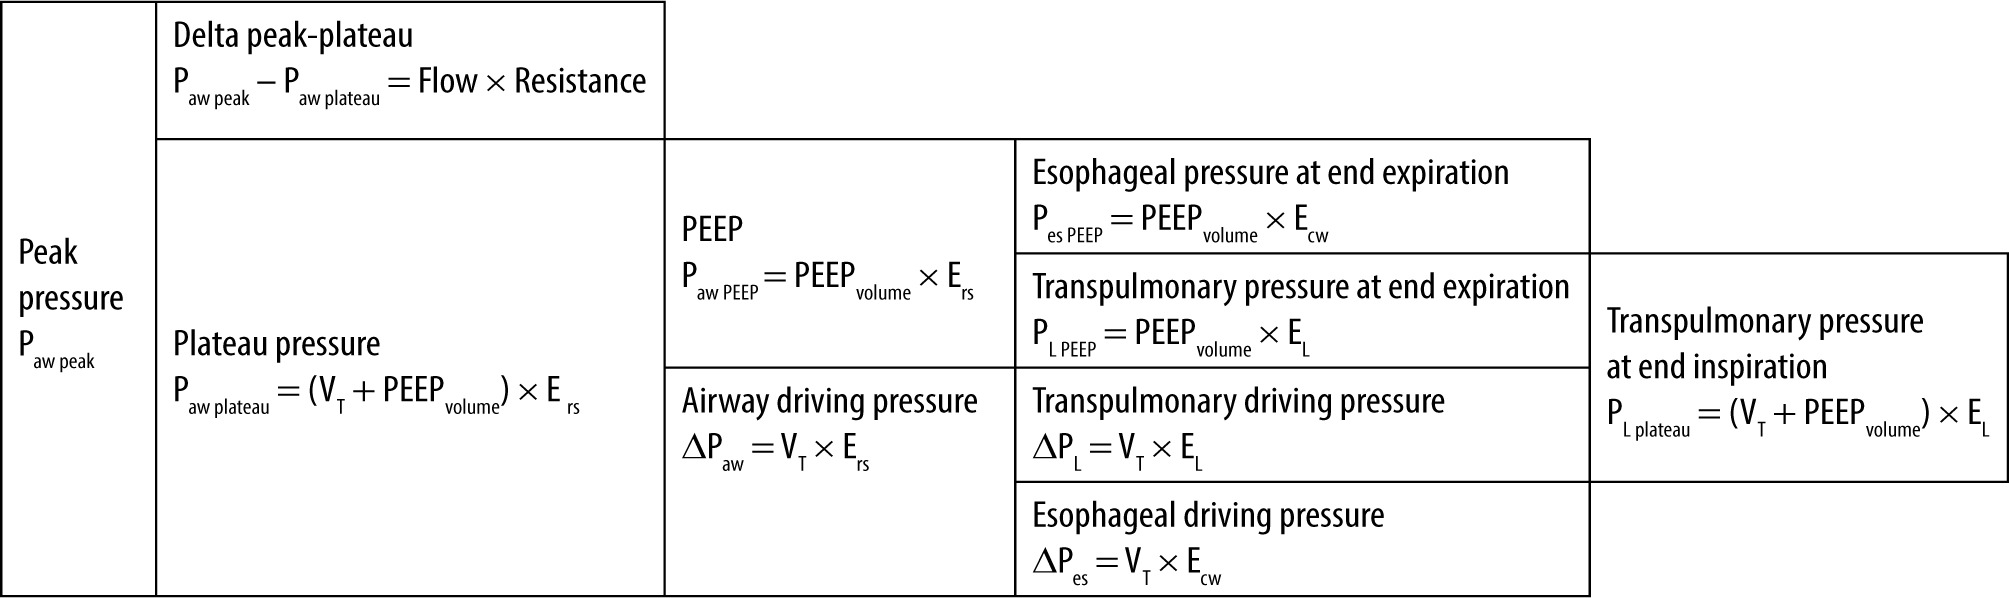
TABLE 1
Protective ventilation parameters
Paw PEEP – airway PEEP pressure, PEEPvolume – volume generated by PEEP, EELV – end expiratory lung volume, FRC – functional residual capacity, Ers – respiratory system elastance, Paw peak – airway peak pressure, Paw plateau – airway plateau pressure, VT – tidal volume, Ers – respiratory system elastance, ΔPaw – airway driving pressure or respiratory system driving pressure (ΔPrs), PL plateau – transpulmonary pressure at the end of inspiration, EL – lung elastance, ΔPL – transpulmonary driving pressure or lung driving pressure
Limitations
PEEP is only beneficial when it is associated with an increase in functional lung volume, i.e. aerated lung volume (in a patient with high recruitability), reducing lung inhomogeneities. An inappropriately high level could be associated with potential deleterious effects such as pulmonary overdistention and impaired cardiac output [16]. Conversely, an inappropriately low PEEP level could be associated with atelectasis, leading to reduced lung compliance (low functional lung volume) with higher ΔPaw, and to haemodynamic alterations due to the effects of hypoxic pulmonary vasoconstriction on the right heart [27, 30].
Application in clinical practice
If using PEEP as an objective, there will be situations in which it could be beneficial or harmful depending on the value we have chosen and the mechanical characteristics of the thoraco-pulmonary system (lung-chest wall). Thus, a high PEEP level could be beneficial in an obese patient in laparoscopic surgery after a recruitment manoeuvre, while the same PEEP level in a patient with normal BMI (body mass index) and healthy lungs would cause overdistention [19].
Therefore, probably an adequate way to select PEEP levels would be through a recruitment mano-euvre, in patients with risk factors for atelectasis, and a PEEP titration according to the respiratory system compliance or to the airway driving pressure (ΔPaw), parameters that better relate pressure to volume delivered [21,23,30]. However, to prevent overdistention, it is possible to differentiate responders to recruitment manoeuvres from non-responders. In responders, airway driving pressure is reduced due to an increase in functional residual capacity (FRC). In non-responders, FRC does not increase and therefore PEEP should not be increased any further [21].
In practice, it is recommended that PEEP = 0 cm H2O (ZEEP) should be avoided, a lower PEEP limit greater than 5 cm H2O be used, and then it should be individualized [20]. In this sense, one way to titrate PEEP is to seek an improvement in respiratory system compliance by a decrease in airway driving pressure [2, 7].
Airway peak pressure
Peak airway pressure (Paw peak) is the maximum pressure measured in the airway at the end of inspiration. Unlike Paw plateau, Paw peak is influenced by both the elastic and resistive properties of the respiratory system. At the bedside, the difference between peak and plateau pressures can be easily individualized during an inspiratory pause during volume-controlled ventilation. Immediately after the inspiratory pause, a rapid pressure drop is observed, which represents the pressure dissipated to overcome airway resistance. To calculate the airway resistance, this pressure difference is divided by the inspiratory flow. In normal subjects, airway resistance values do not exceed 15 cm H2O L-1 s-1 under controlled mechanical ventilation [16].
During mechanical ventilation, Paw peak depends on Paw plateau, and on the pressure difference between these 2 pressures (Paw peak – Paw plateau), which is determined by both the inspiratory flow and airway resistance.
Paw peak = (Paw peak – Paw plateau) + Paw plateau
Paw peak = ΔV × Raw + (VT + PEEPvolume) × Ers,
where Paw peak is airway peak pressure, Paw plateau is airway plateau pressure, ΔV represents inspiratory flow, Raw is airway resistance, PEEPvolume is volume generated by PEEP, and Ers is respiratory system elastance (Figure 1 and Table 1).
In patients without increases in airway resistance and/or obstructions in the ventilatory circuit, the maximum inspiratory pressure (MIP) or peak inspiratory pressure (PIP) is approximately equal to the plateau pressure [7]. During pressure-controlled ventilation, the set ventilator pressure (MIP) is comparable to the Paw plateau during volume-controlled ventilation if inspiratory flow seen on the flow-time curve reaches zero, a situation in which MIP will constitute a surrogate of alveolar pressure.
Limitations
It is influenced by the elastic and resistive properties of the respiratory system as a whole. Therefore, it is difficult to use it as a parameter that represents the load to which the lung is subjected in isolation.
Application in clinical practice
Because plateau pressure constitutes a determinant of peak pressure, when Paw peak is elevated, a high plateau pressure should be ruled out so as to consider the causes of a high delta Paw peak – Paw plateau.
Once inspiratory flow (ΔV) is established, the delta pressure generated depends on an airway resistance value.
For example, during volume-controlled ventilation, once VT and inspiratory time were established, Paw peak – Paw plateau generated will depend on the airway resistance value. That is to say, in the face of an increase in resistance such as endotracheal tube kinking, secretions, bronchospasm, etc., the pressure difference between the Paw peak and Paw plateau will increase by increasing the Paw peak [31].
↑ΔP = ↑Paw peak – Paw plateau = ΔV × ↑Raw
In the same way, at a constant resistance value, changes in inspiratory flow (ΔV) modify pressure differences.
For example, during volume-controlled ventilation, once VT is established, the decrease in inspiratory time (by decreasing the I : E ratio from 1 : 2 to 1 : 4, increasing the respiratory rate or increasing the inspiratory pause time in anaesthesia ventilators) will generate an increase in inspiratory flow (ΔV) and this will determine an increase in Paw peak, thus increasing the pressure difference between Paw peak and Paw plateau [31].
↑ ΔP = ↑ Paw peak – Paw plateau = ↑ΔV × Raw
It is suggested that a peak pressure < 30 cm H2O be used in mechanically ventilated patients without ARDS both during volume-controlled ventilation and pressure-controlled ventilation [7].
Airway plateau pressure
Plateau pressure, or airway plateau pressure (Paw plateau), is the pressure measured in static conditions during an inspiratory pause in volume- controlled ventilation, and that results from the sum of pressures associated with tidal volume and volume generated by PEEP, if it is present. Because it is estimated during zero flow conditions, it avoids taking into account the pressures required to exceed airway resistance [3]. In other words, the Paw plateau is not affected by changes in inspiratory flow or airway resistance [16] and only reflects the elastic properties of the respiratory system [32].
The Paw plateau is thus determined by changes in VT, Ers, and PEEP levels [31].
The importance of plateau pressure lies in the fact that it is considered a surrogate, a reflection of alveolar pressure (Palv), which is the real pressure that distends the entire respiratory system (lung plus chest wall) [33]. In this sense, it also involves the pressure required to surpass the chest wall elastance, and therefore this “alveolar pressure” does not reliably reflect the pressure load to which only the lung is exposed. Pulmonary distending pressure in isolation is evaluated with transpulmonary pressure, which represents the elastic recoil pressure of the lungs [29].
The Paw plateau thus represents the best clinical way to assess airway pressure under static conditions, and therefore it can be used to estimate transpulmonary pressure [3].
Paw plateau = PEEP + ΔPaw
(VT + PEEPvolume) × Ers = (PEEPvolume × Ers) + (VT × Ers)
Where Paw plateau is airway plateau pressure, PEEP is positive pressure measured at the end of expiration, ΔPaw is the airway driving pressure, and Ers is the respiratory system elastance (Figure 1 and Table 1).
The recommendation of the ARDS network protocol to limit the Paw plateau below 30 cm H2O to improve survival derives from the evidence obtained during spontaneous ventilation, in which total lung capacity is achieved with a transpulmonary pressure of 25 cm H2O. If a patient has normal chest wall elastance, it corresponds to a Paw plateau of 30 cm H2O, a pressure level below which was shown to generate minimal inflation and therefore the absence of VILI in an animal study [34] (Figure 1).
Limitations
During a patient’s mechanical ventilation, a high Paw plateau may not be injurious per se, when instead of being applied to inflate the alveoli, it is mostly used to inflate a high elastance chest wall [29].
In 1988 Dreyfus et al. [35] demonstrated that injurious pulmonary oedema occurred in healthy paralyzed animals during pressure-controlled ventilation with high VT and high airway pressures, but it did not occur in those ventilated with similar airway pressures and low VT due to straps applied around their abdomen and chest. These straps were a simple way to increase chest wall elastance, and therefore, for the same airway pressure or plateau pressure, pulmonary distending pressure or transpulmonary pressure was lower and did not cause injury [29]. These experiments demonstrated that the volume that caused lung stretching, and not the airway pressure, was the most important factor in determining injury, a finding that led them to employ the term ‘volutrauma’. We currently interpret these findings as an indirect demonstration of the importance of transpulmonary pressure in determining ‘lung trauma’ and injury, which in fact does not occur if this pressure is kept within certain limits, no matter how high the plateau pressure is [29].
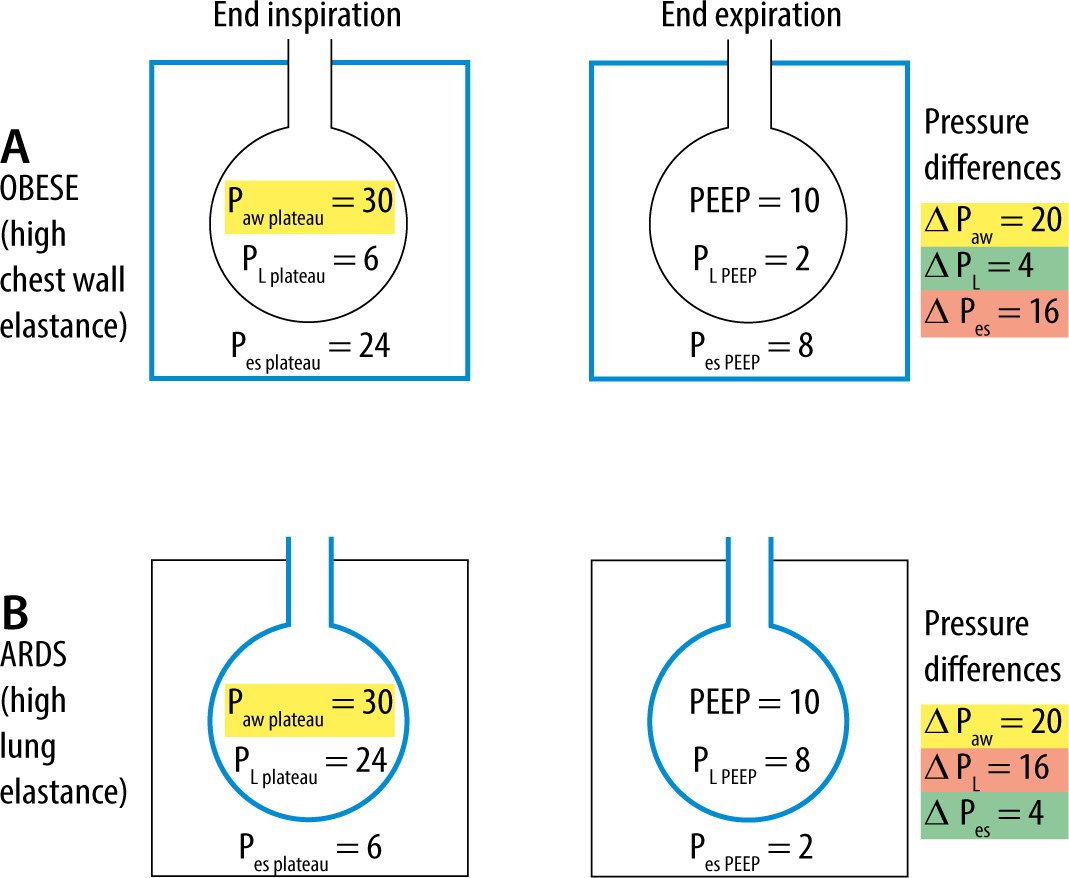
In this way, ventilating patients with high chest wall elastance and limiting the plateau pressure to 30 cm H2O, far from inducing damage by baro- or volutrauma, this can lead to atelectasis with shunt and hypoxaemia, in addition to lung damage due to increased stress raisers (e.g. in obese patients, pregnant women, patients with pleural effusion, neuromuscular diseases, or capnoperitoneum) [3]. On the one hand, high chest wall elastance is effectively protective for the lungs, but it entails an increase in pleural pressure, which will have haemodynamic repercussions through an increase in pressure in the right atrium, which will then decrease venous return and cardiac output [3]. On the other hand, ventilating patients with the same Paw plateau of 30 cm H2O but with a low chest wall elastance, will generate a high transpulmonary pressure, which is the true pulmonary distending pressure and the one that generates lung damage at high values [3] (Figure 2).
FIGURE 2
Representation of airway and pleural (oesophageal) pressures in 2 patients with different chest wall and lung elastance during end inspiration and end expiration. Two patients with different mechanical properties of the lung and chest wall are presented; both ventilated with the same high plateau pressure (Paw plateau) and high airway driving pressure (ΔPaw) (represented in yellow). In A, the patient has high chest wall elastance, and therefore presents a low transpulmonary pressure (PL plateau) and a low transpulmonary driving pressure (ΔPL) (represented in green), thus with a low risk of lung damage. At the same time, it presents high pleural pressures (e.g. ΔPes) (represented in red), which probably implies some haemodynamic repercussion. Patient B with high pulmonary elastance has high transpulmonary pressure (PL plateau) and high transpulmonary driving pressure (ΔPL) with the consequent risk of lung damage (represented in red) but with low pleural pressures therefore (e.g. ΔPes) (represented in green), without haemodynamic repercussions. Actually, the risks of mechanical ventilation in patients ventilated with similarly high airway pressures range from the risk of lung damage if the lung elastance is high and the chest wall elastance is low, and haemodynamic instability in the opposite situation [3, 31]. Where Paw plateau is airway plateau pressure, PEEP is positive end expiratory pressure, ΔPaw is airway driving pressure, PL PEEP is transpulmonary pressure at end of expiration, ΔPL is transpulmonary driving pressure o lung driving pressure, ΔPes is oesophageal driving pressure or driving pressure across the chest wall (ΔPcw) or the change in pleural pressure between the end of inspiration and the end of expiration (ΔPpl), PL plateau is transpulmonary pressure at the end of inspiration, Pes plateau is oesophageal pressure at the end of inspiration, and Pes PEEP is oesophageal pressure at the end of expiration. All pressures are expressed in cm H2O
Therefore, we consider that using a single Paw plateau level to define potential harm could be overly simplistic, and it could lead to the administration of insufficient pressure to some patients and excessive pressure to others [36]. Given that what generates VILI is not the pressure applied to the airway but rather the pressure applied to the lungs (transpulmonary pressure), it follows that a better limit or safe pressure threshold could be a transpulmonary pressure level rather than a certain Paw plateaulevel [36].
For this reason, there are authors who propose monitoring oesophageal pressure in patients with risk factors for chest wall stiffness. In these cases of high chest wall elastance, a safe threshold of 30 cm H2O for plateau pressure may actually be higher and still be safe [1].
Application in clinical practice
It is suggested that a Paw plateau below 25–28 cm H2O should be used in mechanically ventilated patients without ARDS during both volume-controlled and pressure-controlled ventilation [7].
Its use as the only safety parameter without taking into account other features of patient mechanics could lead to an insufficient ventilation (in patients with high chest wall elastance such as in obesity) or an excessive one (in patients with high lung elastance such as in ARDS). Therefore, it should be used considering other patient factors, such as the ones that increase or decrease chest wall elastance. We can mention 3 scenarios:
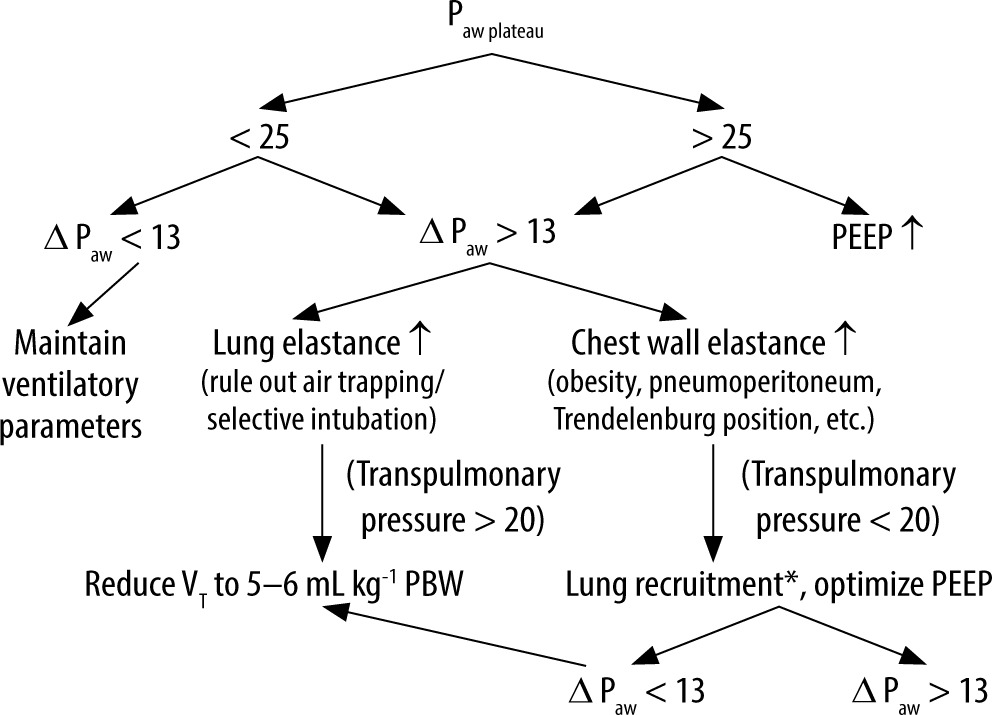
If the Paw plateau is less than 25 cm H2O and airway driving pressure is less than 13 cm H2O, then ventilatory parameters could be maintained because we would be ventilating within limits that are considered safe.
If the Paw plateau is greater than 25 cm H2O, considering its determinants, it should be ruled out that this is not generated by high PEEP levels.
If the Paw plateau is greater than 25 cm H2O and the airway driving pressure is greater than 13 cm H2O, considering PEEP levels within certain limits, causes of increased respiratory system elastance should be assessed (Figure 3).
FIGURE 3
Algorithm for programming protective ventilation parameters: VT = 6–8 mL kg-1 PBW, RR targeting an EtCO2 of 35 to 45 mmHg, PEEP ≥ 5 cm H2O, I : E ratio (the one that allows expiratory flow to reach zero, and the longest inspiratory time e.g. 1 : 1.5), if high peak airway pressure, check high Delta peak plateau and rule out kinked orotracheal tube, secretions, mucus, etc.). Where VCV is volume control ventilation, VT is tidal volume, RR is respiratory rate, PEEP is positive end expiratory pressure, I : E ratio is the ratio between inspiratory time : expiratory time, Paw plateau is airway plateau pressure, and ΔPaw is airway driving pressure. *The decision to recruit the lung should also be based on other parameters such as the air test, the increased capnographic gap (PaCO2 – End tidal CO2) and/or decreased PAFI. All pressures are expressed in cm H2O
Airway driving pressure
The airway driving pressure (ΔPaw) or (ΔPrs) (respiratory system driving pressure) is the pressure required during lung expansion to overcome the elastic forces generated by the lung parenchyma, pleura, and chest wall [28]. Unlike the plateau pressure it represents the pressure above PEEP required to overcome the elastic recoil of the respiratory system as a whole generated by the delivery of tidal volume [27].
Another way of interpreting the ΔPaw is the oscillation between the end of inspiration and the end of expiration of the respiratory system elastic pressure [37]. Thus, assuming that there is no auto-PEEP, ΔPaw estimates the increase in alveolar pressure during inspiration and its decrease during expiration representing the pressure change during tidal volume ventilation [15, 29].
It is important to recognize that ΔPaw involves 2 components, one related to the expansion of the lung and the other related to the expansion of the chest wall [38].
ΔPaw = ΔPL + ΔPpl,
where ΔPL is the transpulmonary driving pressure and ΔPpl is the change in pleural pressure or driving pressure across the chest wall (ΔPCW) or oesophageal driving pressure (ΔPes) (Figure 1 and Table 1).
This implies that ΔPaw can be elevated by both elastic components or at the expense of one of them. Therefore, increases in chest wall elastance in isolation can affect this parameter without increasing pulmonary stress, globally represented by transpulmonary driving pressure [5].
Chest wall elastance may be increased in conditions such as obesity, abdominal compartment syndrome, kyphoscoliosis, chest wall burns, or increased muscle tone due to dyssynchrony with the ventilator. Conversely, it could be decreased by muscle paralysis [39].
ΔPaw is easily calculated at the bedside as the difference between the plateau pressure and PEEP.
ΔPaw = Paw plateau – PEEP
It is equivalent to the relationship between VT and respiratory system compliance (Crs) [14]. So, assuming Crs reflects the amount of aerated lung volume, ΔPaw is considered a surrogate of dynamic or cyclic lung strain (or stretch). The latter is defined as the ratio between VT and FRC [32]. Therefore, the higher the FRC, the higher the Crs (due to greater aerated lung volume) and the lower the ΔPaw. In this way ΔPaw, unlike Paw plateau and PEEP (which are static estimates of stress in the respiratory system), constitutes a dynamic indicator because it represents the cyclic strain that lung parenchyma (and the chest wall) are exposed to during each ventilatory cycle [2, 15].
ΔPaw = VT/Crs
ΔPaw = VT × Ers,
where VT is the tidal volume, Crs is the respiratory system compliance, and Ers is the respiratory system elastance. ΔPaw conveys the relationship between the VT applied above a certain PEEP and the respiratory system compliance.
Using a statistical model known as multilevel mediation analysis, information from 3562 patients with ARDS was analysed from 9 randomized controlled trials, which demonstrated that ΔPaw is the ventilatory parameter that best predicts survival at 60 days in ARDS [37, 40] and not VT or PEEP [2].
Amato et al. [40] suggested that the ventilatory impact of VT on lung injury could be better predicted if it was normalized to Crs rather than PBW. ΔPaw was shown to be the final mediator on the effects of lowering VT and Paw plateau on mortality in patients with ARDS [29].
A recent meta-analysis involving 17 studies and more than 2250 patients showed that changes in PEEP levels that resulted in an increase in ΔPaw (i.e. without modifying or even decreasing Crs) were associated with greater postoperative pulmonary complications [2, 32].
In patients with low lung compliance (e.g. with atelectasis, consolidation, oedema), even setting low VT (< 6 mL kg-1 PBW) could result in high ΔPaw, i.e. in high strain (VT/CRF) [16].
For this reason, it is suggested that VT should be adjusted considering ΔPaw (or VT/Crs). Because Crs is directly related to the aerated lung volume, ΔPaw reflects the level of VT related to the aerated lung volume [1]. Using ΔPaw as a safety limit, it could be a better way to adjust VT to decrease dynamic or cyclic strain during mechanical ventilation [2, 5].
Most surgical patients (without ARDS) will have ΔPaw < 10 cm H2O, reflecting a normal or close to normal Crs. In contrast, in patients with moderate to severe ARDS or other restrictive diseases (e.g. major pulmonary effusions, interstitial diseases, etc.), it will be more common to find an ΔPaw > 10 cm H2O, reflecting either a decreased Crs or an inappropriate selection of VT or PEEP [2].
Even more, VT could be higher than 6 mL kg-1 and ΔPaw could remain below 14 cm H2O [15]. Limiting ΔPaw, possibly keeping it below 14 cm H2O, can be achieved either by decreasing VT or by increasing Crs [37]. If the former remains constant and the latter increases, ΔPaw will decrease proportionally. Furthermore, under steady conditions in Crs, ΔPaw will increase if VT increases [7].
One way to increase compliance is through lung recruitment with recruitment manoeuvres and a higher PEEP level or through prone positioning [1, 21, 23].
In this context, ΔPaw could also be a valuable tool for setting PEEP. Regardless of the strategy used to titrate PEEP, changes on its levels should be considered in the impact on ΔPaw, in addition to other variables such as gas exchange and haemodynamics [2]. A decrease in ΔPaw after increasing PEEP ne-cessarily reflects lung recruitment and a decrease to their cyclic strain. Conversely, an increase in ΔPaw suggests a non-recruitable lung in which overdistention prevails over recruitment [7].
If, after optimizing PEEP, ΔPaw remains > 15 cm H2O, it is suggested that VT should be lowered and causes of increased chest wall elastance be considered. In these cases, the placement of an oesophageal catheter to measure transpulmonary driving pressure (ΔPL) could be a useful strategy [2], although this strategy is probably not a practical recommendation and is not applicable in the field of anaesthesiology.
It is suggested that a target of ΔPaw < 13–15 cm H2O be used [41].
Limitations
A problem with this parameter to help in the guidance of VT selection is that one of its components is the plateau pressure, which, as we mentioned above, is influenced by the chest wall elastance. Thus, 2 patients with the same ΔPaw may have different risk of VILI. A high ΔPaw in the context of high chest wall elastance probably implies that this is due to the chest wall component and that the lung is not being subjected to high and injurious pressures [2, 15]. In this scenario, ΔPaw may be high at the expense of ΔPpl, with transpulmonary driving pressure being at normal or low values.
↑ ΔPaw = ΔPL + ↑ ΔPpl
↑ ΔPaw = VT x EL + VT × ↑ ECW,
where ΔPaw is airway driving pressure, ΔPL is transpulmonary driving pressure, ΔPpl is oesophageal driving pressure, VT is tidal volume, EL is lung elastance, and ECW is chest wall elastance. Oeso-phageal driving pressure is elevated due to increased chest wall elastance (Figures 1 and 4).
FIGURE 4
Determinants of protective ventilation parameters. Where Paw plateau is airway plateau pressure, VT is tidal volume, PEEPvolume is volume generated by PEEP, Ers is respiratory system elastance, EL is lung elastance, Ecw is chest wall elastance, PL plateau is transpulmonary pressure at the end of inspiration, Pes plateau is oesophageal pressure at the end of inspiration, PL PEEP is transpulmonary pressure at end of expiration, ΔPL is transpulmonary driving pressure or lung driving pressure, ΔPes is oesophageal driving pressure or driving pressure across the chest wall (ΔPcw) or the change in pleural pressure between the end of inspiration and the end of expiration (ΔPpl), Pes PEEP is oesophageal pressure at the end of expiration, and ΔPaw is airway driving pressure or respiratory system driving pressure (ΔPrs) [31]
Thus, a high value of airway driving pressure may overestimate the risk of lung injury [42].
Therefore, in these cases of increased chest wall elastance, a better indicator of the dynamic stress lungs are being subjected to in isolation is transpulmonary pressure or transpulmonary driving pressure. These could be measured, limiting VT to keep it within a safe range [14–16]. However, as we mentioned, it is a difficult measurement to implement in anaesthesiology due to the cumbersome and impractical nature of placing an oesophageal catheter and measuring pleural pressures intraoperatively.
Finally, the effects of PEEP and its continuous strain are not considered in the ΔPaw approach. For example, a theoretically safe level of 12 cm H2O of ΔPaw could become harmful if PEEP is 20 instead of 0 cm H2O [36]. This implies that an ΔPaw still in the safe range could be injurious if PEEP levels are high, generating overdistention per se.
This is because VILI related to excessive strain can be linked to its static and dynamic components. Static strain results from application of PEEP and its resultant deformation in the lungs above their functional residual capacity. Dynamic strain results from cyclic insufflation of the aerated lung with each ventilation and is therefore linked to ΔPaw [15] (Table 1).
Application in clinical practice
In situations of high chest wall elastance (e.g. capnoperitoneum, obesity, increased intra-abdominal pressure, etc.), airway driving pressure may be high at the expense of an increase in pleural pressures (oesophageal driving pressure or ΔPes), without the lung being at risk of damage, because the true pulmonary distending pressure (transpulmonary driving pressure or ΔPL) will be at a lower level. If this is not considered, ventilatory parameters could be unnecessarily reduced to lower the value of airway driving pressure, which runs the risk of increasing atelectasis. In these cases of suspected high chest wall elastance, it would make more sense to assess the option of recruitment and optimization of PEEP levels to improve lung compliance and therefore decrease ΔPaw [23].
Conversely, in cases where it is estimated that chest wall elastance is not elevated, airway driving pressure represents a good surrogate of transpulmonary driving pressure. In addition, there may be scenarios in which there is low ΔPaw but excessively high PEEP (e.g. 20 cm H2O), causing a static strain high enough to induce lung damage.
Finally, if ΔPaw is high at the expense of high lung elastance (e.g. ARDS), the most appropriate behaviour would be to lower VT to decrease airway driving pressure (Figure 3).
Transpulmonary pressure
Transpulmonary pressure (PL) is the pressure that distends the lungs in isolation. It constitutes the pressure generated in the lungs regardless of the effects on the chest wall and abdomen [29]. It is represented by the pressure difference between the inside of the lung (airway pressure) and the pressure on the surface of the lung (pleural pressure or its surrogate oesophageal pressure) [3]. PL is the relevant pressure when we consider the stress applied to lung tissue in each insufflation, and because a certain stress is associated with a certain strain, PL is strictly related to VILI generation [3, 33, 38].
Measurement of PL can be done at the end of inspiration or at the end of expiration [32].
When measured at the end of inspiration or at plateau pressure (PL plateau), it is relevant when it comes to preventing damage from lung hyperinflation [3, 38]:
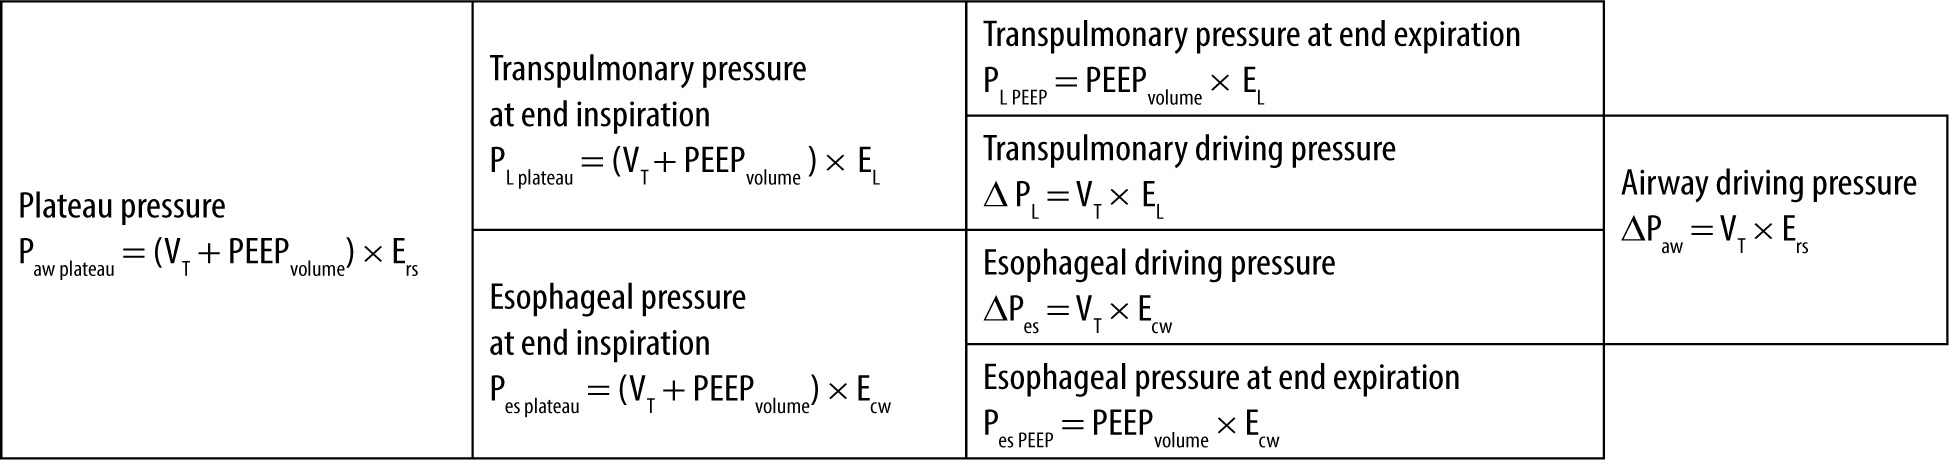
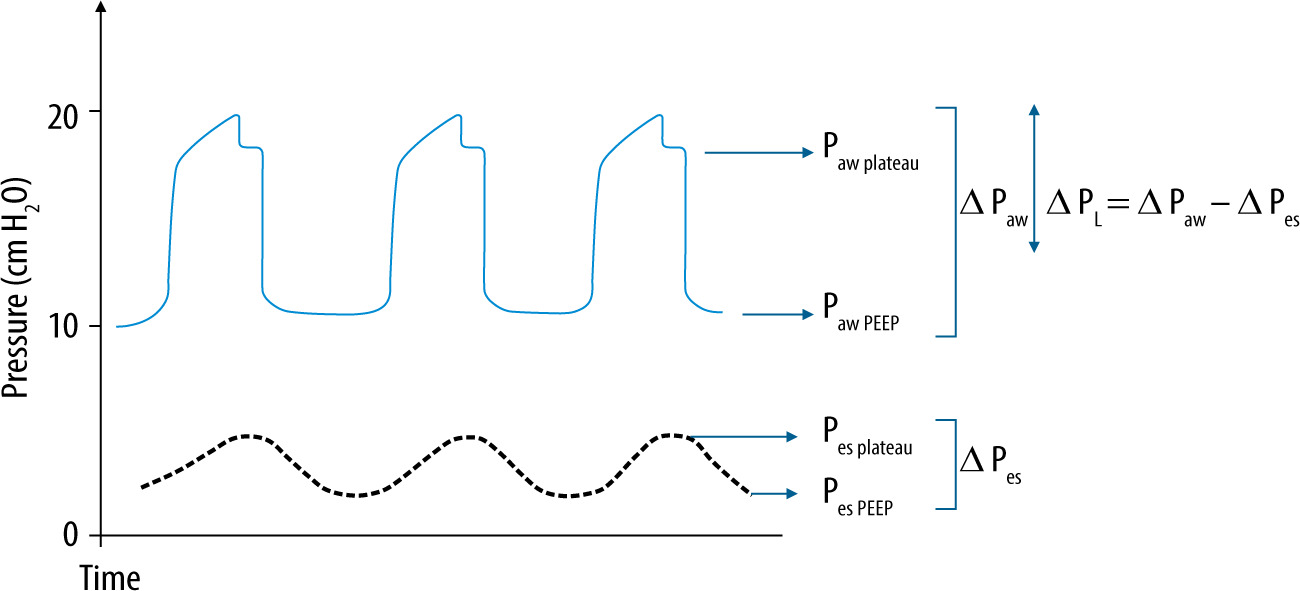
PL plateau = Paw plateau – Pes plateau,
where PL plateau is transpulmonary pressure at the end of inspiration, Paw plateau is airway plateau pressure, and Pes plateau is oesophageal pressure at the end of inspiration (Figures 4 and 5).
FIGURE 5
Representation of transpulmonary pressures. Airway pressure waveforms and oesophageal pressure waveforms. The double arrow represents the difference between the airway driving pressure (ΔPaw) and the oesophageal driving pressure (ΔPes), which is the transpulmonary driving pressure (ΔPL). Paw plateau is airway plateau pressure, Paw PEEP is positive end expiratory pressure or PEEP, ΔPaw is airway driving pressure, ΔPL is transpulmonary driving pressure or lung driving pressure, ΔPes is oesophageal driving pressure or driving pressure across the chest wall (ΔPcw) or the change in pleural pressure between the end of inspiration and the end of expiration (ΔPpl), Pes plateau is oesophageal pressure at the end of inspiration, and Pes PEEP is oesophageal pressure at the end of expiration
PL measured at the end of expiration, or transpulmonary pressure associated with PEEP (PL PEEP) is relevant to preventing lung collapse [3, 38]:
PL PEEP = PEEP – Pes PEEP,
where PL PEEP is transpulmonary pressure at the end of expiration, PEEP is positive pressure at the end of expiration, and Pes PEEP is oesophageal pressure at the end of expiration (Figure 4).
The PL measured at the end of inspiration (PL plateau), represents the total stress given by the cyclic stress to which lungs are exposed during each ventilation (transpulmonary driving pressure or ΔPL) and the addition of the static stress measured by PL at the end of expiration (PL PEEP) [43]:
PL plateau = ΔPL + PL PEEP
(VT + PEEPvolume) × EL = (VT × EL) + (PEEPvolume × EL),
where PL plateau is transpulmonary pressure at end inspiration, ΔPL is transpulmonary driving pressure, PL PEEP is transpulmonary pressure at end expiration, VT is tidal volume, EL is lung elastance, and PEEPvolume is the volume generated by PEEP (Figure 4).
For a given Paw plateau, the PL plateau depends on the relationship between lung elastance (EL) and that of the respiratory system (Ers), the latter being the sum of EL plus ECW [3, 44].
PL = Paw plateau × (EL/Ers),
where, PL is transpulmonary pressure at the end of inspiration, Paw plateau is airway plateau pressure, EL is lung elastance, and Ers is respiratory system elastance.
If we consider, for example, a patient with an elastance ratio of 0.8 (EL/Ers = 0.8) (e.g. ARDS) and an Paw plateau of 30 cm H2O, their PL will be 24 cm H2O. This is considered a pulmonary distending pressure level that corresponds to a dangerous lung volume close to total lung capacity. In contrast, for another patient with an elastance ratio as low as 0.2 (e.g. obesity or pregnancy), the same Paw plateau of 30 cm H2O will correspond to a PL of only 6 cm H2O, which may be associated with lung collapse and hypo-xaemia [3, 36].
In this way, it follows that for the same VT and Paw plateau, depending on the relationship between EL and Ers, it could result in completely different PL and, consequently, different risks of VILI [4, 45].
Measurement of pressure that distends lungs alone may be a better approach to guiding ventilatory management, especially in patients with increased chest wall elastance in whom the Paw plateau and airway driving pressure are elevated, but without this necessarily implying a risk of lung damage [4]. For a given VT, a stiffer chest wall will lead to the development of higher pleural pressures because more of the airway driving pressure will be displacing the chest wall. In these cases, for a given Paw plateau, transpulmonary pressure will become lower as chest wall elastance increases (e.g. abdominal hypertension or severe obesity) and vice versa [46] (Figure 2).
Although direct measurement of pleural pressure through pleural catheters is theoretically and practically possible, the most practical way to estimate pleural pressure in clinical practice is oesophageal manometry [3].
To better characterize ventilatory mechanics, PL must be estimated under static conditions, i.e. when flow in the system is zero. This is mandatory to prevent having to take into account the pressure necessary to exceed airway resistance. The pressure measured under static conditions, during an inspiratory pause, is the plateau pressure, already referred to in this article [3].
Assessment of PL could be useful for several reasons. On the one hand, for differentiating patients who could benefit from higher airway pressures due to their increased chest wall elastance from those who, despite having low airway pressure levels, are still under risk of overdistention [4]. Another bene-fit of its use would be for determining the pressure required to keep lungs open. Because oesophageal pressure is a surrogate of pleural pressure, a negative transpulmonary pressure at the end of expiration would correspond to collapsed lungs [3]. It has therefore been proposed for choosing PEEP levels, aiming to obtain a positive value of transpulmonary pressure at the end of expiration, and thus avoiding atelectasis [29].
Limiting PL to less than 15–20 cm H2O appears to be a physiologically reasonable approach for mitigating VILI [30, 32, 38].
Limitations
Transpulmonary pressure is the total load imposed to the elastic fibres of the lung parenchyma. However, if lungs are heterogeneous, it may have an additional load in lung interface areas with a multiplication factor that can reach “2” according to the stress raiser model (calculation of Cressoni et al.) [47]. This means that a transpulmonary pressure of 30 cm H2O can reach a local value of up to 60 cm H2O in interface areas between open and closed regions of the lungs [27]. Therefore, global indices (such as PL) do not reflect regional stress or strain [5]. This is important for 2 reasons. One is that in patients with pathologies that cause pulmonary heterogeneities, target values for PL should be lower. And the second is that a pulmonary homogenization strategy in lungs with atelectasis, such as prone positioning or selecting adequate PEEP levels, would be beneficial by reducing stress raisers [26, 44, 48, 49].
Another limitation of using only an isolated PL value to guide mechanical ventilation in a protective way is that it also does not take into account the ventilatory rate and inspiratory flow as variables that also contribute to VILI development [3]. In this line of thought, mechanical power is an integrative and comprehensive parameter that involves all the components related to lung injury due to mechanical ventilation. It is easy to understand that, for the same transpulmonary pressure, we can have different associated mechanical power values depending on all the other variables that contribute to it (such as PEEP levels, respiratory rate, VT, inspiratory flow, and ΔPaw) [3, 49].
Application in clinical practice
Despite its cumbersome measurement that reduces its applicability, it helps us as a concept to understand possible causes of high airway pressures and to differentiate between the pressure to which lungs are exposed and the pressure that acts on the chest wall and the abdomen.
PL plateau is included, together with oesophageal pressure at the end of inspiration (Pes plateau), within the parameters that determine Paw plateau. So, if we assume that chest wall elastance is normal, then Paw plateau could be a good surrogate of PL (Figure 4).
Paw plateau = PL plateau + Pes plateau
On the other hand, if the chest wall elastance is high, the Paw plateau will be mainly determined by pleural pressure (or its surrogate, oesophageal pressure). In this way, we can infer whether the ventilation is damaging the lungs (i.e. elevated PL) or the patient’s haemodynamics (i.e. elevated Pes) by decreasing the venous return [50, 51]. Differences between Paw plateau and PL will be more pronounced in obese patients or others with restrictive chest wall disorders (i.e. high chest wall elastance). In these cases, low transpulmonary pressure (less than 20 cm H2O) is considered a protective ventilatory strategy regardless of the Paw plateau [21] (Figure 2).
Transpulmonary driving pressure
Transpulmonary driving pressure (ΔPL) or lung driving pressure, represents the change or oscillation in transpulmonary pressure generated by VT between the end of inspiration and the end of expiration [29]. It is calculated from the transpulmonary pressure difference between the PL plateau and PL PEEP.
ΔPL = PL plateau – PL PEEP
(VT × EL) = (VT + PEEPvolume) × EL – (PEEPvolume × EL),
where ΔPL is transpulmonary driving pressure, PL plateau is transpulmonary pressure at the end of inspiration, PL PEEP is transpulmonary pressure at the end of expiration, VT is tidal volume, EL is lung elastance, and PEEPvolume is volume generated by PEEP (Figure 4).
In other words, the transpulmonary driving pressure (ΔPL) would be equivalent to the transpulmonary pressure at end inspiration (PL plateau) without the distending pressure generated by PEEP (PL PEEP).
Another method of analysing and interpreting transpulmonary driving pressure is through ΔPaw. The airway driving pressure is composed of 2 pressures: the one applied in the lung (ΔPL) and the one to the chest wall (ΔPpl) [38]:
ΔPaw = ΔPL + ΔPpl,
where ΔPaw is airway driving pressure, ΔPL is transpulmonary driving pressure, and ΔPpl is change in pleural pressure or driving pressure across the chest wall (ΔPCW) [5] or oesophageal driving pressure (ΔPes) [2] (Figures 4 and 5).
The oesophageal driving pressure (ΔPes) is the change in oesophageal pressure between inspiration and expiration and represents the pressure applied to the chest wall above PEEP due to VT delivery.
ΔPes = Pes plateau – Pes PEEP [3],
where ΔPes is oesophageal driving pressure, Pes plateau is oesophageal pressure at the end of inspiration, and Pes PEEP is oesophageal pressure at the end of expiration (Figure 4).
Terminology clarification: it is possible to find in the literature the change in pleural pressure expressed as ΔPpl or ΔPes or ΔPCW called oesophageal driving pressure [2], which represents the distending pressure of the chest wall in isolation, which is elevated in situations of high chest wall elastance.
Therefore, if we solve for the transpulmonary driving pressure from the previous equation:
The transpulmonary driving pressure (ΔPL) is the same as the airway driving pressure (ΔPaw) without the distending pressure generated by the chest wall or oesophageal driving pressure (ΔPes) [52].
ΔPL = ΔPaw – ΔPes
ΔPL = (Paw plateau – PEEP) – (Pes plateau – Pes PEEP)
VT × EL = (VT × Ers) – (VT × Ecw),
where, ΔPL is transpulmonary driving pressure, ΔPaw is airway driving pressure, ΔPes is oesophageal driving pressure, Paw plateau is airway plateau pressure, PEEP is positive pressure at end of expiration, Pes plateau is oesophageal pressure at the end of inspiration, Pes PEEP is oesophageal pressure at the end of expiration, VT is tidal volume, EL is lung elastance, Ers is respiratory system elastance, and Ecw is chest wall elastance (Figures 4 and 5).
Therefore, ΔPL only represents the pulmonary distending pressure generated by delivery of tidal volume without taking into account the pressure component required to mobilize the chest wall (ΔPes) [29]. Both the properties of the chest wall and the abdomen influence ΔPaw measurement. This influence can be misleading because an increase in chest wall elastance does not reflect an increase in the risk of lung injury and will still lead to an increase in ΔPaw [38].
Because differences between ΔPL and ΔPaw are mainly due to increases in chest wall elastance, the latter can vary with respect to the former between minimal (e.g. lean patients, pneumonia) and wider (e.g. morbid obesity, abdominal hypertension) differences [2, 14]. For this reason, in these cases of high chest wall elastance, it is advisable to assess ΔPL through an oesophageal catheter to appropriately quantify stress applied to the lungs. However, in conditions where chest wall elastance is normal and stable, changes in ΔPaw will provide an appropriate surrogate for changes in ΔPL and lung strain [38] (Figure 4).
The 14 cm H2O limit of ΔPaw suggested as a safety parameter for ventilation will depend on the elastance ratio (EL/Ers). ΔPL depends, for a given ΔPaw, on the relationship between lung elastance and respiratory system elastance:
ΔPL = ΔPaw × (EL/Ers),
where ΔPL is the transpulmonary driving pressure and ΔPaw is the airway driving pressure.
Taking as an example a ΔPaw value of 14 cm H2O, this value can range from a ΔPL of 2.8 cm H2O (with an elastance ratio of 0.2) to 11.2 cm H2O (with an elastance ratio of 0.8) [3]. Therefore, the same ΔPaw with a limit value of 14 cm H2O but with a ΔPL of 2.8 cm H2O would have a lower risk of lung damage than another patient with the same ΔPaw and a ΔPL of 11.2 cm H2O (value close to the limit of 10–12 cm H2O).
ΔPL has several benefits. First, unlike PL but like ΔPaw, it removes the stress caused by PEEP levels, which does not necessarily contribute to lung injury and can sometimes even mitigate it [16, 29]. Second, like PL but unlike ΔPaw, it removes distending pressure from the chest wall [29]. Third, it is conceived that ΔPL would better reflect the presence of regional inhomogeneities in mechanical properties of the lungs (i.e. overdistention and atelectasis). An increase in ΔPL would be a better parameter to estimate tissue tension than other measurements of the respiratory system. Therefore, this parameter would represent a better surrogate of pulmonary stress and even a better predictor of clinical results than PL [16].
In the clinical setting, upper limits of transpulmonary driving pressure would be 10–12 cm H2O [37] (Table 1).
Limitations
The use of an oesophageal catheter and the difficulties in its measurements and interpretation limit its applicability.
According to Gatinoni et al. [3], measurement of oesophageal pressure and the data derived from it (PL and ΔPL) have very limited use in clinical practice despite being key variables to guide mechanical ventilation in a safe way. The author considers that this occurs mainly due to 2 reasons: first of all, the “the fatigue of studying”, which involves the wise use of data derived from the measurement of oesophageal pressure that requires an adequate cultural background. Second, due to the “fatigue of acting”, which points to the work that is added to usual clinical practice.
Application in clinical practice
ΔPL then represents the distending force that acts only in the lung [1]. Therefore, if we use PL and/or ΔPL as a target for protective ventilation, we will be approaching the true values that generate lung damage during mechanical ventilation. However, the use of an oesophageal catheter is time consuming and is difficult to apply in everyday anaesthetic practice.
In patients under mechanical ventilation, ΔPL will always be lower than ΔPaw because it does not consider chest wall elastance [2, 14]. Because the ΔPL is contemplated within ΔPaw, considering that the chest wall component of elastance is not elevated, then ΔPaw will be a good surrogate for the ΔPL [38] (Table 1).
CONCLUSIONS
Protective ventilation strategies for the patient under general anaesthesia involve the interpretation of a number of parameters. A thorough knowledge of their determinants and limitations is essential to individualize their use in clinical practice according to the best available evidence. Some of these parameters are part of the information that most mechanical ventilators and anaesthesia machines routinely display (e.g. VT, PEEP, Paw peak, Paw plateau, and ΔPaw). Others are less accessible in an operating theatre situation (e.g. PL and ΔPL), but their understanding contributes to monitoring and configuration of the traditional protective ventilation parameters. In patients in whom chest wall elastance is not elevated, airway plateau pressure may be a good surrogate of transpulmonary pressure, and airway driving pressure of transpulmonary driving pressure. Conversely, in the presence of increased chest wall elastance, airway plateau pressures or airway driving pressure at their superior limit values could be considered non-injurious to the lungs.