1. Introduction
The lipid profile, which is routinely done to assess a cardiovascular risk, involves the measurement/calculation of serum/plasma levels of total cholesterol (TC), high-density lipoprotein cholesterol (HDL-C), low-density lipoprotein cholesterol (LDL-C), triglycerides (TG) and non-HDL cholesterol (non-HDL-C), although LDL-C measurement still plays a key role in the diagnosis, prediction and the monitoring of both the course and treatment of lipid disorders [1–3]. The results of the measurements indirectly and approximately reflect the blood content of individual lipoproteins. Quantitative measurement of atherogenic lipoproteins, i.e. LDL, lipoprotein(a) [Lp(a)], chylomicron (CM) remnants and very low-density lipoprotein (VLDL) remnants, is of special importance in laboratory assessment of lipid metabolism and the risk of atherosclerosis progression [2, 3]. This is why lipid profile, which usually applies only to the LDL level, should be supplemented with the measurement of Lp(a) as well as CM and VLDL remnants, if possible.
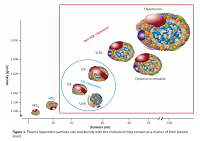
Lipoproteins are a family of large particles composed of an “envelope”, which contains phospholipids and free cholesterol, and a core containing TG and cholesterol esters. The lipid part is bound to specific proteins – apolipoproteins (apo), which determine the physical and biological properties of lipoproteins [3]. Lipids are not covalently attached to proteins. The structure of lipoproteins is maintained primarily by hydrophobic interactions between nonpolar components of lipids and proteins. Lipoprotein classification reflects the particle size and density in the aqueous plasma environment as well as the content of apolipoproteins (Figure 1). Triglyceride-rich CM and VLDL as well as CM and VLDL remnants have a density of less than 1.006 g/ml. LDL, HDL and Lp(a) are lipoproteins with a density of over 1.006 g/ml [3].
Figure 1
Plasma lipoprotein particles size and density with the cholesterol they contain as a marker of their plasma levels
The system of lipid transport with the involvement of lipoproteins has two main functions:
Transport of triglycerides from the intestine and liver to the adipose tissue and muscles (intestinal pathway);
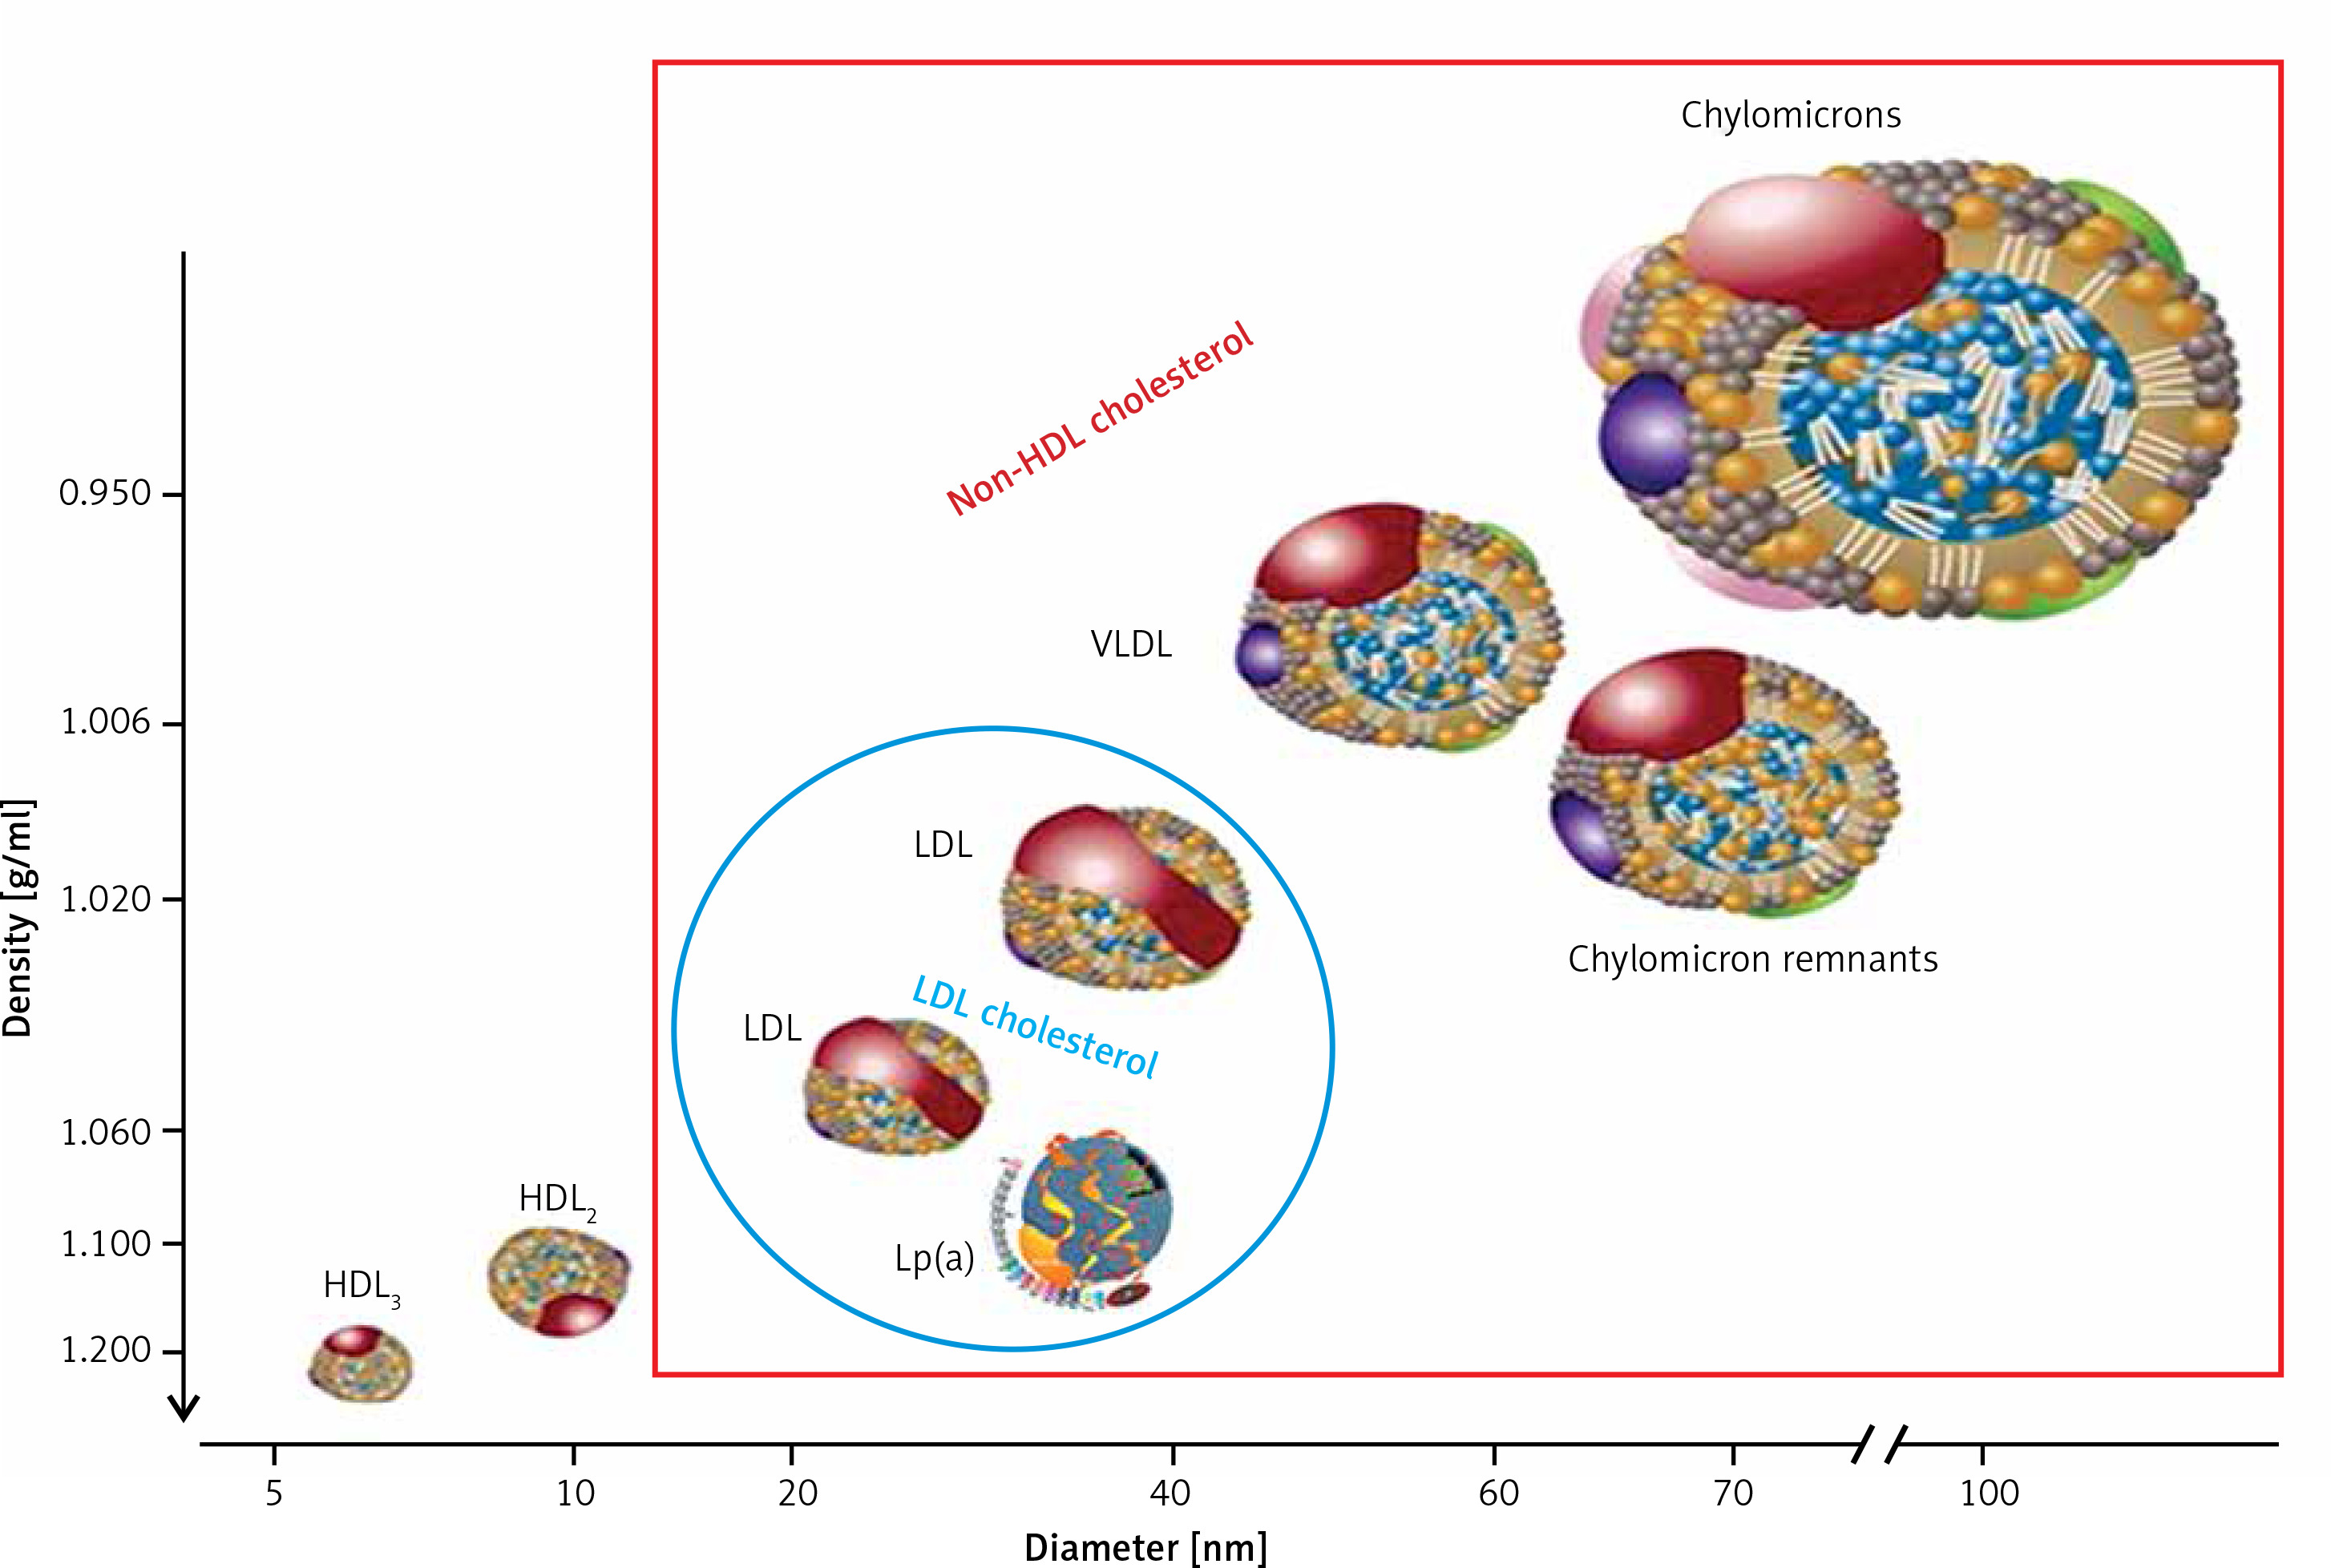
Supply of cholesterol to the peripheral tissues, where it is essential for the formation of cell membranes and biosynthesis of steroid hormones, and to the liver, where it is used for the synthesis of bile acids (hepatic pathway) (Figure 2).
Dietary TG are hydrolysed in the intestine into free fatty acids (FFA), mono- and diglycerides, absorbed with the exogenous cholesterol by enterocytes, in which CM that transport them are formed and subsequently enter the circulation through the lymphatic system. Lipoprotein lipase (LPL) bound to the capillary endothelium of the adipose tissue and muscles hydrolyses the TG they contain into glycerol and FFA, forming CM remnants contained in the intermediate density lipoproteins (IDL) fraction [1–3]. Endogenous TG are synthesized in hepatocytes, where jointly with cholesterol and apolipoproteins (apoB 100, apoE, apoC) constitute building material for VLDL secreted into the blood, where their remnants (IDL) are formed by an action of endothelial lipase (EL). LDL are formed from IDL with the involvement of hepatic lipase (HL) and are enriched with HDL cholesterol, with the involvement of the cholesterol ester transfer protein (CETP) [1–3].
Figure 2
Lipoprotein metabolism and transport
ABCA1 – ATP-binding cassette transporter A1, CETP – cholesterol ester transfer protein, EL – endothelial lipase, HL – hepatic lipase, LCAT – lecithin cholesterol acyltransferase, LPL – lipoprotein lipase, PLTP – phospholipid transfer protein, TG – triglycerides.
HDL particles are formed in the liver and intestine as well as in the course of CM and VLDL degradation, from their superficial phospholipids and free cholesterol. The free cholesterol is taken up from peripheral cells (including macrophages in the vascular wall) by nascent HDL and HDL3 subfraction, with the involvement of ATP-binding cassette transporter A1 (ABC1), which binds to apoA-I and is subsequently esterified by plasma lecithin–cholesterol acyltransferase (LCAT) [1–3]. Cholesterol esters are transported by mature HDL2 bound by the scavenger receptor, class B type 1 (SR-B1) in hepatocytes, where they are used for bile acid synthesis. This is a so-called direct mechanism of reverse cholesterol transport. By an indirect mechanism, CETP transfers them from HDL to apoB-containing lipoproteins, with an exchange for TG. ApoB-containing lipoproteins are uptaken by the liver via LDL receptors as well as other membrane receptors (VLDL receptors, apoE receptors). TG hydrolysis in HDL2 by HL leads to the formation of HDL3 (Figure 2) [2–4].
Currently available analytical methods provide only indirect, approximate insight into the transformation of both cholesterol and TG or the metabolism and functions of lipoproteins. In clinical practice, the diagnostics of lipid metabolism disorders is a part of the assessment and control of the risk for atherosclerosis and related cardiovascular diseases (CVD). Therefore, laboratory work-up for dyslipidemia, defined as a condition in which blood levels of lipids and lipoproteins are outside the desirable range, is aimed at measuring the amount of atherogenic lipoproteins in the blood. The methodological approach to lipoproteins measurement is diversified – its blood content may be determined directly as the number of particles (LDL-P, HDL-P, Lp(a)-P) or their concentration, or indirectly by measuring the concentration their individual components – cholesterol or apolipoprotein (apoB, apoA-I).
2. Organisation of the guidelines
The members of the Steering Committee who prepared these guidelines were selected by the Polish Society of Laboratory Diagnostics (PSLD) and the Polish Lipid Association (PoLA) as experts in the diagnosis and treatment of lipid metabolism disorders. The Steering Committee has carried out a detailed review of the published scientific evidence on the management of dyslipidemia, including its diagnosis, treatment, monitoring and prevention, as well as critical evaluation of the diagnostic and therapeutic procedures, including the benefit-risk assessment. Every chapter is summarized in a box containing clear and easy to understand recommendations, highlighting the information that needs to be remembered and the key points of the recommendation.
The experts comprising the teams that developed and peer-reviewed the guidelines filled in the conflict of interest forms with regard to all relationships which might be perceived as actual or potential sources of conflicts of interest. After the final approval of the guidelines, the final version of the document is published simultaneously in the Diagnostyka Laboratoryjna (Journal of Laboratory Diagnostics), indicated by PSLD and Archives of Medical Science (indicated by PLA).
Laboratory diagnosticians and physicians of various specialties who deal with patients with lipid disorders are encouraged to take fully into account these guidelines when conducting clinical assessments as well as defining and implementing medical prevention, diagnosis or treatment strategies. Nonetheless, the guidelines in no way absolve physicians from individual responsibility for making right and accurate decisions, taking into account the patient’s health status and in consultation with the patient and, if necessary, with his/her caregiver. Healthcare professionals are responsible for verification of policies and regulations with regard to medicines and equipment at the time they are prescribed/used.
3. Preanalytical considerations
Tests comprising lipid profile, standard ones (TC, HDL-C, LDL-C, TG) as well as additional measurements of apoB and Lp(a), are performed in serum or plasma. The general approach to the pre-analytical phase is based on the assumption that lipid profile should be assessed in the setting of everyday activity and diet, and people are not in the fasted state for about 16 h a day [4, 5]. Therefore, blood samples for these tests do not need to be collected in the fasting state [6]. This approach is also recommended in the 2016 position statement of the European Atherosclerosis Society (EAS) and the European Federation of Clinical Chemistry and Laboratory Medicine (EFLM), which was based on data indicating that a slight postprandial increase in the TG level (to 27 mg/dl (0.3 mmol/l) does not result in significant changes in the lipid profile assessment compared to the testing of fasting samples. Small differences in the interpretation of results pertain to TG, non-HDL-C and the CM and VLDL remnants cholesterol. It is recommended that lipid profile be repeated in the fasting sample if the non-fasting TG level is > 4.5 mmol/l (400 mg/dl) [2, 6].
Recommendations
Routine lipid profile testing, primarily LDL-C and TC, does not require fasting samples. Retesting using material collected in the fasting state should be considered if non-fasting TG is > 4.5 mmol/l (400 mg/dl).
The levels of individual lipid profile components are characterized by intraindividual variability of 5–10% for TC and > 20% for TG. In addition to genetically determined mechanisms of lipid metabolism regulation, variability in TC levels is also caused by environmental factors such as physical activity, diet, smoking or long-term alcohol abuse while variability in TG levels is affected by diet, including carbohydrate and alcohol intake, and physical activity. Changes in lipid profile occur during pregnancy, especially in the third trimester (predominantly an increase in the TG, TC and Lp(a) levels, to a lesser degree the LDL-C and HDL-C levels) [7]. Seasonal variation is also observed, with increases in TC and TG levels during winter [5, 8, 9]. The TC and LDL-C levels are lower for several weeks after a CV event and in the course of chronic inflammation, e.g. rheumatic disease (lipid paradox), as well as in the elderly, especially over 75 years old [10–12].
Due to the fact that cholesterol and TG are components of macromolecular lipoproteins, wearing a constricting band for ≥ 3 min or remaining in the standing position for more than 30 min before blood sampling may cause a 10–12% increase in their levels as a result of the so-called haemocentration effect. Serum levels of TC, HDL-C, LDL-C and TG are approximately 3% higher than the plasma levels. Serum or plasma samples may be stored at a refrigeration temperature (+4°C) for up to 4 days. Longer storage requires freezing at –70°C.
4. Triglycerides
Triglycerides, triacylglycerol (TG), glycerol and long-chain fatty acids esters comprise the main components of the adipose cells and the main source of energy for the body. An increased TG level coexists with a low level of HDL-C and a high level of small-dense low-density lipoproteins (sdLDL) (atherogenic dyslipidemia). From a practical point of view, TG determination is critically important in assessing residual risk because a high level, even with a targeted LDL-C levels, significantly increases the risk of cardiovascular events [13, 14].
4.1. Methods of determination
TG is determined using enzymatic methods, usually after the release of glycerol by enzymatic or alkaline hydrolysis. Typically, TG in a serum/plasma sample are exposed to LPL, which results in the release of glycerol and FFA. Subsequently, 3-phosphoglycerol and adenosine-5-diphosphate (ADP) are formed from glycerol with the involvement of glycerol kinase and ATP. In a successive reaction, in the presence glycerol phosphate oxidase from 3-phosphoglycerol and molecular oxygen (O2), dihydroxyacetone phosphate and H2O2 are formed. H2O2 reacts with 4-chlorophenol and 4-aminoantipyrine, forming red-coloured quinoneimine (Trinder reaction) [15]. The intensity of the colour originating from quinoneimine, proportional to TG concentration in the tested material, is measured by spectrophotometry in automated analysers [16].
The total allowable error for TG concentration recommended by the American National Cholesterol Education Program (NCEP) is ±15%, while the one adopted by the Centre for Quality Assessment in Laboratory Medicine in Poland (COBJwDL) – ±10%.
4.2. Reporting of results
Alongside the TG level, a laboratory report should include information on the desirable (target) values with regard to cardiovascular risk as well as alarming values indicating severe dyslipidemia (Table I).
5. Total cholesterol
Cholesterol is one of the best-known lipids, which results from, among others, its direct connection with the development of atherosclerosis. Cholesterol in the body comes from the diet as well as biosynthesis taking place in the majority of cells, primarily in hepatocytes and enterocytes. In the blood, it is transported primarily in LDL, and only about 30% of its circulating pool is found in HDL, VLDL, and CM and VLDL remnants. Thus, determination of the TC concentration indirectly reflects an approximate plasma LDL level. From a clinical point of view, the TC level is currently used only in the cardiovascular risk stratification SCORE risk chart and to assess the severity of hypercholesterolemia if the LDL-C level has not been determined [1, 17, 18].
5.1. Methods of determination
The Abbel-Kendall method, a modification of the Liebermann-Burchard chemical method, based on cholesterol reaction with sulphuric acid, is the reference method for cholesterol determination [19, 20]. In medical diagnostic laboratory practice, the serum/plasma TC level is determined employing enzymatic methods and using automated analysers. In a typical method, after enzymatic hydrolysis of cholesterol esters by cholesterol esterase, cholesterol is oxidized by cholesterol oxidase to Δ4-cholestenone, with the formation of hydrogen peroxide (H2O2) reactive with 4-aminophenazone and 4-chlorophenol with the involvement of peroxidase, forming a red product (Trinder reaction), the concentration of which is determined by spectrophotometry [15, 21].
The total allowable error for TC determination, recommended by NCEP, is ±9% while the one used by COBJwDL – ±8%.
5.2. Reporting of results
Alongside the TC level, a laboratory report should include information on the desirable (target) values with regard to cardiovascular risk (Table II).
6. HDL cholesterol
High density lipoproteins (HDL), unlike other lipoproteins, are characterized by a low lipid and a high protein content. HDL transport about 25% of the cholesterol present in the blood, and its content in the particles of these lipoproteins is considerably variable. Therefore, plasma HDL-C level provides indirect and inaccurate information on HDL content in the blood. Nonetheless, HDL-C measurement remains a basic test for the assessment of HDL content in the blood as methods of direct measurement of the number of HDL particles (HDL-P), and their individual subfractions (measured with e.g. nuclear magnetic resonance spectrometry, ion mobility spectrometry, electrophoretic techniques) are not available in routine laboratory diagnostics and do not provide sufficient new data to be recommend. From a practical point of view, the EAS/ESC guidelines do not recommend HDL-C assessment as a treatment goal or for predicting CV risk and monitoring lipid disorders treatment; HDL-C may, however, be considered as an additional parameter for the risk stratification in the SCORE risk scale.
6.1. Methods of determination
The HDL-C level is measured in the serum or plasma. Previous methods required ultracentrifugation or more frequently precipitation in order to isolate the HDL fractions. The reference method for HDL-C determination combines ultracentrifugation and chemical precipitation to separate HDL from other lipoprotein classes containing apoB [22]. In the late 1990s, direct (homogeneous) assays for HDL-C determination were introduced into medical diagnostic laboratories, replacing precipitation methods [3]. Direct assay, without precipitation of LDL and VLDL, is possible thanks to the use of a detergent which dissolves HDL and adsorptively blocks access to cholesterol in VLDL and LDL particles to enzymes (cholesterol esterase and oxidase). New generation homogeneous methods (several types) are widely available, and ready-to-use reagents enable full automation of HDL-C measurement in the primary serum/plasma sample [3]. Direct methods are well standardized (for samples collected from healthy individuals) and ensure sufficient accuracy of measurement. Measurement bias, if occurs, is usually related to the matrix effect, e.g. in dyslipidemia. In measuring the HDL-C level, neither precipitation nor current direct methods differentiate between the HDL subclasses discussed below.
According to the NCEP recommendations, the total allowable error for HDL-C direct method measurement is ±13% for normolipidemic samples and between –20% to +36% for dyslipidemic samples. The majority of inaccurate results are seen at HDL-C levels < 40 mg/dl (< 0.8 mmol/l) [22]. In COBJwDL surveys, the allowable error is ±15%.
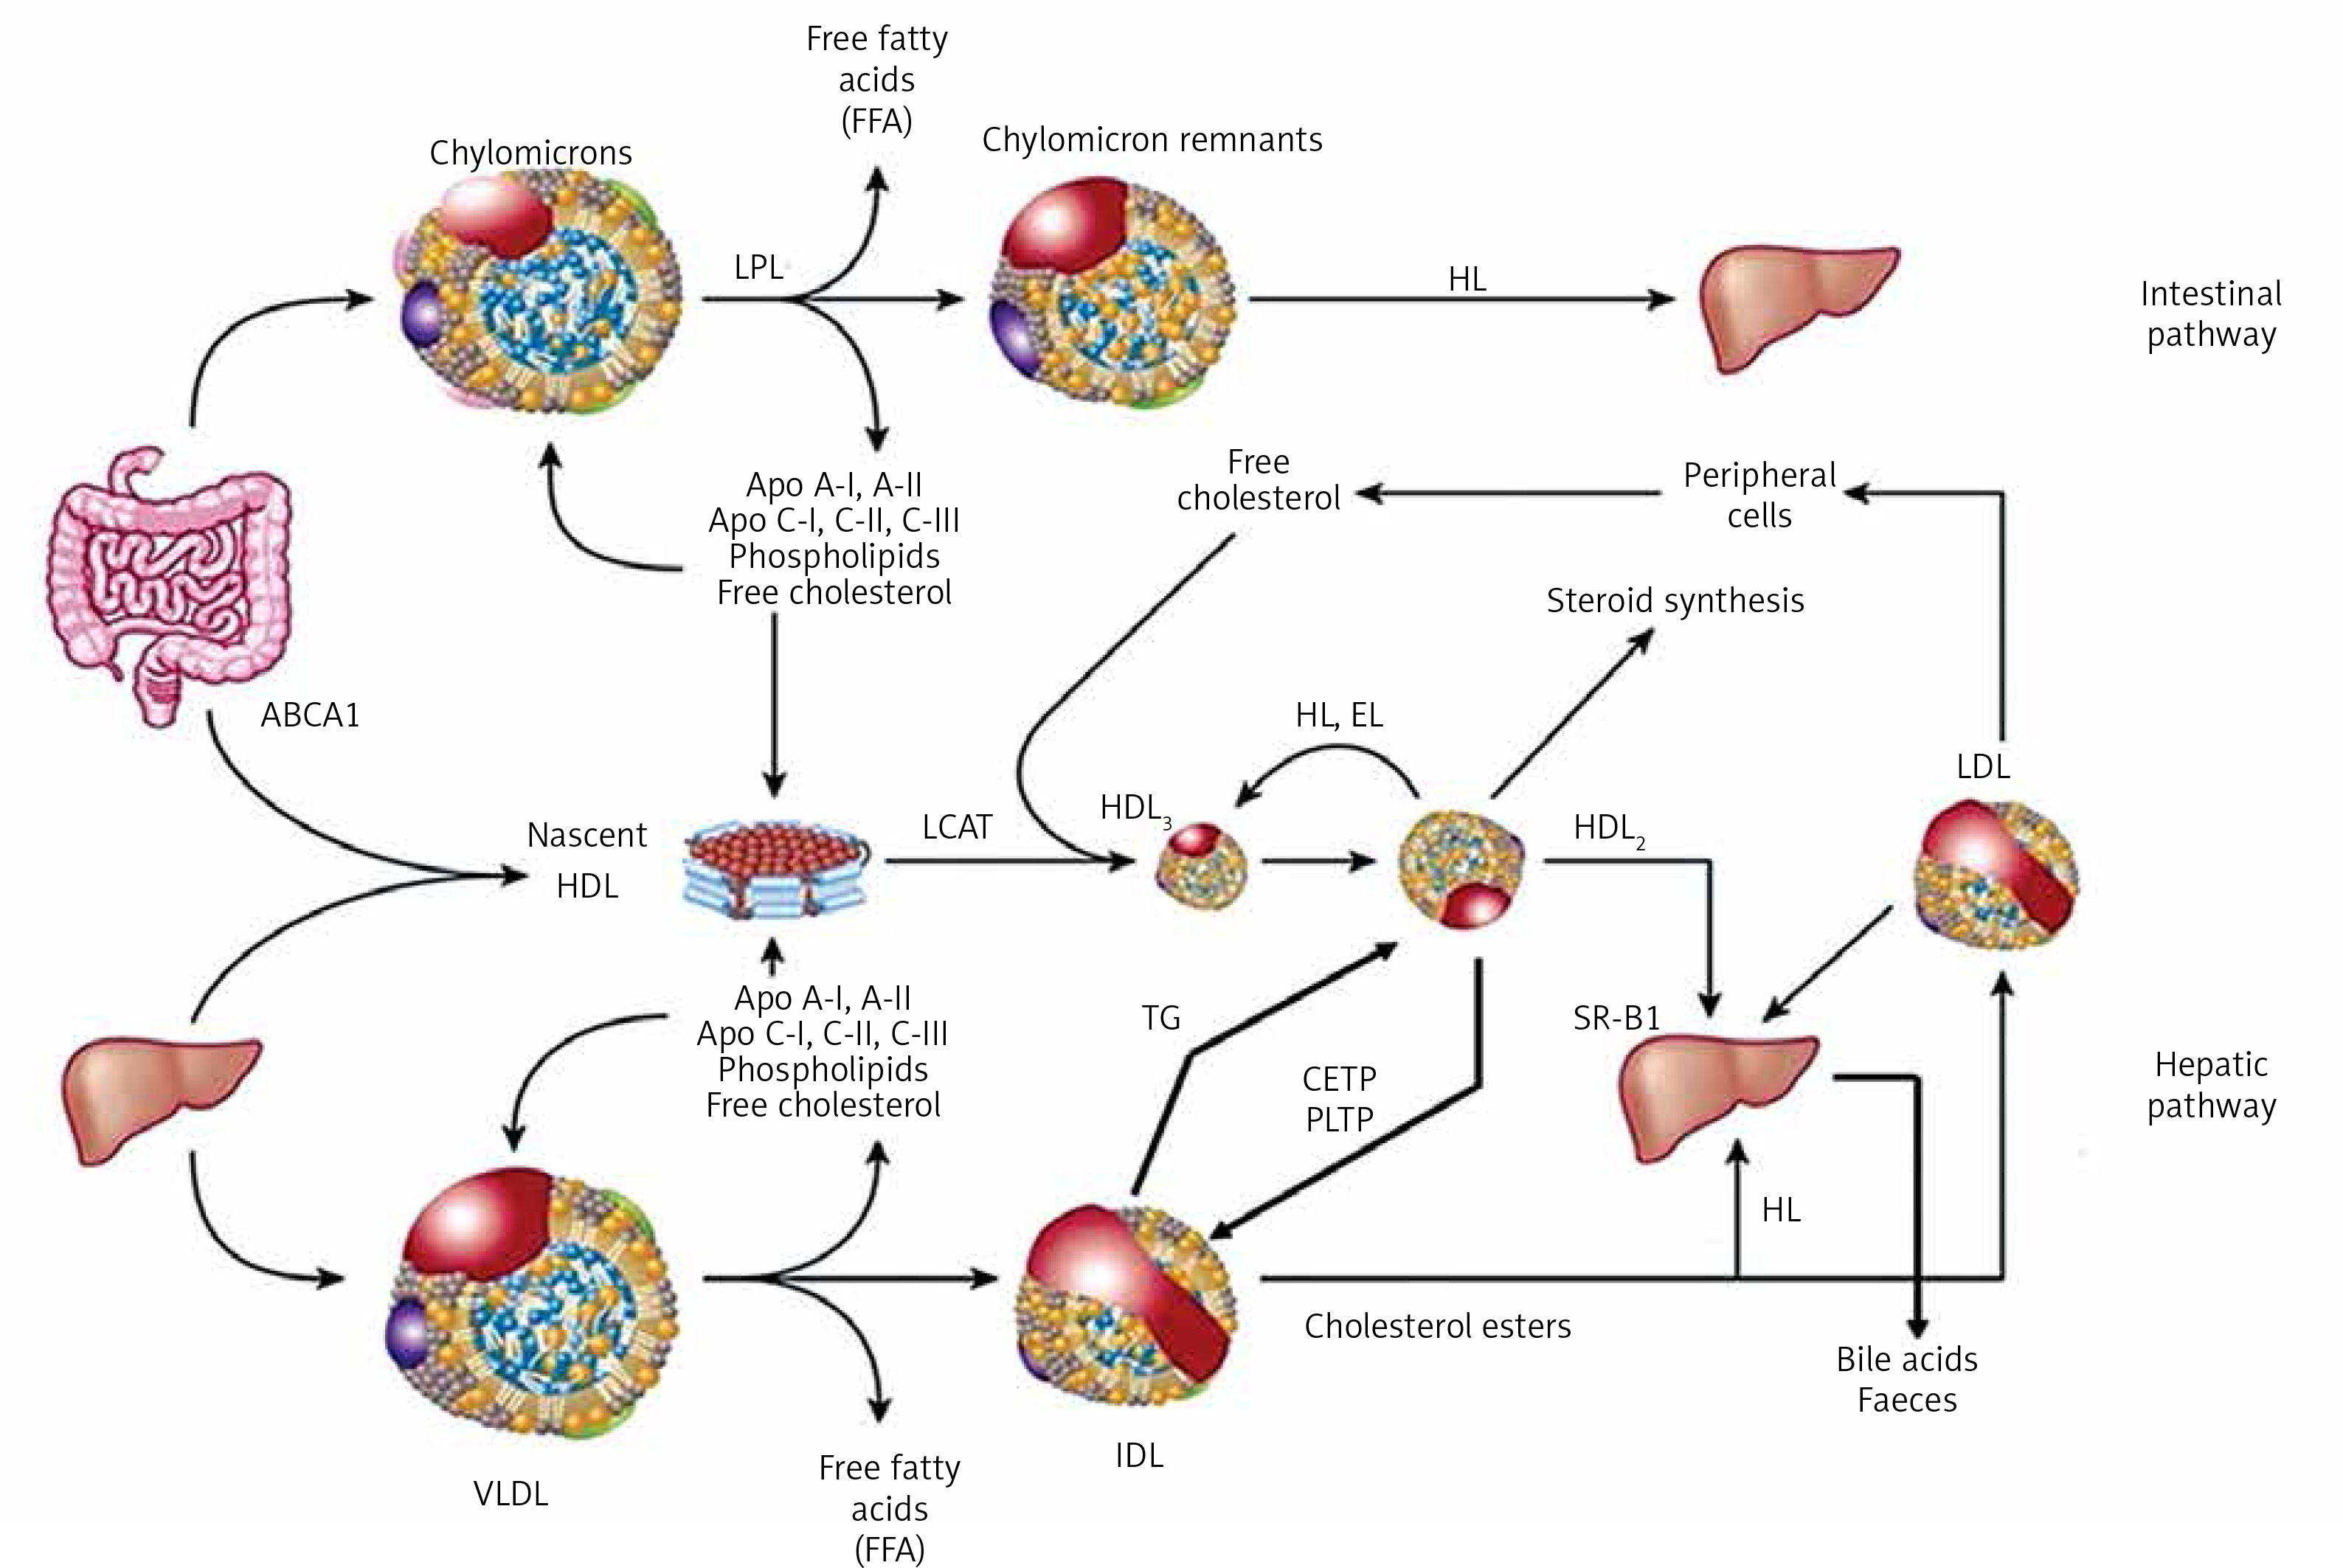
HDL comprise a heterogeneous group of small discoid and spherical particles differing in density (1.063–1.21 g/ml), size (7.6–10.6 nm) and electrophoretic mobility as well as the content of apolipoproteins and lipids [23, 24]. Apolipoprotein A-I (apoA-I) is the major protein component of the HDL particle, accounting for about 70% of the protein content and playing a significant role in HDL function and biogenesis [25]. HDL may be fractionated using different techniques, depending on their physicochemical properties and composition [26] (Figure 3).
Two fractions are obtained by sequential ultracentrifugation: HDL2 – a fraction of large light particles, high in lipids, with a density of 1.063–1.125 g/ml, and HDL3 – a fraction of small, dense, protein-rich particles, with a density of 1.125–1.21 g/ml. HDL2 and HDL3 are not uniform fractions. Using gradient polyacrylamide gel electrophoresis, they can be separated into five subfractions of decreasing size: HDL2b, HDL2a, HDL3a, HDL3b and HDL3c. Using bidirectional electrophoresis, which enables separation according to particle charge and size, more than 10 HDL subfractions were obtained. To standardize the nomenclature, HDL division into five subclasses according to their physical and chemical properties has been proposed recently [27]: 1) very large HDL, 2) large HDL, 3) medium HDL, 4) small HDL and 5) very small HDL.
The analytical methods/measurement techniques listed in Figure 3 enable direct determination of HDL particles in plasma/serum (HDL-P) as well as differentiation of their subfractions, which allows a certain functional characteristic [26, 28]. Due to differences in the results for individual HDL subfractions with regard to their predictive properties (more studies indicate that small dense HDL are a proatherogenic fraction), they are assessed mainly for research purposes [29–31].
6.2. Reporting of results
Alongside the HDL-C level, a laboratory report should include information on the desirable (target) values with regard to cardiovascular risk (Table III).
7. Dysfunctional HDL
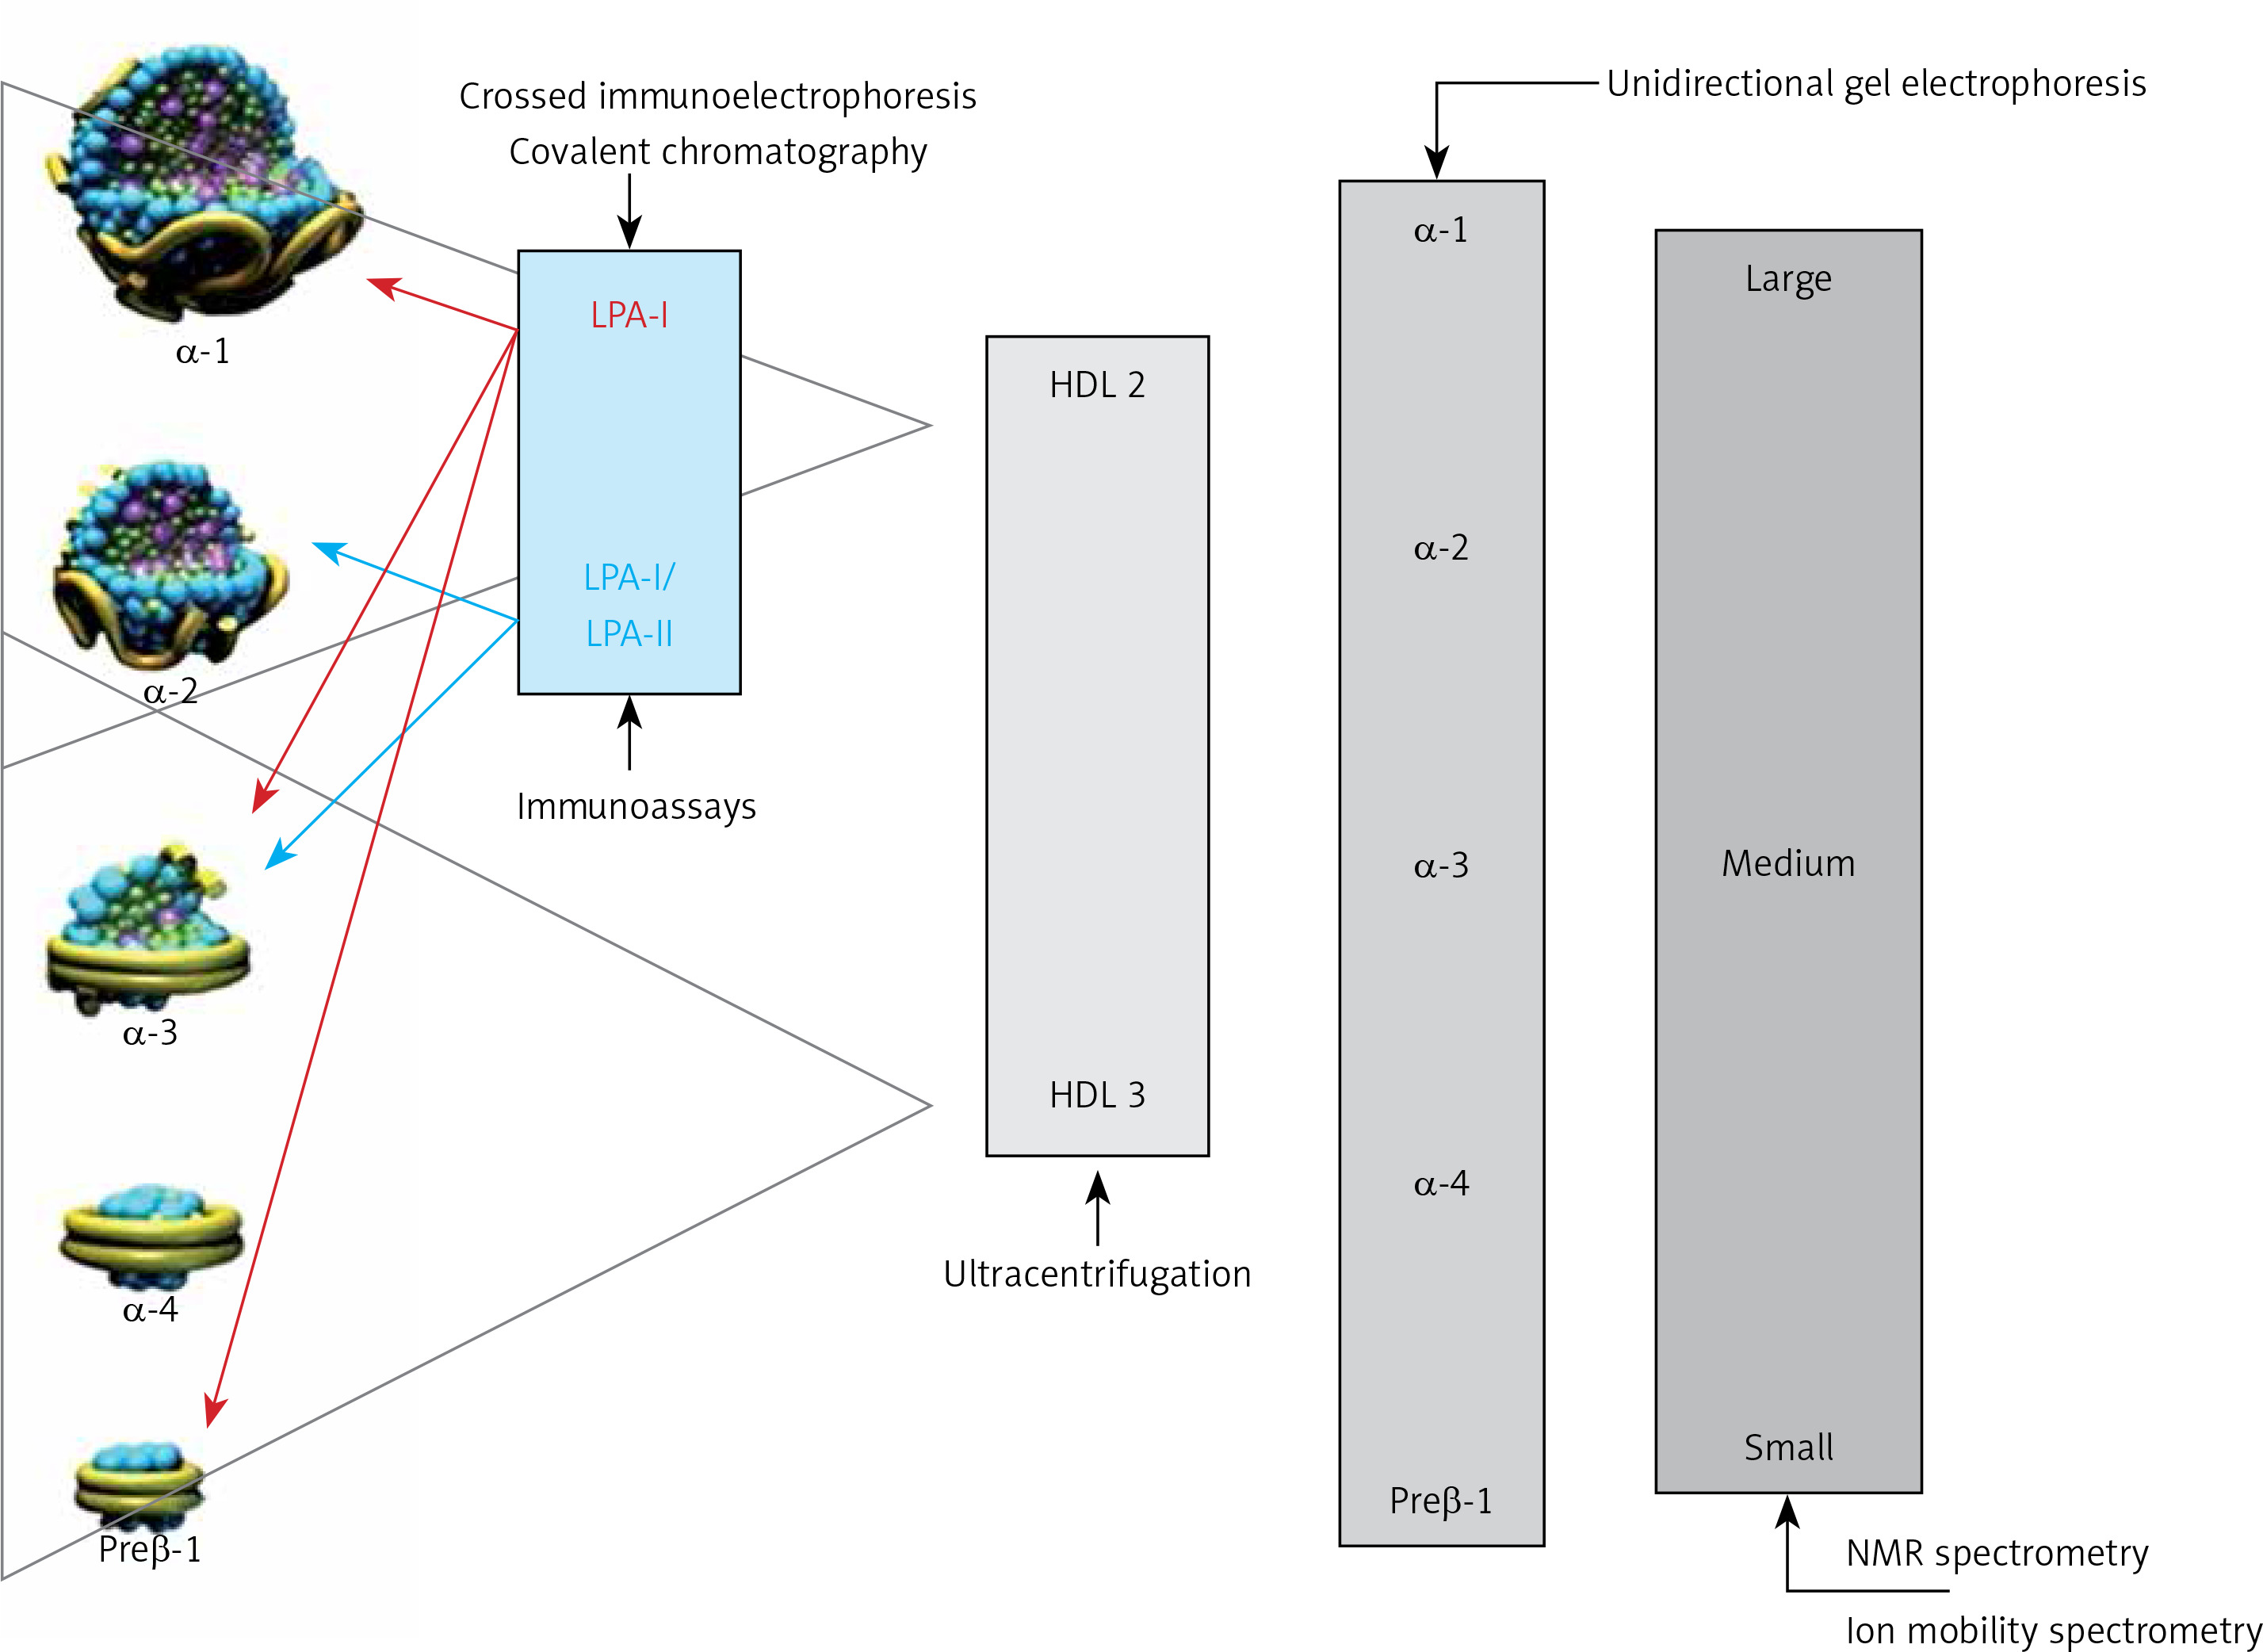
The anti-atherosclerotic effect of HDL is related primarily to its involvement in reverse cholesterol transport as well as anti-inflammatory, antioxidant, antiapoptotic, anticoagulant, cytoprotective and vasodilator activity. Altered HDL properties, in particular the development of dysfunctional HDL particles, constitute a factor for an increased cardiovascular risk [32–35]. The formation of dysfunctional HDL is caused primarily by inflammation, as well as oxidative stress and glycation. Increased expression of myeloperoxidases (MPO, E.C. 1.11.1.7) plays an important role here [36]. MPO catalyses apoA-I modifications and, as a result, inhibits ABCA1-dependent reverse cholesterol transport, contributing to the formation of foam cells and the development of fatty infiltration of a blood vessel (Figure 4 A). Inflammation also induces HDL transformation consisting in the:
Figure 4
Dysfunctional HDL particles: A – HDL modified by myeloperoxidase, B – inflammatory HDL
SAA – serum amyloid A, PON-1 – paraoxonase-1, GPx – glutathione peroxidase, RCT – reverse cholesterol transport, ABCA1 – ATP-binding membrane cassette transporter A1.
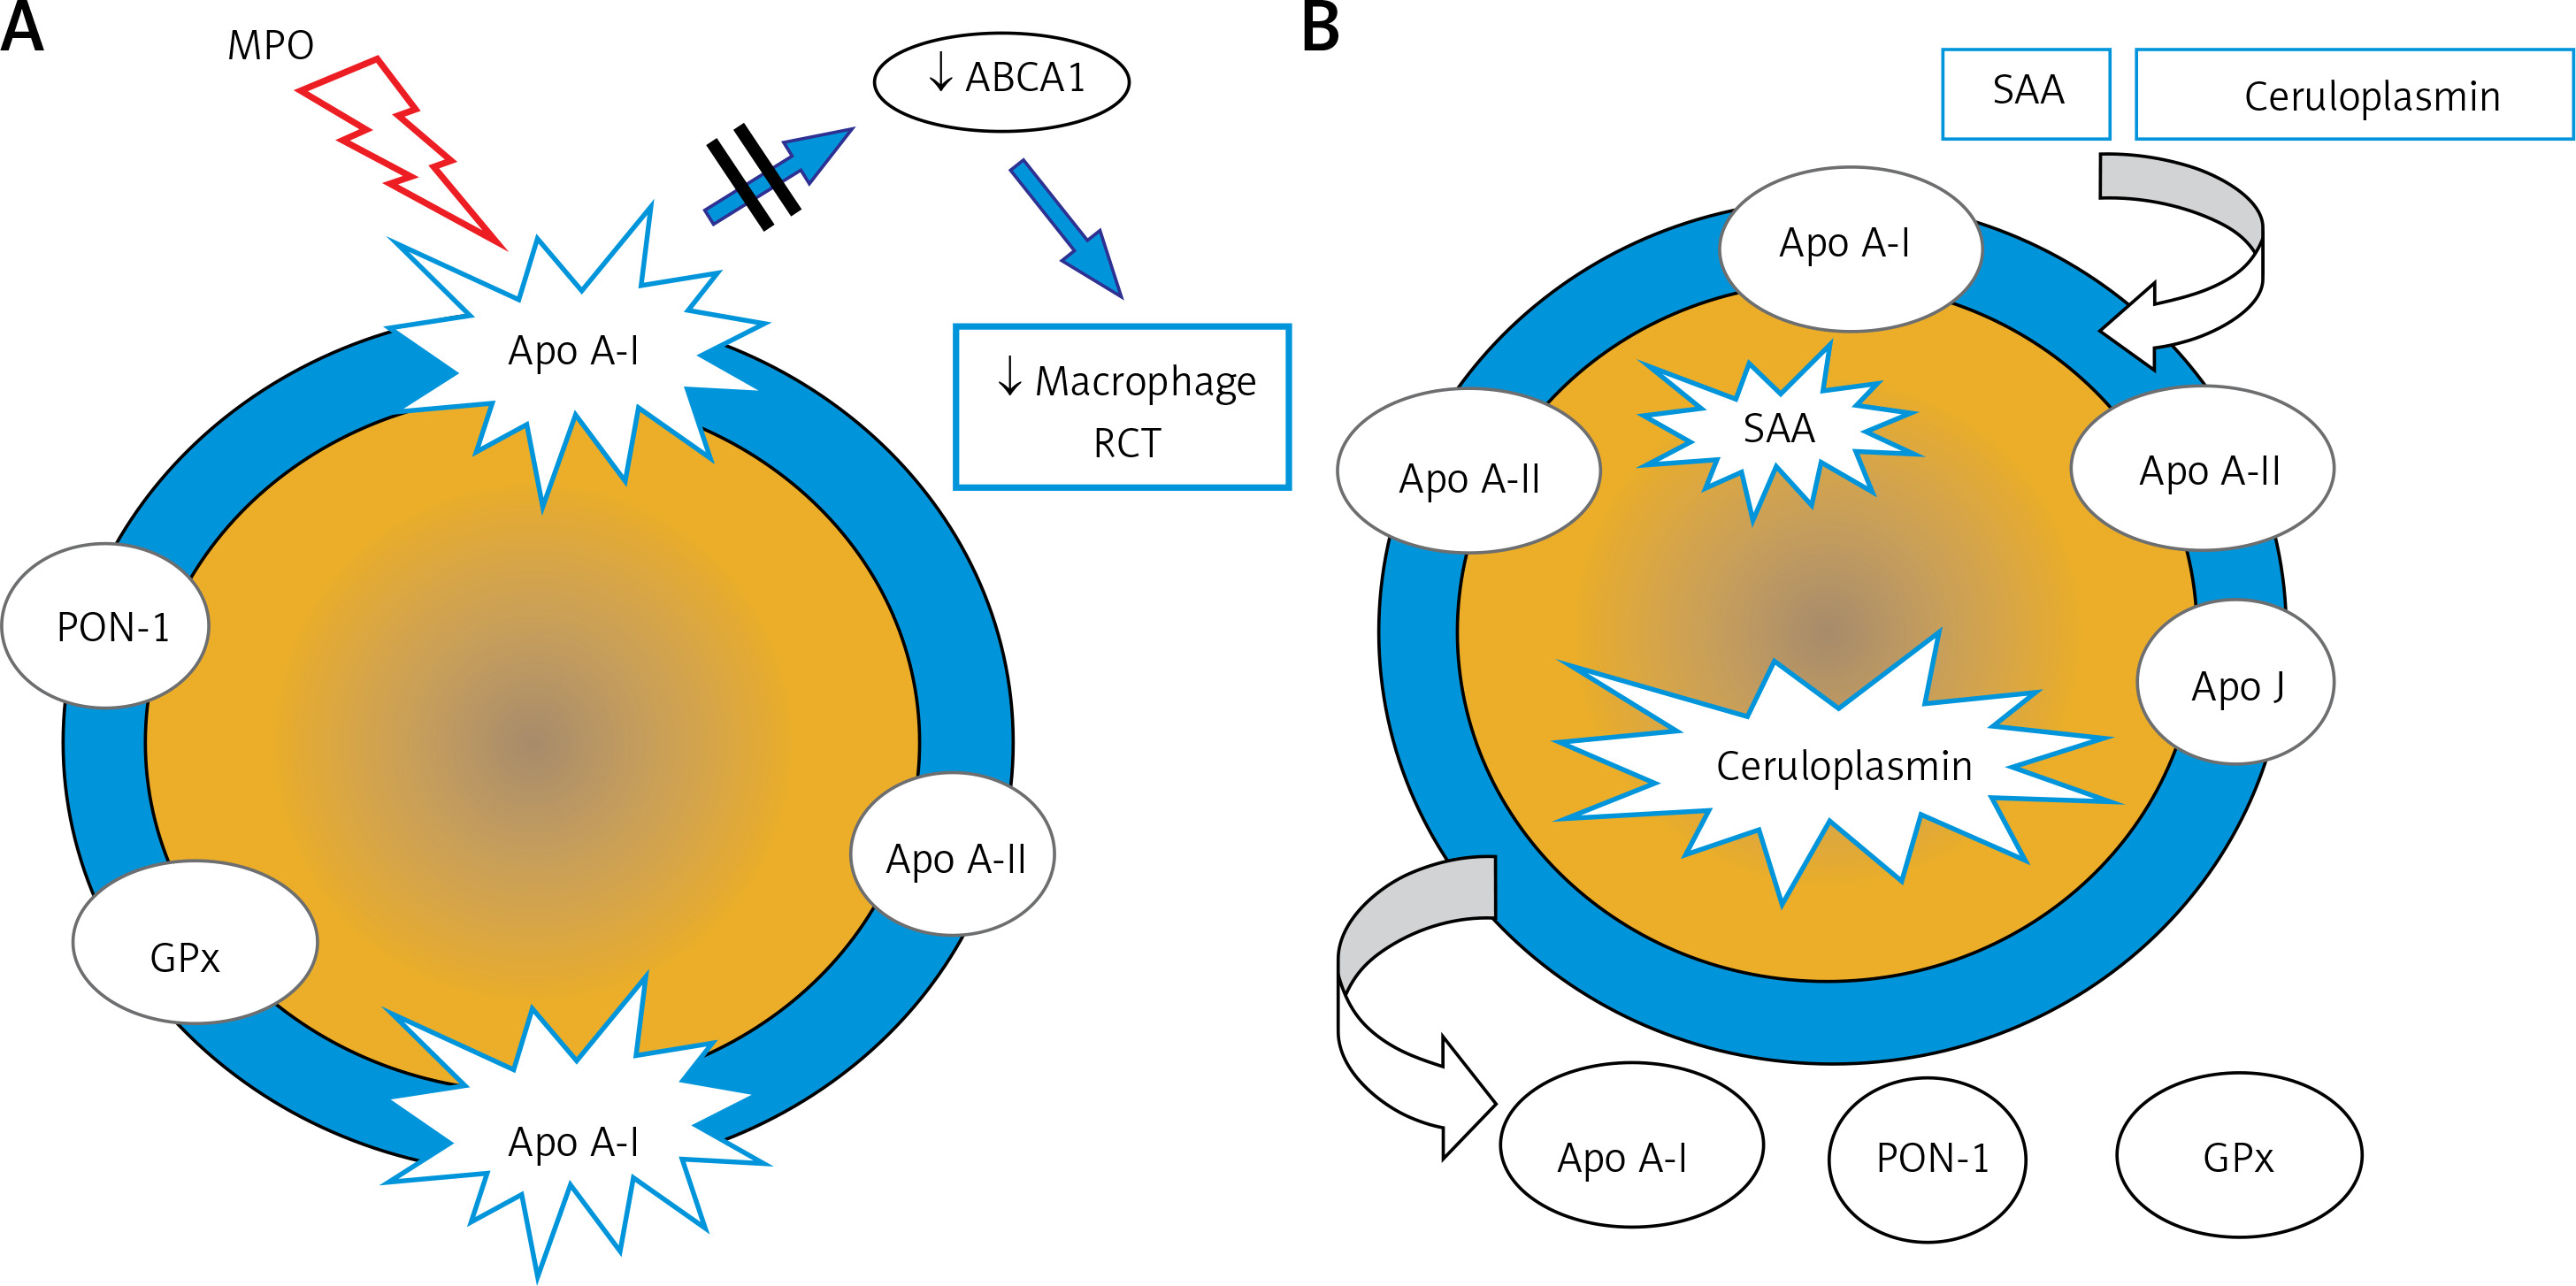
Deficiency/absence of paraoxonase (PON-1) and glutathione peroxidase (GPX), which inhibit LDL oxidation,
Change in the apoA-I/apoA-II ratio,
Presence of acute phase proteins: serum amyloid A (SAA) and ceruloplasmin (Figure 4 B).
PON-1 (aryldialkylphosphatase, E.C. 3.1.8.1) plays a special role in reducing CV risk. It is an enzyme responsible for the hydrolysis of toxic organophosphorus compounds, phospholipid peroxides and cholesterol ester hydroxides [37]. The role of PON-1 is to protect the LDL fraction from oxidative modification, preventing the formation of atherogenic oxidized LDL particles (oxLDL) [38, 39].
HDL-C level does not provide information on HDL functionality. To date, no methods for routine direct determination of dysfunctional HDL have been developed. Knowing the mechanisms underlying their formation, one might attempt prediction of this process in inflammation diagnosed and monitored using standard markers (C-reactive protein (CRP), interleukin-6 (IL-6)) as well as MPO and PON-1 directly related to dysfunctionality of these lipoproteins. From a practical point of view, in the absence of a gold standard for (reproducible, simple and cheap) assessment of HDL functionality, determination of dysfunctional HDL has no clinical significance. Nonetheless, knowledge of this topic is crucial since even in primary prevention in obese patients and smokers or in secondary prevention and/or chronic kidney disease, most HDL particles might be dysfunctional and might have atherogenic properties similar to those of LDL particles.
8. LDL cholesterol
Low-density lipoproteins (LDL) transport about 70% of the cholesterol present in the blood. Cholesterol and its esters account for 40–50% of the LDL particle mass. Due to the key predictive role of LDL in atherogenesis, the LDL-C level, which indirectly reflects the LDL content in the blood, is a primary lipid factor of cardiovascular risk, and its specific values constitute a goal for lipid-lowering therapy. As blood samples for lipid profile do not need to be collected in a fasting state, the testing is more available and the calculation/determination of the LDL-C level is easier [2, 3, 6, 8].
8.1. Methods of determination/calculation
Beta quantification based on preparative ultracentrifugation of the material (serum, plasma), separating lipoproteins into two fractions according to their density: CM and VLDL (rejected), and LDL, HDL, IDL and Lp(a), is the reference method for determining the LDL-C level. The LDL-C and Lp(a) cholesterol levels are determined in this fraction. In everyday practice, the LDL-C level is usually calculated, less frequently determined by direct (homogeneous) methods.
The Friedewald formula, using determined TC, HDL-C and TG levels and the adopted TG-to-VLDL-C ratio, is widely used to calculate the L DL-C level [40]: LDL-C = TC – HDL-C – TG/5 (mg/dl) or LDL-C = TC – HDL-C – TG/2.2 (mmol/l).
This formula should not be used if the TG level is high (> 4.5 mmol/l, 400 mg/dl) – the TG-VLDL-C ratio is different than the one adopted in the formula. Calculation of the LDL-C level using the Friedewald formula may also be confounded by the presence of IDL and in states associated with altered composition of lipoprotein particles (obesity, type 2 diabetes, metabolic syndrome, kidney diseases, liver diseases). The Friedewald formula, even if the pre-analytical requirements are met, tends to underestimate the LDL-C levels at low LDL-C levels (< 1.8 mmol/l, 70 mg/dl) and TG levels (> 1.7 mmol/l, 150 mg/dl) [41]. In addition, the LDL-C calculated is confounded by the sum of errors in determination, the results of which are used in the formula.
The Martin-Hopkins equation is one of several (most recent) modifications of the Friedewald formula proposed (2013) [40]: LDL-C = TC – HDL-C – TG/x (mg/dl), where x – TG-to-VLDL-C ratio based on TG and non-HDL-C levels; values are available in special tables or online calculators, available e.g. www.ldlcalculator.com. The formula has been shown to be more accurate than the Friedewald formula in determining the LDL-C level if it is low and if the TG level amounts to 2.0–4.5 mmol/l (175–400 mg/dl) [41–43].
The LDL-C level can be determined using direct (homogeneous) methods. The current third-generation methods involve the use of reagents containing different detergents, surfactants, carbohydrate derivatives and other factors that block or dissolve individual lipoprotein fractions, which selectively make LDL-C available for cholesterol oxidase and esterase. These methods allow the use of automated analysers. Due to considerable methodological variability, direct methods of LDL-C determination differ in accuracy (traceability to the reference method) and precision of assays [43]. The total allowable error for the determination/calculation of the LDL-C level recommended by NCEP is ±12%.
Recommendations
The LDL-C level can be calculated using the Friedewald or Martin-Hopkins formula at TG ≤ 4.5 mmol/l (400 mg/dl); calculations using the Martin-Hopkins equation are more accurate at low LDL-C levels and the TG level > 2.0 mmol/l (175 mg/dl) and should be recommended.
In individuals with the TG level > 4.5 mmol/l (400 mg/dl), obesity, diabetes mellitus, metabolic syndrome and low TC and LDL-C level, calculation of non-HDL-C or apoB measurement rather than LDL-C is recommended.
8.2. Reporting of results
Alongside the calculated/determined LDL-C level, a laboratory report should include information on the formula used or the use of a direct determination method as well as the desirable (target) values with regard to cardiovascular risk (Table IV) and alarming values indicating severe dyslipidemia (Table V).
Table IV
Updated cardiovascular risk categories based on the 2019 ESC/EAS guidelines. The level of risk is defined by the presence of at least one of the factors listed in individual categories
| Extreme | Status post-acute coronary syndrome (ACS) and a history of another vascular event in last 2 years; status post-ACS and the presence of peripheral artery disease or polyvascular vascular disease1; status post-ACS and coexistent multivessel coronary artery disease or status post-ACS and familial hypercholesterolaemia (FH) – despite optimal treatment with maximum tolerated statin doses2 |
| Very high | Cardiovascular disease documented clinically or by imaging examinations; diabetes mellitus with organ damage3 or at least 3 risk factors4, early-onset type 1 diabetes lasting for > 20 years; chronic kidney disease with eGFR < 30 ml/min/1.73 m2; FH with CVD or another major risk factor4; risk ≥ 10% in Pol-SCORE |
| High | Significantly intense single risk factor, especially TC > 8 mmol/l (> 310 mg/dl), LDL-C > 5.0 mmol/l (> 190 mg/dl) or blood pressure ≥ 180/110 mm Hg; FH without other risk factors; diabetes lasting for ≥ 10 years without organ damage or another additional risk factor4; chronic kidney disease with eGFR 30–59 ml/min/1.73 m2; risk of ≥ 5% and < 10% in Pol-SCORE |
| Moderate | Type 1 diabetes in patients < 35 years of age; type 2 diabetes in patients < 50 years of age lasting < 10 years, with no other risk factors; risk of < 5% as per Pol-SCORE |
| Low | Risk of < 1% as per Pol-SCORE |
Table V
| Cardiovascular risk | Desirable levels fasting and non-fasting | |
|---|---|---|
| LDL-C level [mg/dl] | LDL-C level [mmol/l] | |
| Extreme | < 40 | < 1.0 |
| Very high | Reduction by ≥ 50% and < 55 | Reduction by ≥ 50% and < 1.4 |
| High | Reduction by ≥ 50% and < 70 | Reduction by ≥ 50% and < 1.8 |
| Moderate | < 100 | < 2.6 |
| Low | < 115 | < 3.0 |
| Alarming levels | ||
| Homozygous familial hypercholesterolaemia with an extremely high cardiovascular risk: | ||
| In untreated individuals | > 500 | > 13.0 |
| In treated individuals | > 300 | > 8.0 |
| Heterozygous familial hypercholesterolaemia with a high cardiovascular risk in untreated individuals* | > 190 | > 5.0 |
9. Non-HDL cholesterol
Non-HDL cholesterol (non-HDL-C) is an integrated indicator of the level of all lipoproteins, which are known to be associated with the initiation and progression of atherosclerosis. These are apoB-containing particles: LDL, VLDL, IDL, CM, CM remnants, VLDL remnants and Lp(a). Non-HDL-C determination is very important for CV risk assessment. It should be a permanent element of the lipid profile as it represents the concentration of all atherogenic lipoprotein fractions. The available studies show that it is more predictive in CV risk assessment than LDL-C [44, 45].
The non-HDL-C level is calculated using the following formula: non-HDL-C = TC – HDL-C.
Non-HDL-C calculation is more reliable than the calculation of LDL-C [45, 46]. As with other formulas, the accuracy of non-HDL-C calculation depends on the biological and analytical variability of the TC and HDL-C levels. However, the biological variability of HDL-C is much lower than that of other lipid parameters, especially TG. In addition, HDL-C levels are much lower than the TC levels, which minimises their effect on changes in the calculated non-HDL-C level.
9.1. Reporting of results
Alongside the calculated non-HDL-C level, a laboratory report should include information on the desirable (target) values with regard to cardiovascular risk (Table VI).
Table VI
| Cardiovascular risk | Desirable levels fasting and non-fasting* | |
|---|---|---|
| Non-HDL-C level [mg/dl] | Non-HDL-C level [mmol/l] | |
| Extreme | < 70 | < 1.8 |
| Very high | < 85 | < 2.2 |
| High | < 100 | < 2.6 |
| Moderate | < 130 | < 3.4 |
* According to EAS/EFLM (2016), the difference in the cut-off value for moderate cardiovascular risk in the fasting and non-fasting state is minimal, i.e. 3.8 mmol/l (145 mg/dl) vs. 3.9 mmol/l (150 mg/dl) [6], and therefore may be omitted; Unit conversion: [mg/dl] × 0.026 = [mmol/l].
Recommendations
Non-HDL-C is an indicator of cardiovascular risk recommended especially in individuals with the TG level > 4.5 mmol/l (400 mg/dl), obesity, diabetes mellitus, metabolic syndrome and low TC and/ LDL-C level.
The calculated non-HDL-C level should be routinely provided in every lipid profile laboratory report.
10. Apolipoprotein B
Apolipoprotein B (apoB), which is a structural component of all lipoproteins except for HDL, occurs as two isoforms: apoB 100 (MM 550 kD), synthesized in hepatocytes, present in VLDL, IDL and LDL, and its fragment, apoB 48 (MM 265 kD), synthesized in enterocytes, present in CM and their remnants [6, 47].
10.1. Methods of determination
Serum/plasma apoB is determined by immunoturbidimetry and immunonephelometry. The antibodies used in these methods are directed against apoB 100 while some of the methods involve also determination of apoB 48. In fasting blood samples apoB 100 accounts for > 90% of apoB. Due to a very short half-life of VLDL, it is assumed that at the TG level < 2.3 mmol/l (200 mg/dl) almost all apoB molecules determined are the LDL components. Since one apoB 100 molecule is found in every LDL particle, the apoB level determined is a measure of the serum/plasma LDL level.
Immunochemical apoB assays are standardised using secondary IFCC/WHO SP3-08 reference material as well as primary reference material – LDL fraction obtained by ultracentrifugation. The total allowable error for determination of the apoB level recommended by NCEP is ±6%.
10.2. Reporting of results
Alongside the apoB level, a laboratory report should include information on the desirable (target) values with regard to cardiovascular risk (Table VII).
Table VII
| Cardiovascular risk | Desirable levels fasting and non-fasting | |
|---|---|---|
| apoB level [mg/dl] | apoB level [g/l] | |
| Extreme | < 55 | < 0.55 |
| Very high | < 65 | < 0.65 |
| High | < 80 | < 0.8 |
| Moderate | < 100 | < 1.0 |
Recommendations
Determination of the apoB level may be an alternative to LDL-C measurement, if available, especially in individuals with the TG level > 4.5 mmol/l (400 mg/dl), obesity, diabetes mellitus, metabolic syndrome and low TC and/ LDL-C level.
Calculated ratios (indices) of lipid profile results such as TC/HDL-C, LDL-C/HDL-C and apoB/apoA-I are not clinically significant for cardiovascular risk assessment.
11. Lipoprotein (a)
Lipoprotein (a) (Lp[a]) particles are a subpopulation of LDL of a similar structure, containing one apolipoprotein B 100 molecule with which apolipoprotein (a) [apo(a)] is bound covalently by a disulphide bridge. The apo(a) molecule is characterized by marked amino acid sequence homology with plasminogen; it contains the protease domain and the so-called Kringle IV and V domains. The molecular mass of Lp(a) shows high interindividual variability, dependent on the number of repeats of the Kringle IV type 2 (KIV-2) domain, which may range from 3 to 40 and is genetically determined by the number of tandem repeats of the genome sequence in the LPA gene. This genetically determined size of the Lp(a) particle is inversely proportional to the rate of its synthesis mainly in the liver and the serum/plasma concentration – particles of a lower mass (lower number of KIV-2 repeats) are present in a higher concentration while particles of a higher mass (high number of KIV-2 repeats) – in a lower concentration [6, 48].
In Poland, lipoprotein(a) levels are still very rarely determined and the knowledge on this subject is very limited. Therefore, every effort should be made to change it as soon as possible. This is related to enormous advances in this field of science. Today, we know that it is an independent risk factor for cardiovascular diseases and that up to 20–30% of patients with familial hypercholesterolaemia and/or acute coronary syndrome may have an elevated Lp(a) level of over 50 mg/dl, with frequently targeted LDL-C levels, and that the Lp(a) level may be reduced pharmacologically [49–51].
11.1. Methods of determination
The Lp(a) level is determined in plasma/serum using mainly immunoassays, e.g. immunoturbidimetry, immunonephelometry and various immunoenzymatic methods, including ELISA. The standardisation of immunochemical methods for Lp(a) determination is based on traceability of calibrators to the original IFCC/WHO reference material. The results obtained using different methods are still insufficiently harmonised, which is thought to result from the effect of the apo(a) molecule size variability on Lp(a) immunoassays, which may lead to overestimation in the case of large isoforms and underestimation in the case of small isoforms [52–55].
11.2. Reporting of results
Alongside the Lp(a) level, a laboratory report should include information on the desirable (target) values with regard to cardiovascular risk as well as alarming values indicating severe dyslipidemia (Table VIII).
Table VIII
LDL cholesterol is measured or calculated jointly with the Lp(a) cholesterol. Lp(a), especially at high concentrations, may result in overestimation of the LDL-C level. The LDL-C level calculated using the Friedewald formula can be adjusted to the Lp(a) level using Dahlen’s modification of the formula, based on the assumption that cholesterol accounts for 30% of the Lp(a) particle mass [6, 55]: LDL-Cadj = TC – HDL-C – TG/5 – [Lp(a) × 0.3] (all concentrations in mg/dl).
The same adjustment may be made if the LDL-C level is calculated using other formulas or is determined using direct methods.
Recommendations
It should be an aim that every adult has his/her Lp(a) level determined at least once in a lifetime so that the highest risk patients with the Lp(a) level > 180 mg/dl are identified.
Even the Lp(a) level of > 30 mg/dl significantly increases the risk of cardiovascular events. Therefore, Lp(a) measurement should be considered in all patients with premature cardiovascular disease, non-responders to statin therapy and individuals with a border intermediate/high risk, to ensure better risk stratification.
In the case of patients with the Lp(a) level determined as part of an extended lipid profile, the LDL-C level should be adjusted using the Dahlen’s modification.
12. CM and VLDL remnant cholesterol
TG-rich CM and VLDL remnant cholesterol, formed from these lipoproteins under the influence of endothelial and hepatic lipoprotein lipase and CETP, have an LDL-independent atherogenic effect. Particles of remnants, which are much smaller than their precursors, enter the internal membrane of arteries, are absorbed by macrophages and induce foam cell formation; during their formation, reactive oxygen species are released, damaging the endothelium and initiating inflammation [6, 56]. Although scientific evidence clearly indicates that assessment of the remnants levels may help to reduce residual cardiovascular risk [57], determination of remnants still plays a minor role in everyday clinical practice. However, determination of their blood levels may be considered a part of overall assessment of the patient’s cardiovascular risk.
12.1. Methods of determination
CM remnants and VLDL remnants are measured in non-fasting plasma or serum samples. Immunochemical methods for determination of complete particles of remnants have not found their use in practice. Recently, a homogeneous method for determination of the levels of CM and VLDL remnant cholesterol (Remn-C) has been developed, which allows the use of automated analysers. The Remn-C level can easily be calculated using the following formula: Remn-C = TC – HDL-C – LDL-C.
The LDL-C level used in the formula must be determined using a direct method, in a non-fasting sample. The Remn-C level calculated shows a high consistency with the level determined using a direct method [6].
12.2. Reporting of results
Alongside the calculated Remn-C level, a laboratory report should include information on the desirable (target) values with regard to cardiovascular risk. In the Community General Population Study, median (interquartile range) Remn-C level in the study population was 0.6 (0.4–0.9) mmol/l (23 [15–35] mg/dl) [58]. According to various clinical and epidemiological studies, the desirable Remn-C level should be < 0.9 mmol/l (< 35 mg/dl) [6].
Recommendations
If the LDL-C level in the lipid profile was determined in a non-fasting state using a direct method, the Remn-C level may be additionally calculated. However, as the LDL-C measurement is required and no recommended target Remn-C levels are available, its use in clinical practice is still limited.
13. Lipid profile – laboratory report
Lipid profile includes a battery of blood serum or plasma tests and calculations aimed at identification of dyslipidemia as a cardiovascular risk factor as well as treatment monitoring: total cholesterol (TC) level, HDL cholesterol (HDL-C) level, LDL cholesterol (LDL-C) level, non-HDL cholesterol (non-HDL-C) level, triglycerides (TG) level.
Lipid profile may be supplemented with the following parameters, determined as per indications: apolipoprotein B (apoB) level, lipoprotein (a) [Lp(a)] level, CM and VLDL remnants cholesterol (Remn-C).
The following have an experimental (mainly research) use: myeloperoxidase (MPO) level/activity, paraoxonase (PON-1) level/activity.
In addition to the results of measurements and calculations, a lipid profile laboratory report (Table IX) should include information on how the LDL-C level was defined (determined) as well as targeted (desirable) concentrations of the analytes determined. If severe dyslipidemia is suspected, it should also include information on the need to seek urgent medical attention if the LDL-C level indicates a possible diagnosis of heterozygous (> 190 mg/dl/> 5.0 mmol/l) or homozygous (> 500 mg/dl/> 13.0 mmol/l) familial hypercholesterolaemia (FH), if the Lp(a) level >180 mg/dl (450 nmol/l) indicates a very high risk of acute CV events, or the TG level > 880 mg/l (10.0 mmol/l) indicates a high risk of acute pancreatitis and in case of some typical symptoms (early onset of symptoms, unexplained recurrent abdominal pain, history of pancreatitis), the possible risk of familial chylomicronemia syndrome (FCS). Information provided on a lipid profile order form on whether a patient is overweight/obese and/or suffers from diabetes and whether he/she is receiving a lipid-lowering therapy is helpful in laboratory interpretation and authorisation of obtained results.
Table IX
Lipid profile – information in a laboratory report