Introduction
Sarcoidosis is a multisystem disorder of unknown aetiology characterised by infiltration of numerous organs by noncaseating granulomas. The organs that are most affected by this disease are lungs, lymph nodes, skin, and eyes. The Case-Control Aetiologic Study of Sarcoidosis (ACCESS) study showed that its prevalence may change among different populations. The clinical presentation, frequency, and severity level of the disease can also vary among different races and study populations [1–3]. The highest annual incidence of sarcoidosis has been observed in northern European countries (5 to 40 cases per 100,000 people) [4]. Extrapulmonary involvement of sarcoidosis is known to be affected by genetic factors, and its rate in Turkey is 2.2% [5].
Approximately 5% of patients with sarcoidosis will have clinically manifest cardiac involvement and another 20–25% have asymptomatic cardiac involvement (clinically silent disease) [6, 7], and in 20–30% of cases in pathology series [7–10]. Myocardial infiltration, which results in cardiac sarcoidosis, is responsible for 50% of deaths of patients with sarcoidosis [8, 9]. It is a common and serious kind of infiltration when there are clinical and/or electrical signs of disease [7, 10]. Cardiac infiltration is frequently characterised by intraventricular septum and/or the left ventricle [7, 10]. The existence of large numbers of lymphocytes at the border zones around granulomas can be observed in pathologic samples of myocardium involved with sarcoidosis. Clinical proof of myocardial involvement during the whole life is seen in only 40–50% of patients with cardiac sarcoidosis at necropsy [11]. Sarcoid granulomas may serve as foci for abnormal automaticity or to disperse both ventricular activation and recovery processes that can cause reentrant tachycardia. The reentrant pathway could be related to the healing of cardiac granulomas in the inactive phase of the disease, or it could be the result of active granulomatous inflammation. Electrocardiography (ECG) is often nondiagnostic or nonspecific even though it is an important part of patient evaluation. The American Thoracic Society (ATS) recommended initial cardiac evaluation of patients with sarcoidosis is ECG, and as such, the only information about cardiac involvement in sarcoidosis is viewed in the Tp–Te interval in ECG screening [1].
According to recent studies, the interval between the peak and the end of T wave on electrocardiogram (ECG), i.e. Tp–Te interval, may stand for the index of total (transmural, apicobasal, and global) dispersion of repolarisation [12, 13]. Furthermore, increased Tp–Te interval could be a practical index to estimate cardiovascular mortality and ventricular tachyarrhythmias [14, 15].
The aim of this study was to evaluate repolarisation dispersion obtained from 12-lead surface electrocardiograms (including Tp–Te interval) in patients with pulmonary sarcoidosis without proven cardiac involvement. Increased Tp–Te interval could be regarded as a beneficial parameter to estimate ventricular tachyarrhythmia and cardiovascular mortality [16]. Our hypothesis was that Tp–Te intervals ascend in patients with sarcoidosis, which may cause arrhythmic events; therefore, early screening would be useful for preventing patients from developing cardiac complications due to sarcoidosis.
Material and methods
This was a retrospective case-control study comprising patients who had a pathologic and radiologic diagnosis of sarcoidosis. All data of the patients’ demographic features and laboratory findings were recorded. We retrospectively analysed ECGs that were taken in the assessment after the patients’ sarcoidosis was diagnosed. Healthy volunteers were enrolled as a control group.
Study population
Our research included 78 patients with sarcoidosis and 54 healthy controls. In our study, it was important to determine whether there was a history of tuberculosis, and reactivity was investigated carefully. All patients were in our clinic for follow-up between 2012 and 2014. After eliminating other causes of granulomas like tuberculosis and tularaemia, sarcoidosis was determined if patients had compatible clinical and radiologic findings with histologically proven non-caseating granulomas. A bronchoscopic needle aspiration biopsy of the lymph node, mediastinoscopic lymph node excision, and skin biopsies were used for pathologic diagnosis.
Patients were evaluated using chest radiographs and we enrolled those with extrapulmonary involvements. Chest radiographs were classified using the Scadding scale: 0 – normal chest radiographic findings, I – bilateral hilar adenopathy with normal lung parenchyma, II – bilateral hilar adenopathy with pulmonary infiltrates, III – pulmonary infiltrates without hilar adenopathy, and IV – pulmonary fibrosis/fibrocystic parenchymal changes [4, 17].
We retrospectively evaluated patients’ documents and obtained data including blood count and biochemistry tests, which gave information about fasting glucose, urea, creatinine, and cholesterol levels at the time of admission to hospital. The patients were further reviewed, and for a diagnosis of sarcoidosis there had to be no evidence of cardiac sarcoidosis.
Patients were excluded from the study if they had the following: coronary artery disease; chronic renal failure; chronic liver disorders; moderate or severe valvular heart disease; prior pacemaker implantation; congenital heart disease; left ventricular systolic dysfunction on GE Vivid 7 echocardiography (EF < 50%); recent acute coronary syndrome; anaemia; secondary hypertension; haematological disorders; known malignancy; electrolyte imbalance and bundle branch block; atrioventricular conduction abnormalities on ECG; and ECGs without a clear QT segment. In addition to these, we also excluded those with ST-segment elevation, ST–T changes, T-wave inversion, wide QRS complexes, and ventricular preexcitation.
Our control group consisted of healthy volunteers. They had no disease and their chest radiographs were normal.
Electrocardiographic measurements
The 12-lead ECG, Cardioline Ar2100adv, Italy, was recorded on paper at 25 mm/s and 10 mm/Mv gain at rest in the supine position. All ECGs were scanned and analysed. All QT interval measurements were undertaken manually and by two investigators who were medically qualified. The QRS interval was measured from the beginning of the Q wave, or in absence of the Q wave, from the beginning of the R wave to the end of the S wave (to its return to the isoelectric line) [18]. The Tp–Te interval was measured from the peak of the T wave to the end of T wave. The end of the T wave was defined as the intersection of the tangent to the downslope of the T wave and the isoelectric line [14]. Leads were excluded if the T wave could not be clearly determined. An average value of three readings was calculated for each lead. Only recordings that had more than eight analysable leads were included in the final analysis.
Using the best available T wave in lead V5 (a method that has been already described), previous studies have accepted that precordial leads represent transmural dispersion of repolarisation well, while limb leads give good representation of apical-basal or global spatial dispersion [19, 20]. If the V5 lead was not suitable for measuring, V4 and V6 were used instead [20].
Ethical approval
The Local Ethics Committee approved the study protocol (Approval number: 21014/1812). All procedures performed in studies involving human participants were in accordance with the ethical standards of the institutional and/or national research committee and with the 1964 Helsinki declaration and its later amendments or comparable ethical standards. This article does not contain any studies with human participants or animals performed by any of the authors. Informed consent was obtained from all individual participants included in the study.
Statistical analysis
For descriptive statistics of the data the mean, standard deviation, median, minimum, maximum, frequency, and ratio values were used. Variables were analysed for the presence of normal distribution using the Kolmogorov-Smirnov test. Quantitative variables were compared using Mann-Whitney U test and independent sample t-test was used. χ2 test was used for the analysis of qualitative data, and the Fischer test was used when the χ2 test conditions were not met. The significance level and cut-off value were evaluated using the ROC curve. Statistical analyses were performed using SPSS 22.0.
Results
Sarcoidosis was seen more commonly in women (64%) in the present study. The female/male ratio was 1.75. There were no significant differences between age and sex in our study and control groups. There were significantly more co-morbidities in the sarcoidosis group than in the control group (p < 0.05).
The study population consisted of middle-aged patients, and the mean age was 45.4 ±8.7 years (range: 23–58 years). The most frequent symptoms were shortness of breath and cough, respectively. The patients’ demographics, clinical characteristics, and laboratory findings are given in Table I. According to the chest X-ray results, sarcoidosis disease severity was 26% stage 0, 45% stage I, 28% stage II, and 1% stage III. There was extrapulmonary involvement as skin involvement in 7 (9%) patients, 2 (3%) patients had ocular involvement, and neurologic involvement was detected in 2 (3%) patients.
Table I
Laboratory findings in the sarcoidosis group
[i] AST – aspartate aminotransferase, ALT – alanine aminotransferase, HDL – high-density lipoprotein, LDL – low-density lipoprotein, Fe – iron, HBA1c – glycohemoglobin, T3 – free triiodothyronine, T4 – free thyroxine, TSH – thyroid-stimulating hormone, WBC – white blood cell, RBC – red blood cell, ACE levels – angiotensin converting enzyme levels, FEV1 – forced expiratory volume in 1 s, FEV1 % pred – % predicted of forced expiratory volume in 1 s, FVC – forced vital capacity, FVC% pred – % predicted of forced vital capacity, DLCO – diffusing capacity of the lung for carbon monoxide, DLCO/VA – diffusing capacity of the lung for carbon monoxide divided by the alveolar volume.
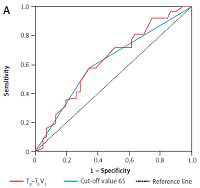
Tp–Te V1, Tp–Te V2, Tp–Te V3, Tp–Te V4, Tp–Te V5, and Tp–Te V6 values were significantly higher in patients with sarcoidosis than in controls (Figure 1). A comparative chart of Tp–Te values of the sarcoidosis and control group is shown in Figure 1. The laboratory findings of patients with sarcoidosis are shown in Table I. Tp–Te V1, Tp–Te V2, Tp–Te V3, Tp–Te V4, Tp–Te V5, and Tp–Te V6 values’ ROC curves are shown in Figure 2, and cut-off values according to the findings are specified in Table II. Comparison of Tp–Te interval between the sarcoidosis and control groups is shown in Table III. Tp–Te intervals were significantly higher in all precordial leads (Table III). There was also no significant difference between Tp–Te intervals in sarcoidosis patients who had extra-pulmonary involvement and those who had not (Table IV). Correlations between T-wave peak to end interval of chest derivations and pulmonary function tests are shown in Table V. There was a moderate correlation between FEV1%, FVC%, and Tp–Te V1 (p = 0.05 and p = 0.01, respectively). There was a moderate correlation between FEV1/FVC, DLCO/VA and Tp–Te V2, Tp–Te V3 (p = 0.001 and p = 0.03, respectively). There was also a moderate correlation between DLCO/VA and Tp–Te V4 (p = 0.001). The best cut-off values of Tp–Te intervals to predict sarcoidosis and ROC curve analysis of Tp–Te intervals are shown in Table VI and Figure 3, respectively.
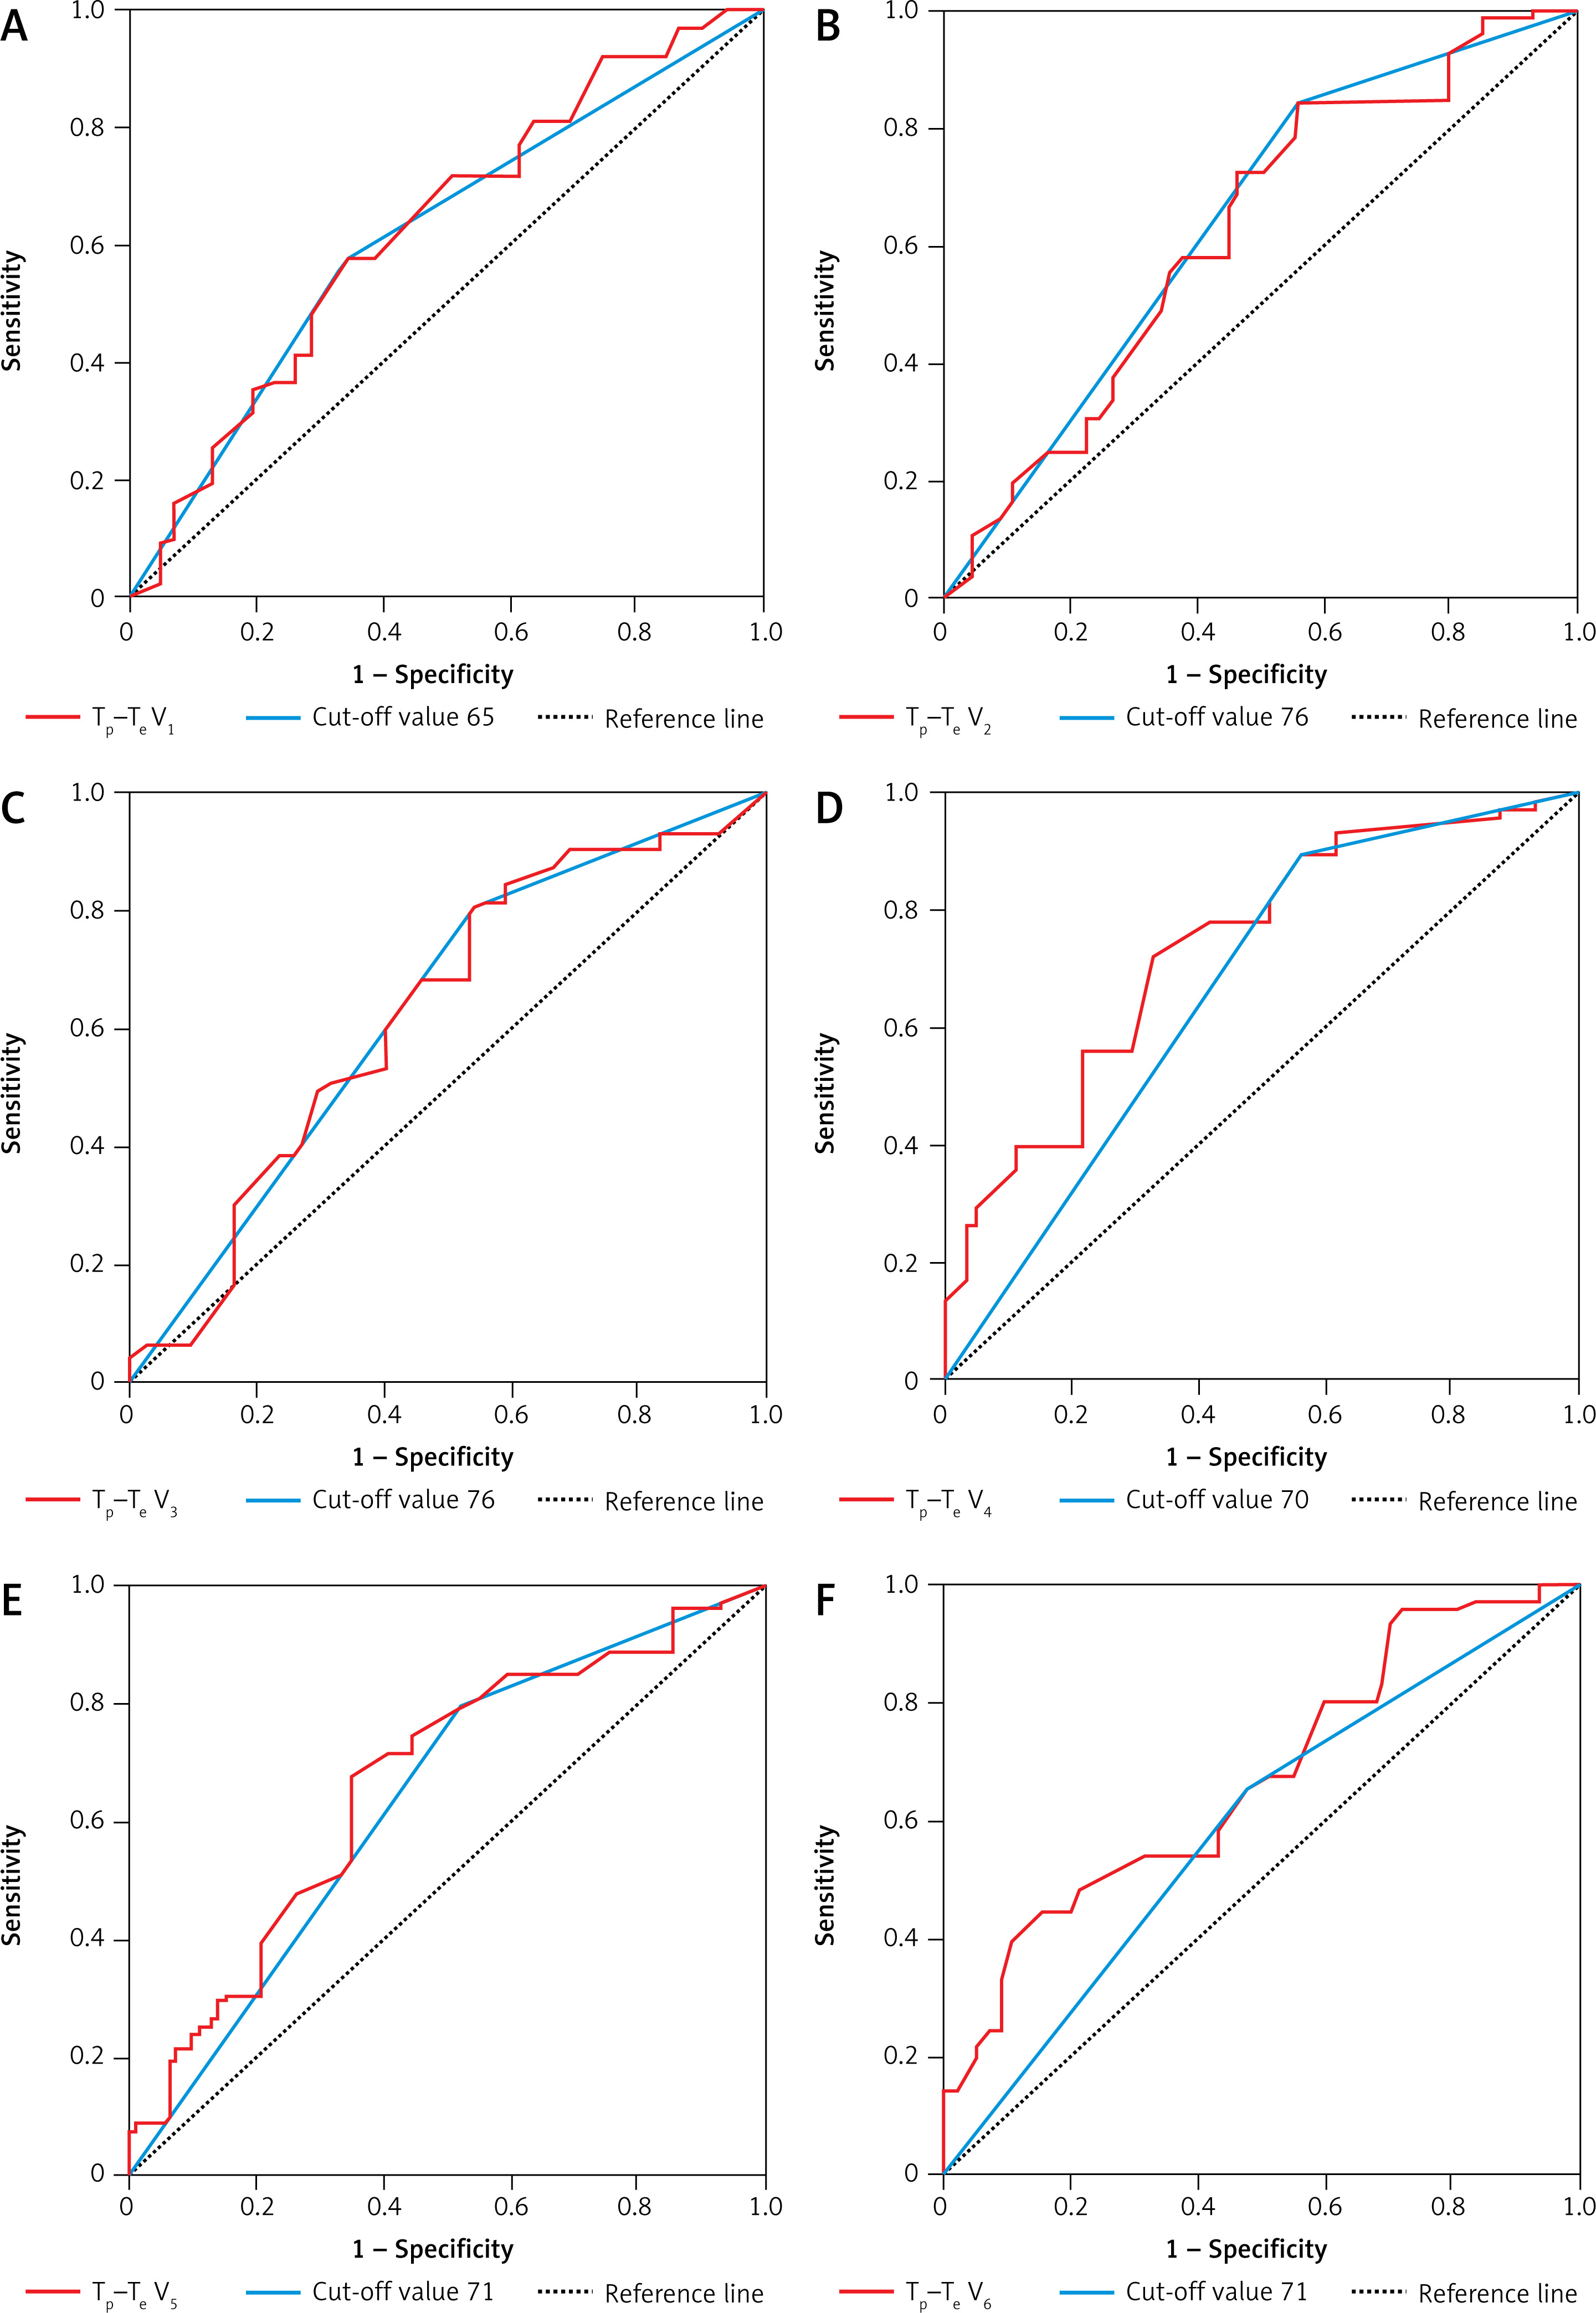
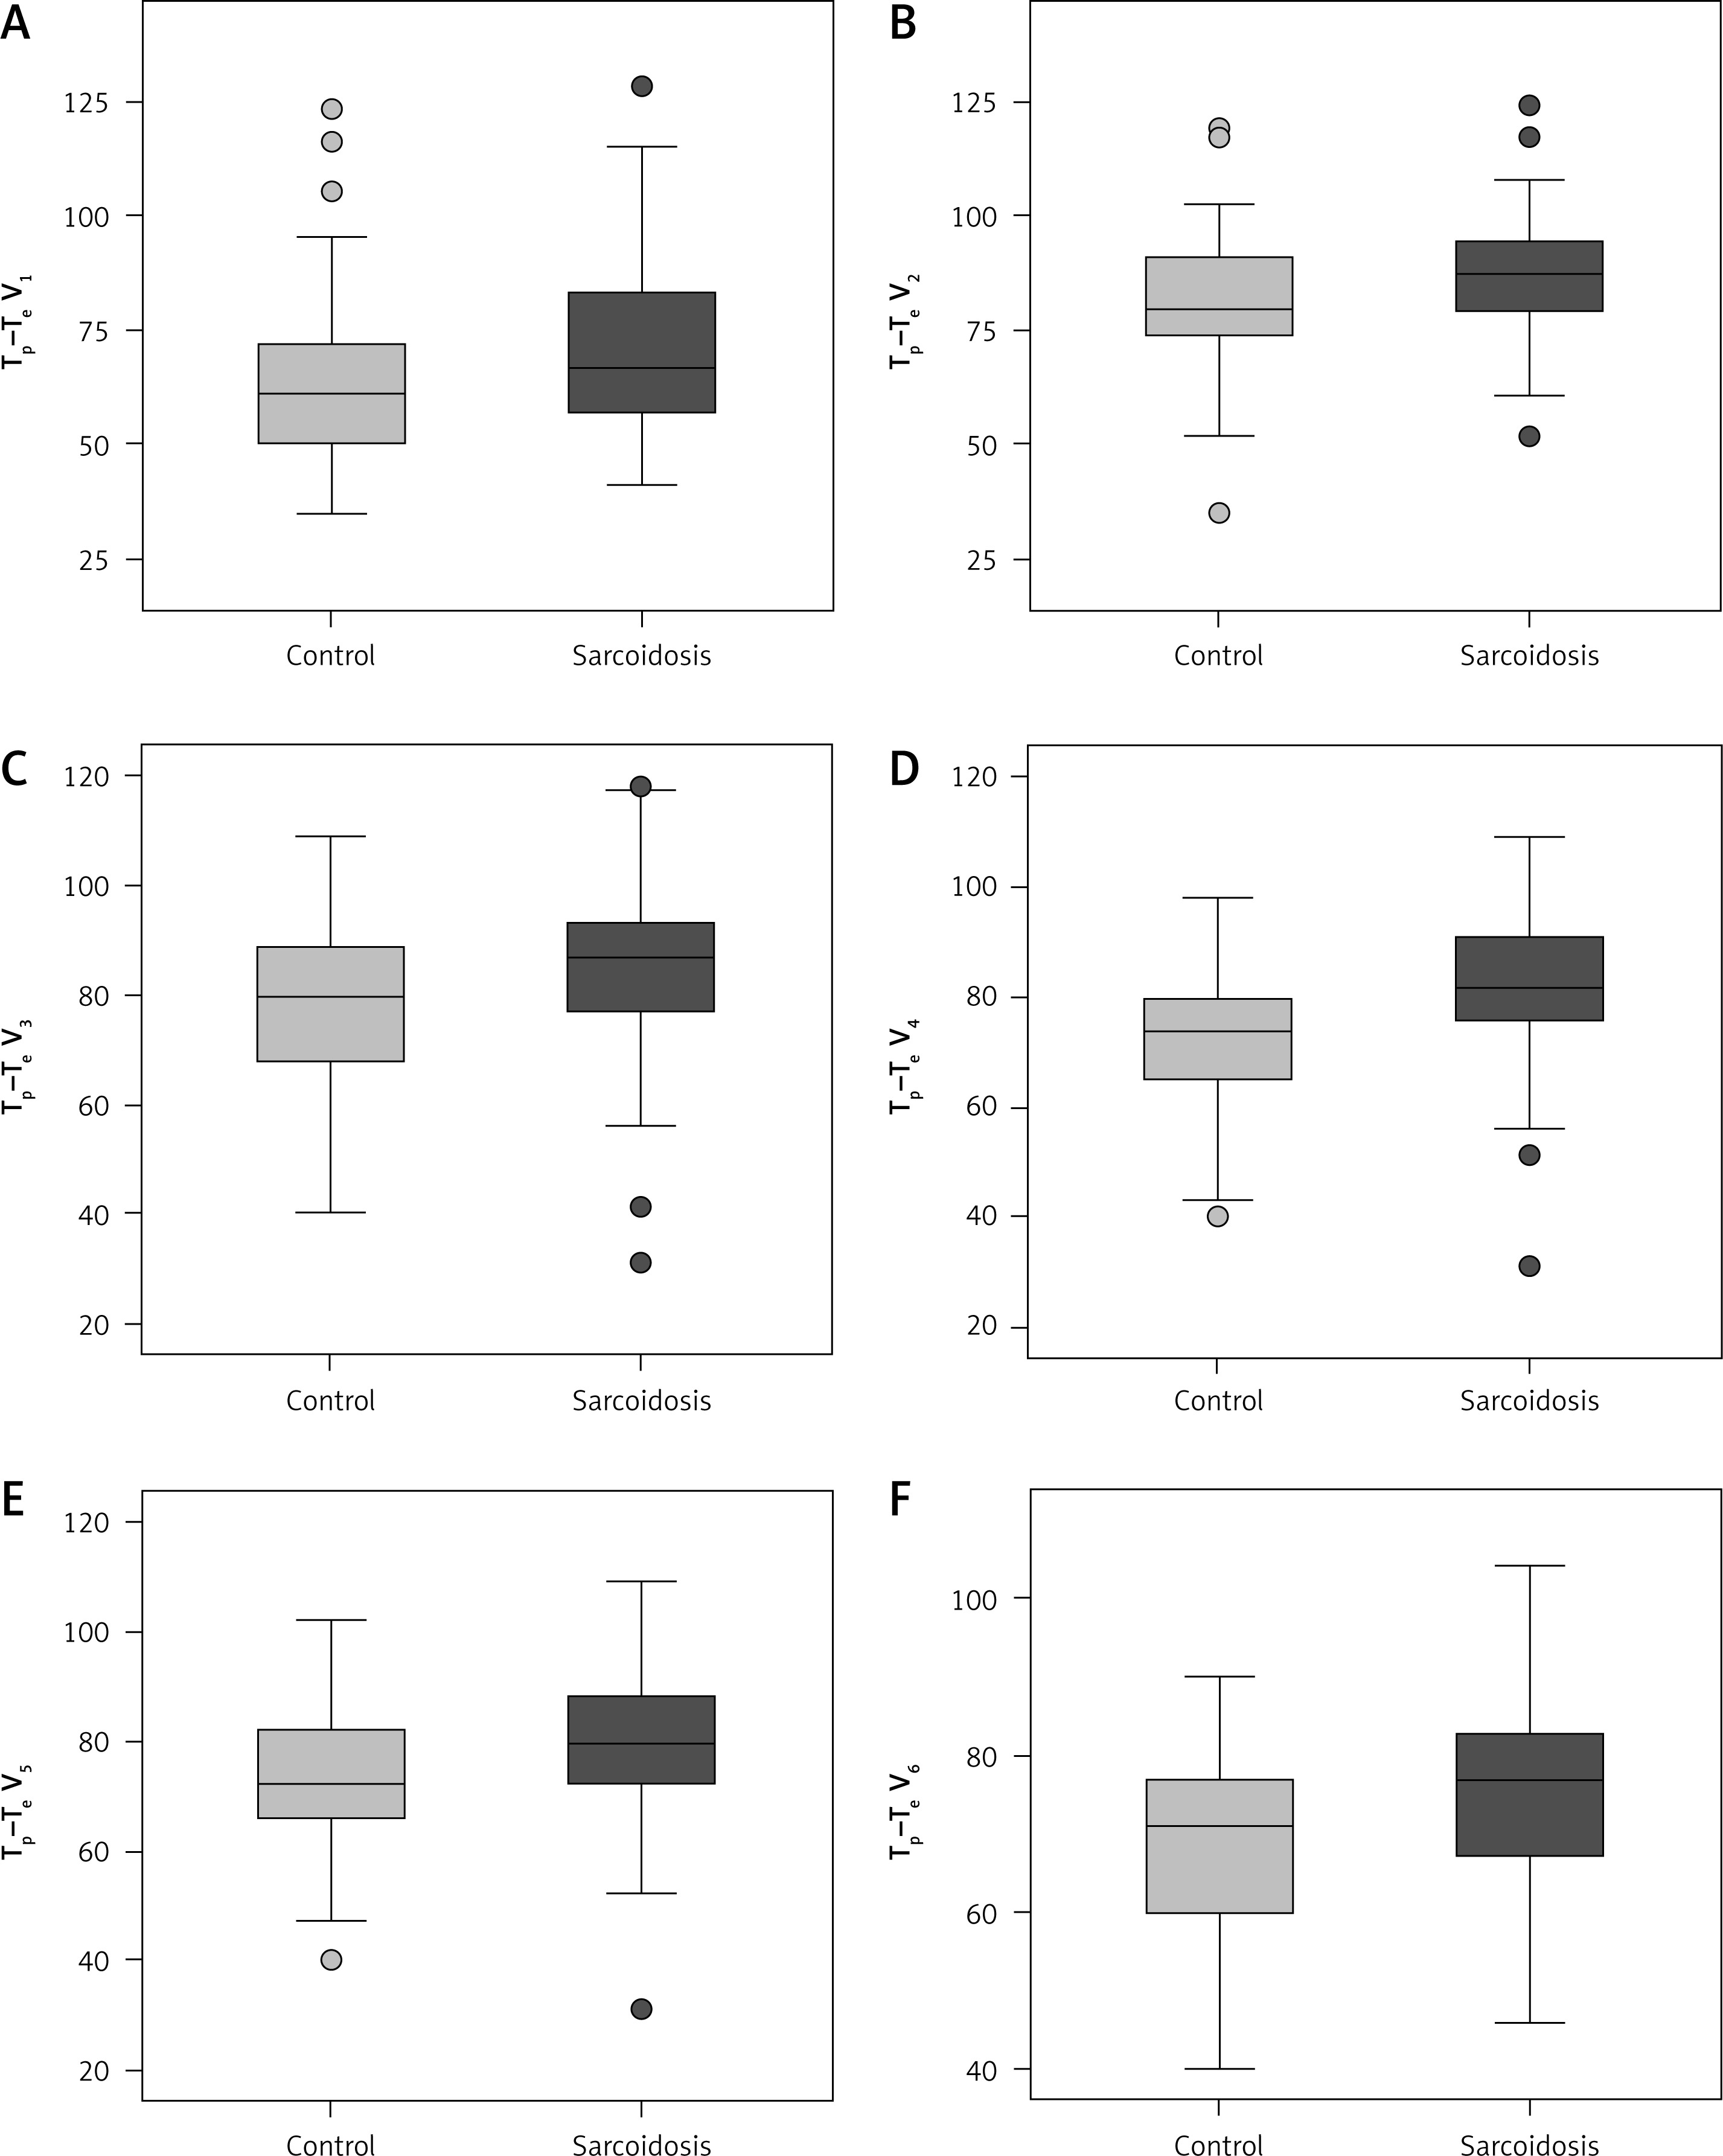
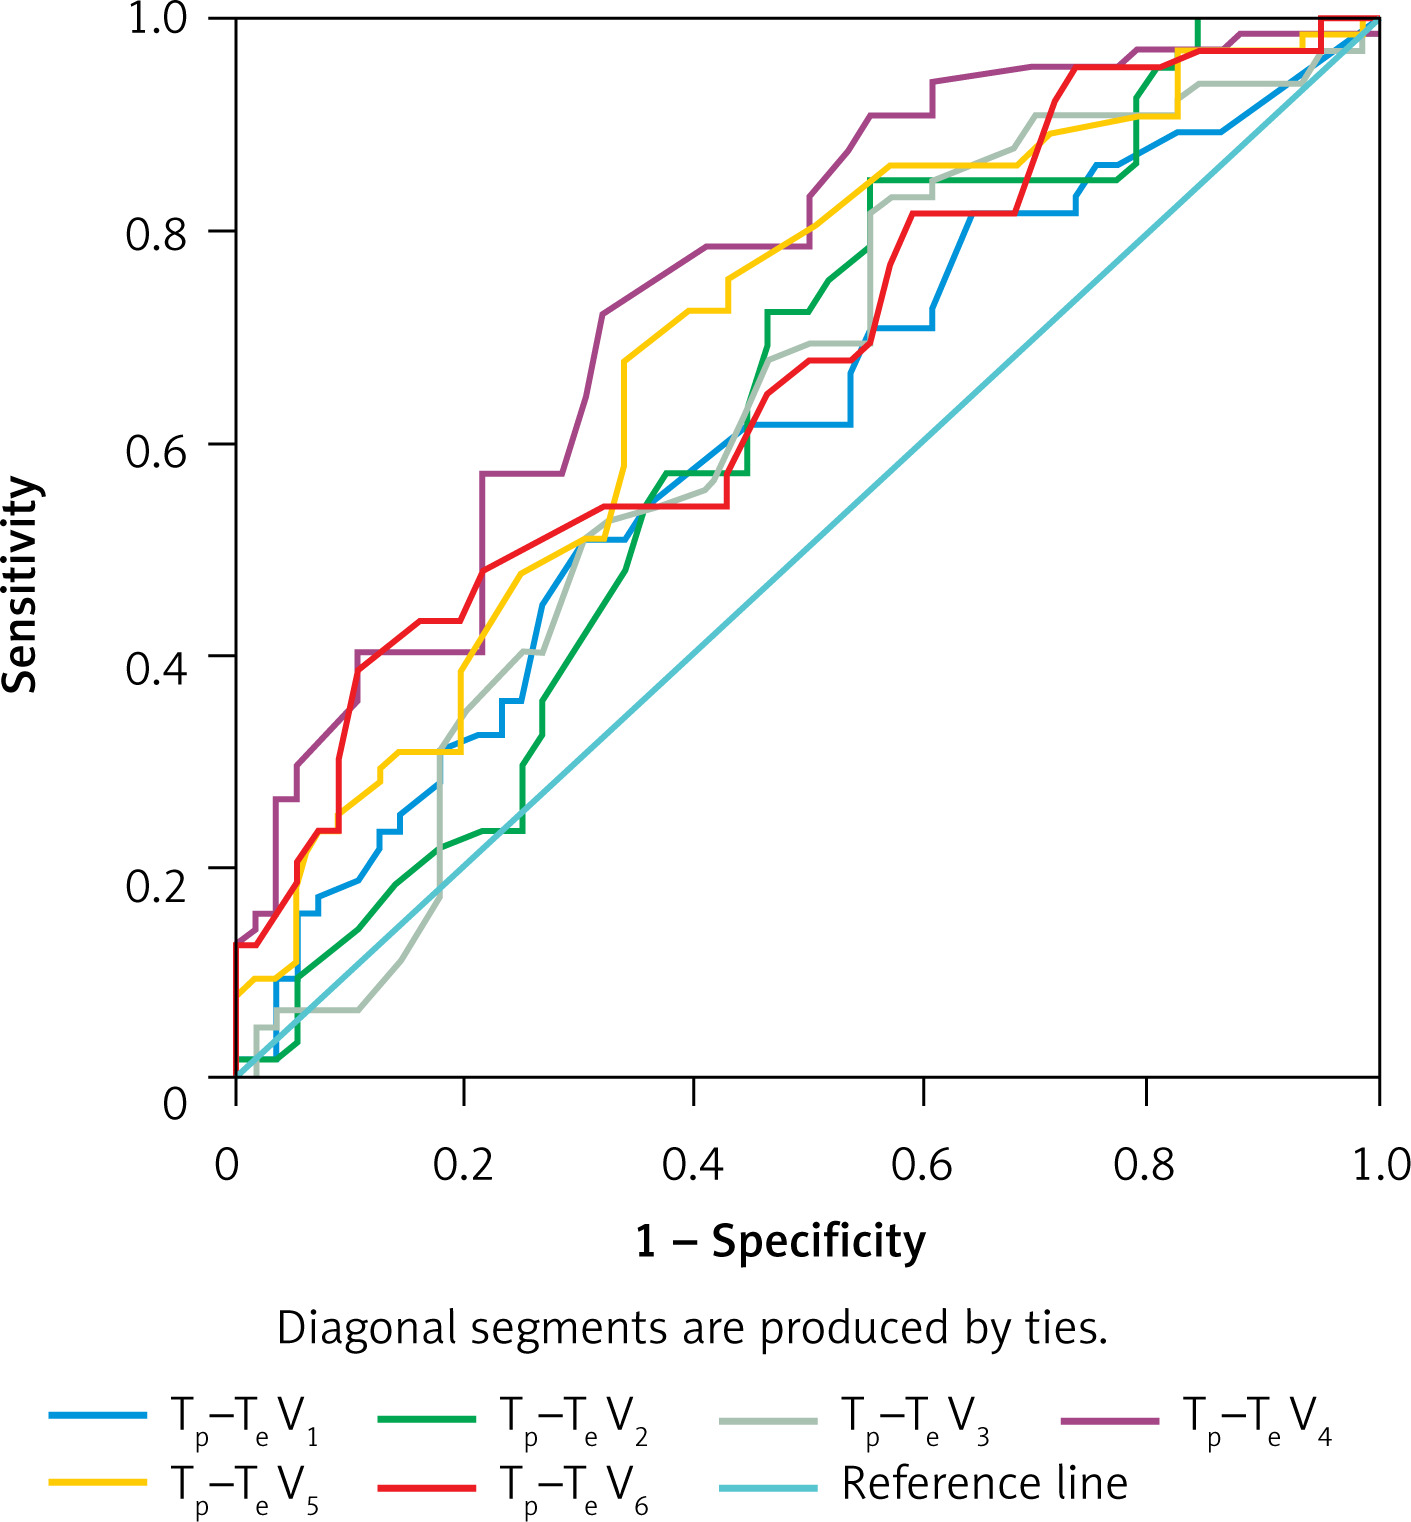
Table II
The interval from the peak to the end of the electrocardiographic T wave (ms) with cut-off levels
Table III
Comparison of Tp–Te interval between the sarcoidosis and control groups
Table IV
Comparison of Tp–Te intervals according to the presence of extra-pulmonary involvement in different stages of sarcoidosis
Table V
Correlations between T-wave peak to end interval of chest derivations and pulmonary function tests
[i] Tp–Te – T-wave peak to end interval, FEV1 % – percentage of predicted forced expiratory volume in 1 s, FVC% – percentage of predicted of forced vital capacity, DLCO – diffusing capacity of the lung for carbon monoxide, DLCO/VA – diffusing capacity of the lung for carbon monoxide divided by the alveolar volume, DLCO/VA% – percentage of predicted of diffusing capacity of the lung for carbon monoxide divided by the alveolar volume.
Table VI
The best cut-off values of Tp–Te intervals to predict sarcoidosis
Discussion
Cardiac involvement of pulmonary sarcoidosis is clinically occult in most pulmonary sarcoidosis cases. We evaluated the repolarisation dispersion obtained from 12-lead surface electrocardiograms (including Tp–Te interval) in patients with pulmonary sarcoidosis without proven cardiac involvement. Increased Tp–Te interval could be regarded as a beneficial parameter to estimate ventricular tachyarrhythmia and cardiovascular mortality. Our hypothesis was that Tp–Te intervals increase in patients with sarcoidosis, which may cause arrhythmic events; therefore, early screening would be useful to prevent patients from developing cardiac complications due to sarcoidosis. Healthy volunteers were enrolled as a control group. We found that Tp–Te V1, Tp–Te V2, Tp–Te V3, Tp–Te V4, Tp–Te V5, and Tp–Te V6 values were significantly higher in patients with sarcoidosis than in controls. We conclude that there was strong evidence that Tp–Te intervals were increased in patients with pulmonary sarcoidosis, which suggests that there may be a link between sarcoidosis and ventricular arrhythmias without proven cardiac involvement.
Even though ECG is the key modus in patients, unfortunately it has poor sensitivity; only half of the patients’ electrical defects are identified with this method [7]. Ventricular tachycardia is also one of the most frequent arrhythmias noted in cardiac sarcoidosis, and one study demonstrated a 23% incidence of ventricular tachycardia. The most frequent arrhythmia detected in cardiac sarcoidosis is ventricular tachycardia. A study stated that the incidence of ventricular tachycardia was 23% [21]. Suzuki et al. detected the sensitivity of cardiac sarcoidosis as 67% and specificity as 62% using 24-h Holter when ventricular ectopic beats numbered more than 100/day [22]. Although some studies have reported more than two-fold female dominance, the female/male ratio in other studies has been found between 1 and 1.8 [4, 5, 23–25]. As we showed, in our study the female/male ratio was 1.75. The study group comprised middle-aged patients, and that same finding has been reported previously in the Turkish population [1, 2, 5]. It was correlated with pulmonary symptoms presented in the Turkish population [5].
Previous studies have stated that continuation of the Tp–Te interval is related with increased mortality in Brugada syndrome, long QT syndrome, hypertrophic cardiomyopathy, and in patients with myocardial infarction [26]. Hence, Tp–Te interval is a novel parameter for prediction of arrhythmogenic events. The difference between the ends of the shortest and the longest periods of ventricular repolarisation is represented by the Tp–Te interval [27, 28]. Granulomas and the development of ventricular aneurysms supply a substrate for VT and ventricular fibrillation. An abnormal mechanical stimulation of the receptors in the myocardial wall with an increased reflex of the sympathetic activity may be caused by cardiac sarcoidosis with a change of the normal kinetics of the area of the heart that is involved. Sarcoid granulomas are able to develop a centre for automaticity or develop reentrant arrhythmia. Consequently, these parameters can be regarded as risk factors for sudden death in patients with cardiac sarcoidosis. ECG analyses can be used to separate patients according to risk factors.
Another factor that is associated with ventricular arrhythmias and sudden cardiac death is the transmural dispersion of repolarisation, which is calculated as the interval between the peak and the end of the T wave on electrocardiogram [14, 15]. Electro-physiologic property changes in pathologic LVH may be related with myocardial architecture deformities such as myocardial disarray, interstitial fibrosis, and inhomogeneous cardiac myocyte hypertrophy [1, 29, 30].
On the other hand, the relation between the QT duration and sudden cardiac death (SCD) in the general population is relatively week. An association between prolongation of the T-wave peak to Tp–Te and SCD has been found recently in a general population sample [31]. However, Tp–Te was shorter in patients who died from any cause compared with survivors. Moreover, it was not predictive of death in multivariable analyses when Tp–Te was measured in male patients with cardiovascular disease and the measurement points were averaged in leads V4 to V6 [32]. In a recent case-control study, Tp–Te prolongation measured in lead V5 was associated with SCD in a general population sample [31].
Increased inflammatory activity is stated as being related with the pathogenesis of cardiovascular diseases and arrhythmia in these patients [32, 33]. Ventricular arrhythmia is thought to be triggered by increased dispersion of repolarisation and disturbance of the normal orderly pattern of ventricular recovery. Recently, the Tp–Te interval has arisen as a novel electrocardiographic marker of increased diffusion of ventricular repolarisation [34].
This study has some limitations. First of all is a retrospective method of study in which patients could not be followed up prospectively for future arrhythmic events. Secondly, we had a small sample size. We did not observe any arrhythmias in the study population. The study population could not be examined in detail to show the arrhythmia because the study was designed retrospectively. Measurement of the QT interval and its dispersion was not standardised. Another limitation is that the patients with pulmonary sarcoidosis were not screened for cardiac involvement with any additional cardiac imaging modalities such as cardiac magnetic resonance or echocardiography. In published studies, death due to cardiac reasons in sarcoidosis patients has been reported in many cases. The presence of sustained ventricular tachycardia (VT), severity of heart failure, and LV end-diastolic diameter predict sudden death [35]. Currently we have very good predictive markers for ventricular arrhythmias and sudden cardiac death; late gadolinium enhancement on cardiac MRI and focal uptake on cardiac PET has also been associated with higher risk of death or VT [36–38]. Greulich et al. showed that late gadolinium enhancement on cardiac MRI predicts death and cardiac events. Defining prognostic factors is important to guide treatment in cardiac sarcoidosis [36].
However, in light of our study, we can conclude that there is a link between Tp–Te interval and ventricular arrhythmias in sarcoidosis.
In conclusion, these results contribute to the pathophysiologic mechanisms of the high prevalence of ventricular arrhythmias and cardiovascular mortality risk by revealing increased ventricular repolarisation heterogeneity in patients with sarcoidosis. The relevance of this finding to clinical outcomes and the clinical usefulness of this simple bedside parameter remains to be determined with further studies. Attention is drawn to the importance of ECG, which is a useful, simple, noninvasive, broadly accessible, easily repeatable/conducted, and affordable tool in the differentiation of patients with and without cardiac involvement in sarcoidosis. It may be used to screen for occult cardiac involvement in pulmonary sarcoidosis after further studies involving larger populations.