Introduction
Gliomas are the most common and most severe form of primary brain cancer, accounting for approximately 52% of all primary brain tumors and 20% of intracranial tumors [1]. Gliomas arise from malignant transformation of glial cells and can be subdivided into astrocytomas, oligodendrogliomas, ependymomas, and mixed gliomas according to their clinical and pathological features. Malignant glioma ranks second (behind only stroke) among all nerve-associated diseases in mortality rate [1]. Even with current surgical and chemotherapy options, the median survival time of patients with malignant glioma or glioblastoma is only 14 months [2]. While great strides in glioma research have been made over the last two decades, the exact pathological mechanism underlying the disease has not been defined [3]. Thus, additional research is required to not only better understand the disease itself but also to improve prognosis and therapeutic options for patients.
Long non-coding RNAs (lncRNAs) are regulatory RNA transcripts typically over 200 nucleotides in length [4]. In mammals, lncRNAs are 6–8 times more abundant than mRNAs and are encoded by 4–9% of the entire genome [5]. While originally considered the “noise” of transcription, lncRNAs are now known to be vital in multiple molecular processes, including chromatin modification [5, 6], transcriptional activation [7], and post-transcriptional regulation [8]. LncRNAs have also been shown to be critical in a number of physiological and pathological processes [9–13].
Aberrant expression of lncRNAs has been linked to tumorigenesis [14, 15]. For example, one study used a hepatocellular carcinoma-specific cDNA microarray to identify increased expression of the lncRNA HULC in tumor tissue [15]. Additionally, lncRNA-HULC was also detectable in the plasma of hepatocellular carcinoma patients, thus making it a potential diagnostic biomarker [15]. LncRNA-HULC (hepatocellular carcinoma up-regulated long non-coding RNA) was also shown to regulate the expression of multiple genes in hepatocellular carcinoma cells, strengthening the link between this lncRNA and tumorigenesis [12]. Overexpression of the lncRNA maternally expressed gene 3 (MEG3) inhibited proliferation and induced apoptosis of both U87 MG and U251 human glioma cell lines [16]. The authors showed that this effect was due to the interaction among MEG3, p53, MDM2, and GDF15 [17]. Another study examined the expression profiles of both lncRNAs and mRNAs in glioblastoma; the authors found two lncRNAs, ASLNC22381 and ASLNC2081, that were related to the disease via their regulation of insulin-like growth factor 1 (IGF-1) [18]. Zhang et al. used a combination of publicly available data and their own microarray analysis to assess lncRNA expression in astrocytic and oligodendroglial glioma [19]. Interestingly, they found a significant correlation between the expression of specific lncRNAs and both malignancy grade and histological differentiation [19]. The follow-up to these findings has been limited due to insufficient quantity of samples and to limited lncRNAs included on microarray platforms. Despite this, much of this earlier work laid the foundation for a role for lncRNAs in glioma development – a topic that deserves more extensive study.
Here, we used lncRNA expression profiling microarray to identify differentially expressed lncRNAs in clinical glioma samples compared to normal tissue. Six lncRNAs (ak125809, ak098473, uc002ehu.1, bc043564, NR_027322, and uc003qmb.2) were selected and validated by quantitative real-time RT-PCR (qPCR). We established an mRNA/lncRNA co-expression network to identify key regulators of glioma development. The data we present here may provide a better understanding of the disease and new therapeutic strategies to combat it in patients.
Material and methods
Sample collection
Forty cases of glioma and peritumoral tissue were obtained from the Neurosurgery Department of Nanjing Brain Hospital Affiliated with Nanjing Medical University. Peritumoral tissue was obtained from both a surgical approach and peripheral edema tissue. Pathological categories were evaluated by the hospital’s pathologist (ID: NJNKYY2012LS027). Written informed consent was obtained from all patients. This study was approved by the Ethics Committee of the University. Following collection, specimens were shipped and preserved in liquid nitrogen. Details are shown in supplement material 1. The protocol for the tissue collection was as follows: (1) Record the information of tumor tissue on the tissue cryopreserved tube; (2) wash the tumor tissue with saline, use ophthalmic scissors, ophthalmic tweezers to remove blood vessels, envelopes and necrotic tissue; (3) cut the tumor tissue into 2 mm thick slices; (4) flatten tissue on sterile gauze, and remove the surface liquid of tissue sections; (5) quickly immerse the tissue in liquid nitrogen, not less than 5 minutes; (6) quickly move the tissue into the tissue cryopreservation tube, tighten the tube and move into the liquid nitrogen tank for preservation.
RNA extraction
Total RNA was isolated with TRIzol reagent (Invitrogen, CA, USA) following the single-step method [20]: 1) Glioma and adjacent tissues were pulverized with a mortar and pestle in liquid nitrogen. Tissue samples were homogenized in 1 ml of Trizol per 50 mg of tissue until liquid nitrogen evaporated. 2) The homogenate was pipetted up and down several times and transferred to an Eppendorf tube. 3) Homogenized samples were incubated for 5 min at room temperature and then centrifuged at 12,000 rpm for 5 min according to the protocol. Next, 200 μl of chloroform was added per 1 ml of TRIzol. Samples were incubated for 15 min at room temperature and centrifuged at 12,000 rpm for 15 min at 4°C. The upper soluble layer was isolated and mixed with 0.5 ml of isopropanol per 1 ml of TRIzol. Samples were incubated for 10 min at room temperature and centrifuged at 12,000 rpm for 10 min at 4°C. The supernatant was removed and washed with 1 ml of 75% ethanol. Samples were then centrifuged at 8,000 rpm for 5 min at 4°C. This was followed by a brief incubation at room temperature to allow the samples to dry. Finally, RNA samples were dissolved in 50 μl of DEPC water and stored at –80°C until use. The concentration of each sample was determined using the NanoDrop ND-1000 Spectrophotometer (NanoDrop Technologies, Inc., USA). RNA integrity was evaluated by electrophoresis on a denaturing agarose gel.
LncRNA and mRNA microarrays
Total RNA from both glioma (0301, 0605, and 114982) and peritumoral tissue (0601) was isolated and converted into double-stranded complementary DNA (cDNA). The synthesized cDNAs were labeled and hybridized to Arraystar Human lncRNA Microarray V2.0 (Arraystar, Rockville, MD) containing probes for 33,045 lncRNAs and 30,215 mRNAs identified from both publications and authoritative databases, such as RefSeq, UCSC Knowngenes, and Ensembl. Each transcript was represented by a specific exon or splice junction probe, which could accurately identify individual transcripts. Positive control probes and negative control probes for housekeeping genes were also printed onto the array [21].
Microarray hybridization and data analysis
Arraystar lncRNA Array Protocol: step 1 – Prepare the RNA sample using the following reagents and kits: TRIzol Reagent (Invitrogen Life Technologies), Biopulverizer (Biospec), and Mini-Bead-Beater-16 (Biospec); step 2 – Total RNA clean-up and quality control using the following reagents and instruments: RNeasy Mini Kit (Qiagen, p/n 74104), NanoDrop ND-1000, and Baseline-ZERO DNase (EPICENTRE, Cat. Nos. DB0711K); step 3 – Prepare labeling reaction with the following: Quick Amp Labeling Kit and One-Color (Agilent p/n 5190-0442); step 4 – Purify the labeled RNA using the RNeasy Mini Kit (Qiagen, p/n 74104) and NanoDrop ND-1000; step 5 – Hybridization using the Agilent Gene Expression Hybridization Kit (Agilent, p/n 5188-5242), stainless hybridization chamber (Agilent, p/n G2534A), Hybridization Chamber gasket slides (Agilent, p/n G2534-60003), Hybridization oven (Agilent, p/n G2545A), and Hybridization oven rotator for Agilent Microarray Hybridization Chambers (Agilent, p/n G2530-60029); step 6 – Microarray Wash using Gene Expression Wash Buffer 1 (Agilent, p/n 5188-5325), Gene Expression Wash Buffer 2 (Agilent, p/n 5188-5326), Magnetic stir bar (Corning, p/n 401435), Magnetic stir plate (Corning, p/n 6795-410), and Slide-staining dish with slide rack (Thermo Shandon, p/n 121); step 7 – Scanning performed with Agilent Microarray Scanner (Agilent p/n G2565BA); step 8 – Extract data using Agilent Feature Extraction software. Following scanning on the Agilent Scanner G2505B, acquired images were analyzed with Agilent Feature Extraction software (version 10.7.3.1). Data analysis and normalization were performed using the GeneSpring GX v11.5.1 software package (Agilent Technologies). All microarray work and data processing were carried out by KangChen Bio-tech (Shanghai, P.R. China) [22].
Real-time quantitative polymerase chain reaction (RT-qPCR)
Total RNA was extracted using TRIzol (Invitrogen, CA, USA). Reverse transcription was performed using the PrimeScript RT reagent Kit with gDNA Eraser (Perfect Real Time) (TaKaRa, Dalian, China) according to the manufacturer’s protocol. Expression of lncRNAs (ak125809, ak098473, uc002ehu.1, bc043564, NR_027322, and uc003qmb.2) was determined using the SYBRGreen detection method (TaKaRa, Dalian, China). Samples were run on an ABI7500 System (Applied Biosystems, Foster City, CA). Primer sequences for lncRNA detection are listed in Table I. β-actin was used as a normalization control. The qPCR reaction was carried out in a total volume of 20 μl. The reaction consisted of 10 μl of 2 × SYBR Green Master mix, 1 μl of PCR Forward Primer (5 μmol/μl), 1 μl of PCR Reverse Primer (5 μmol/μl), 1 μl cDNA (10 ng), and 7 μl of RNase-free water. The RT-qPCR reaction was performed as follows: initial denaturation at 95°C for 10 min, 40 cycles of denaturation at 95°C for 15 s, annealing at 60°C for 30 s, and extension at 72°C for 30s, and a final extension at 72°C for 5 min. Each sample was analyzed in triplicate. The threshold cycle (CT) value was calculated by the mean value. Quantitative differential expression was calculated according to the 2–ΔΔCt method [23]. Statistical analysis was conducted using Student’s t test and SPSS software (Version 16.0 SPSS Inc.). Statistical significance was set at p < 0.05.
Table I
Primers for qPCR
Pathway analysis
Differentially expressed mRNAs were examined by pathway analysis using the latest KEGG (Kyoto Encyclopedia of Genes and Genomes) database. A number of specific biological pathways were identified by enrichment of the differentially expressed mRNAs. For statistical significance, the p-value cut-off was set at 0.05.
Establishing co-expression networks
Co-expression networks of lncRNAs and mRNAs were constructed by differential gene expression. Different networks were drawn based on calculations of different types of expression data. For example, the co-expression network in the control group was calculated by differential gene expression in control samples, while that in the experimental group was calculated by differential gene expression in experimental samples. We calculated the Pearson correlation coefficient for each pair of genes. Regulatory relationships were identified when the Pearson coefficients achieved statistical significance; subsequently, significant correlation pairs were chosen to construct a network. An array M was constructed based on the regulatory relationship between genes and mapped into the network diagram. Within the network diagram, each node represents a single gene, and the edges between two nodes represent an interaction between genes, i.e. the correlation between lncRNA-mRNA, lncRNA-lncRNA, and mRNA-mRNA.
The degree of connectivity was used to assess the importance of the gene in the network. Degrees were used to quantify interactions between target genes. For any given gene, the higher its degree, the more regulatory relationships it is involved in with other genes in the network. Thus, the higher the degree, the more central the gene is in the network. Clustering coefficients were used to calculate the density of interactions among neighboring genes. The higher the clustering coefficient, the greater was the possibility that the gene was located in a core region and that neighboring genes were part of the core network as well. Core genes, which had high degree values, were defined as genes having extensive connections to other genes in the network. Comparisons between different networks were used to discover different gene connections in different networks.
Statistical analysis
Each experiment was performed in triplicate, and all data were represented as average values. Differences between average values were analyzed using Student’s t test. All statistical analyses were performed with SPSS software (Version 13.0; SPSS, Inc., Chicago, IL, USA).
Important biological pathways were identified with Fisher’s test and the χ2 test. Both p-value and FDR (the p-value cut-off is 0.05) were used as selection criteria. Enrichment was calculated based on the following formula: Re = (nf/n)/(Nf/N)(Re = ENRICHMENT), where nf is the number of differentially expressed genes in a particular gene category, n is the total number of genes in that category, Nf is the number of differentially expressed genes in the entire microarray, and N is the total number of genes included in the microarray [24–26].
Results
Aberrantly expressed lncRNAs in glioma
We performed microarray analyses to identify lncRNAs and mRNAs that were differentially expressed between glioma tumor tissue (0301, 0605, and 114982) and peritumoral tissue (0601) (Figure 1 A). Differences in expression are represented as fold change of tumor/normal (T/N). A fold change ≥ 3 was used to filter the data (a negative fold change value indicated down-regulation and a positive value indicated up-regulation). In some cases, log2 fold changes are listed. P-value and fold change were both calculated by normalized expression data. Using these parameters, we identified thousands of lncRNAs that were differentially expressed between glioma and normal tissue. Importantly, these lncRNAs have been described in several publications and are also included in a number of databases, including UCSC_knowngene, Ensembl, RefSeq_NR, H-invDB, Fantom, Fantom_stringent, RNAdb, NRED, misc_lncRNA, and UCR.
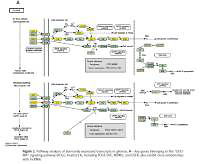
Figure 1
Microarray analysis was applied to detect the lncRNAs and mRNAs in glioma compared to normal peritumoral tissue. A – Differentially expressed lncRNAs were detected in gliomas. A, B – Differentially expressed mRNAs were detected in gliomas. C – Clustering data of lncRNAs in gliomas were analyzed. D – Clustering data of mRNAs in gliomas were analyzed
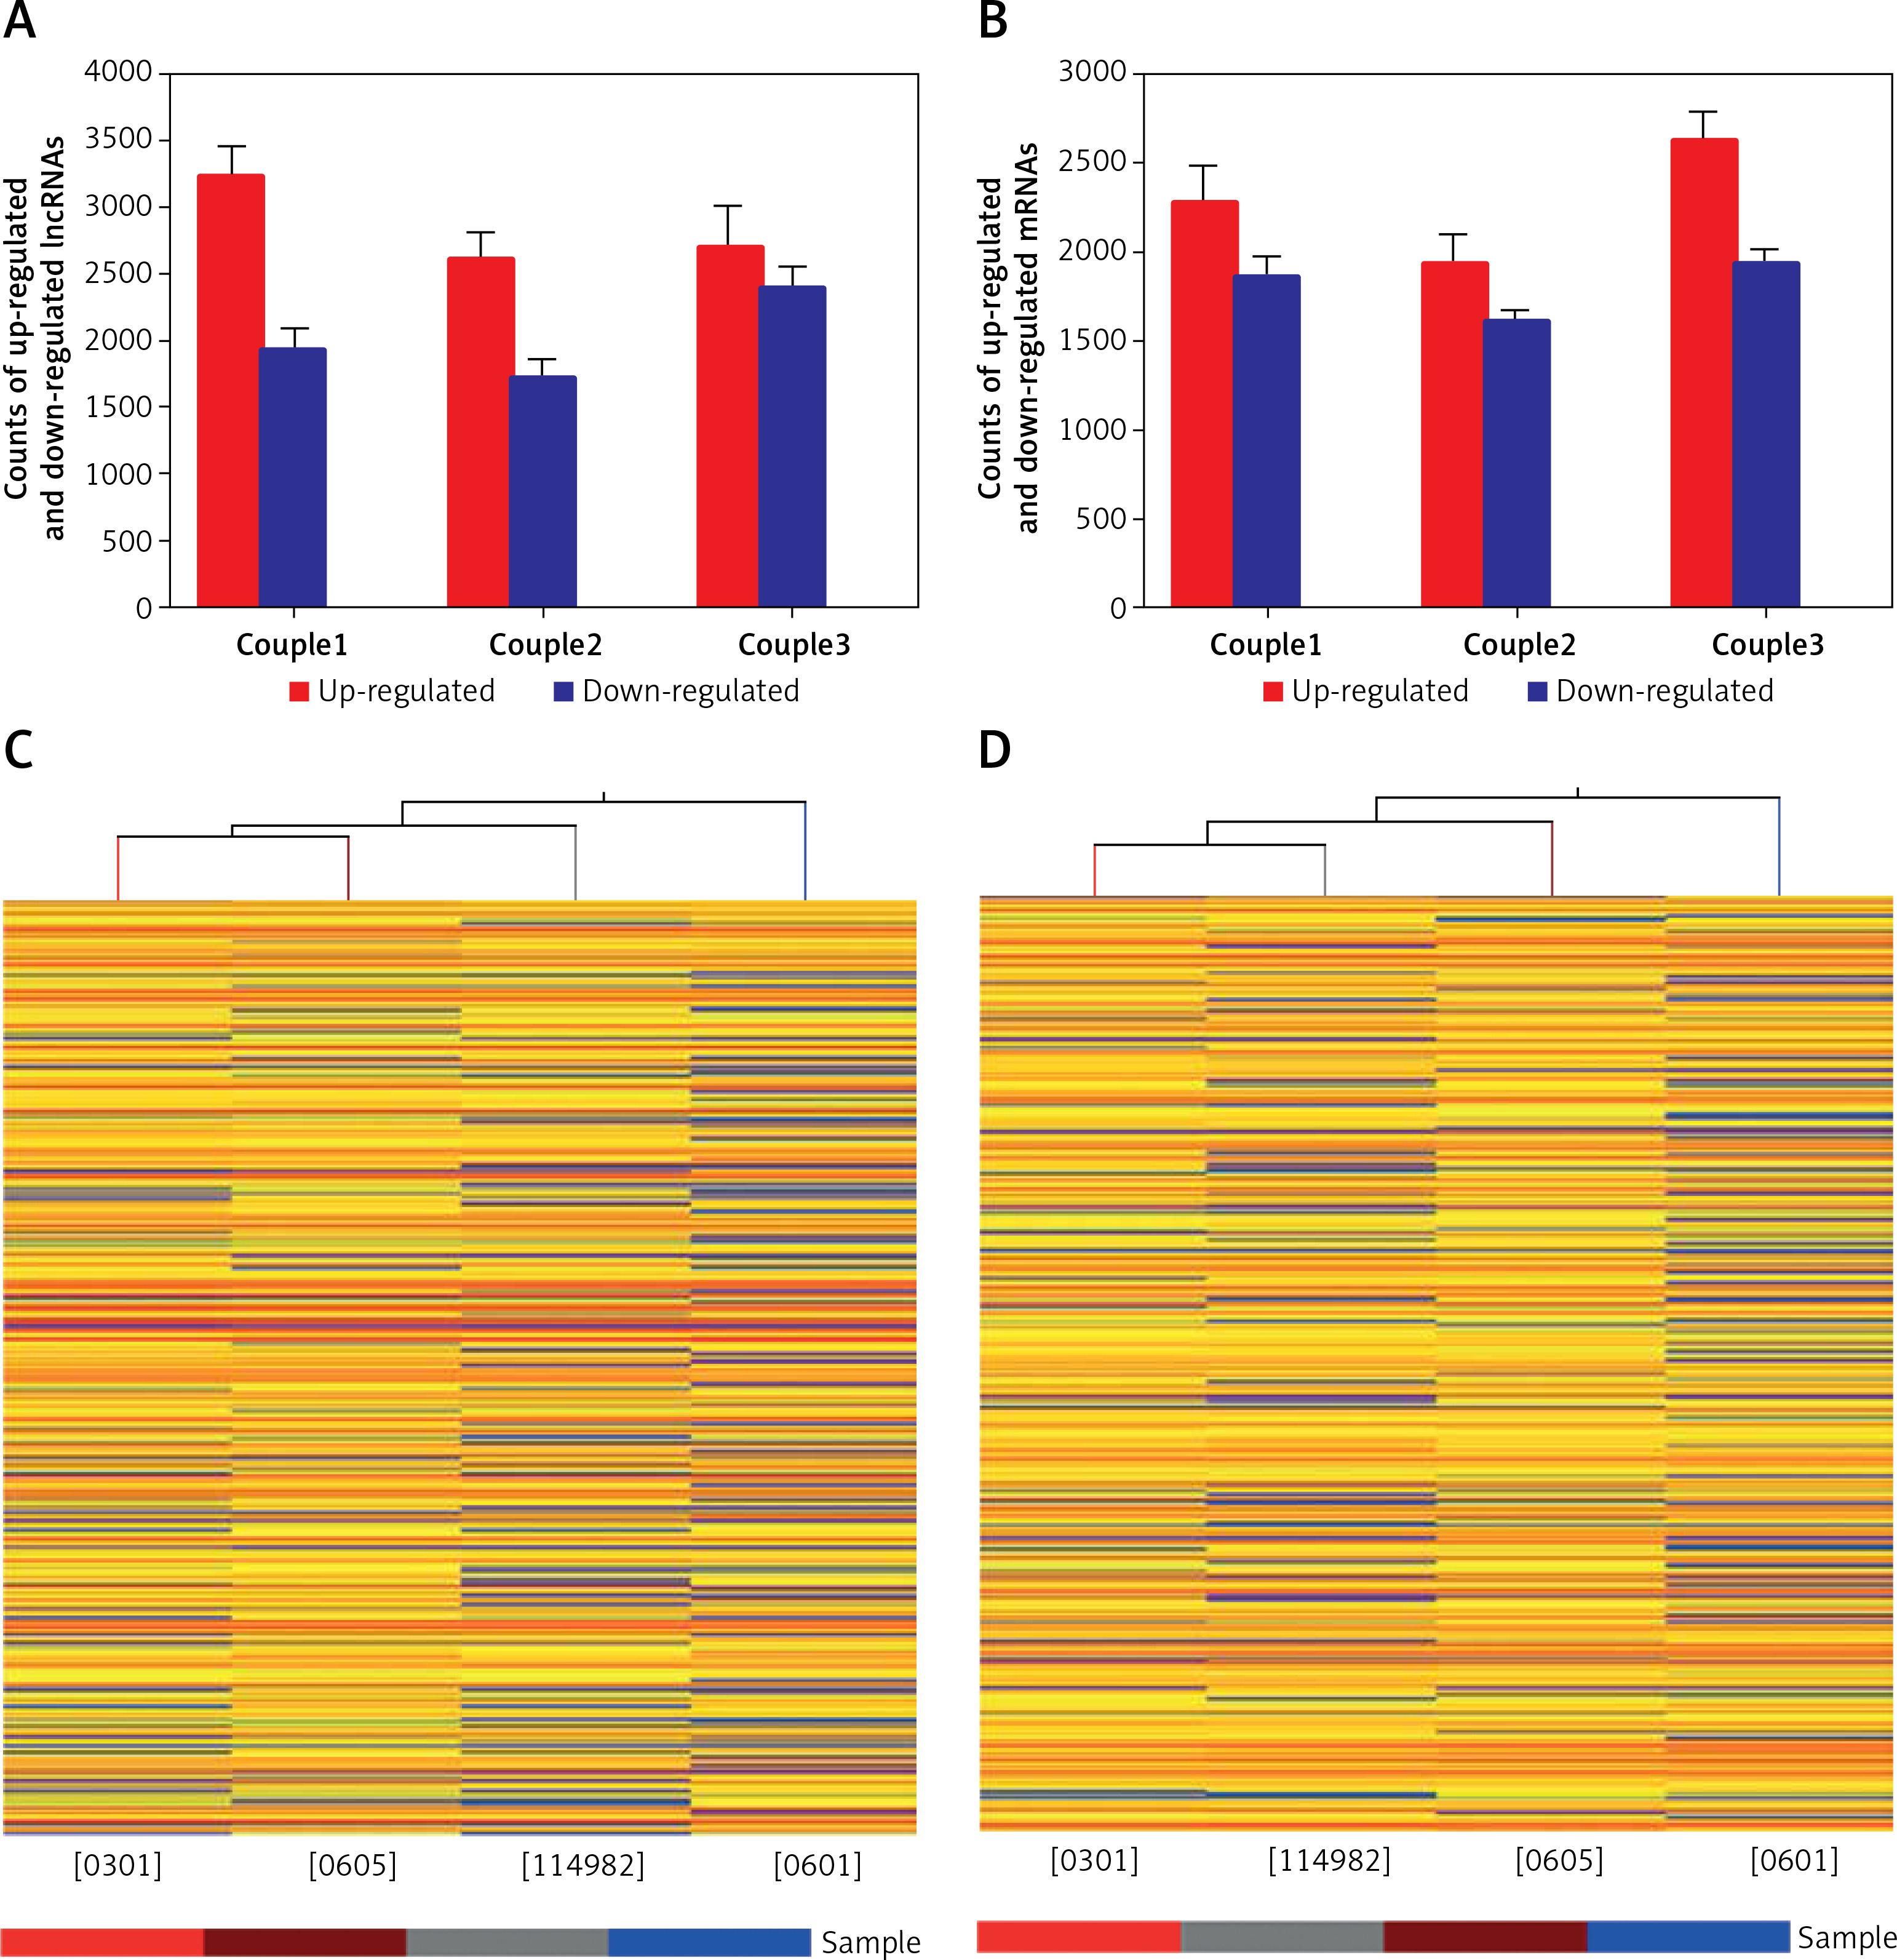
We next compared lncRNA expression between tumor tissue and matched peritumoral tissue. While more than 23,000 lncRNAs were detected in all tissues, only a few thousand were found to be significantly differentially expressed. An average of 4,858 (4330–5153) lncRNAs were differentially expressed in glioma compared to peritumoral tissue. These consisted of 2,845 (2,610–3,228) up-regulated (fold change > 3.0) lncRNAs and 2,013 (1,720–2,395) down-regulated (fold change < 1/3) lncRNAs. In tissues obtained from the three glioma patients, there were 1,290 lncRNAs that were up-regulated or down-regulated more than 3-fold; additionally, 494 were changed (either up or down) more than 5-fold, and 145 lncRNAs altered by greater than 10-fold. Of all differentially expressed lncRNAs, uc002ukq.2 (log2 fold change T/N = 8.50108) was the most significantly up-regulated and AK002107 (log2 fold change T/N = –10.64121) was the most significantly down-regulated.
Of all differentially expressed lncRNAs, a majority were up-regulated in glioma; in contrast, a smaller percentage of lncRNAs were down-regulated in tumor tissue (Figure 1 B). Differentially expressed lncRNAs and mRNAs are provided in Table II. In general, the greater the fold change value, the more likely that a particular lncRNA is involved in tumor development. To narrow down our list, we chose 6 lncRNAs (ak125809, ak098473, uc002ehu.1, bc043564, NR_027322, and uc003qmb.2) showing the greatest fold changes and the highest raw intensity values for further investigation.
Table II
Summary of data from microarray for three pairs of glioma and adjacent normal tissues
Aberrantly expressed mRNAs in glioma
We identified 18,315 mRNA transcripts that were differentially expressed between tumor tissue and normal tissue. An average of 2,280 (1,936–2,626) mRNAs were up-regulated more than 3-fold in tumor tissue and an average of 1,804 (1,612–1,938) mRNAs were down-regulated (fold change < 1/3) in tumors. In the three glioma samples, 1,735 mRNAs were differentially expressed greater than 3-fold, 762 mRNAs greater than 5-fold, and 272 mRNAs greater than 10-fold (Table II).
Pathway analysis
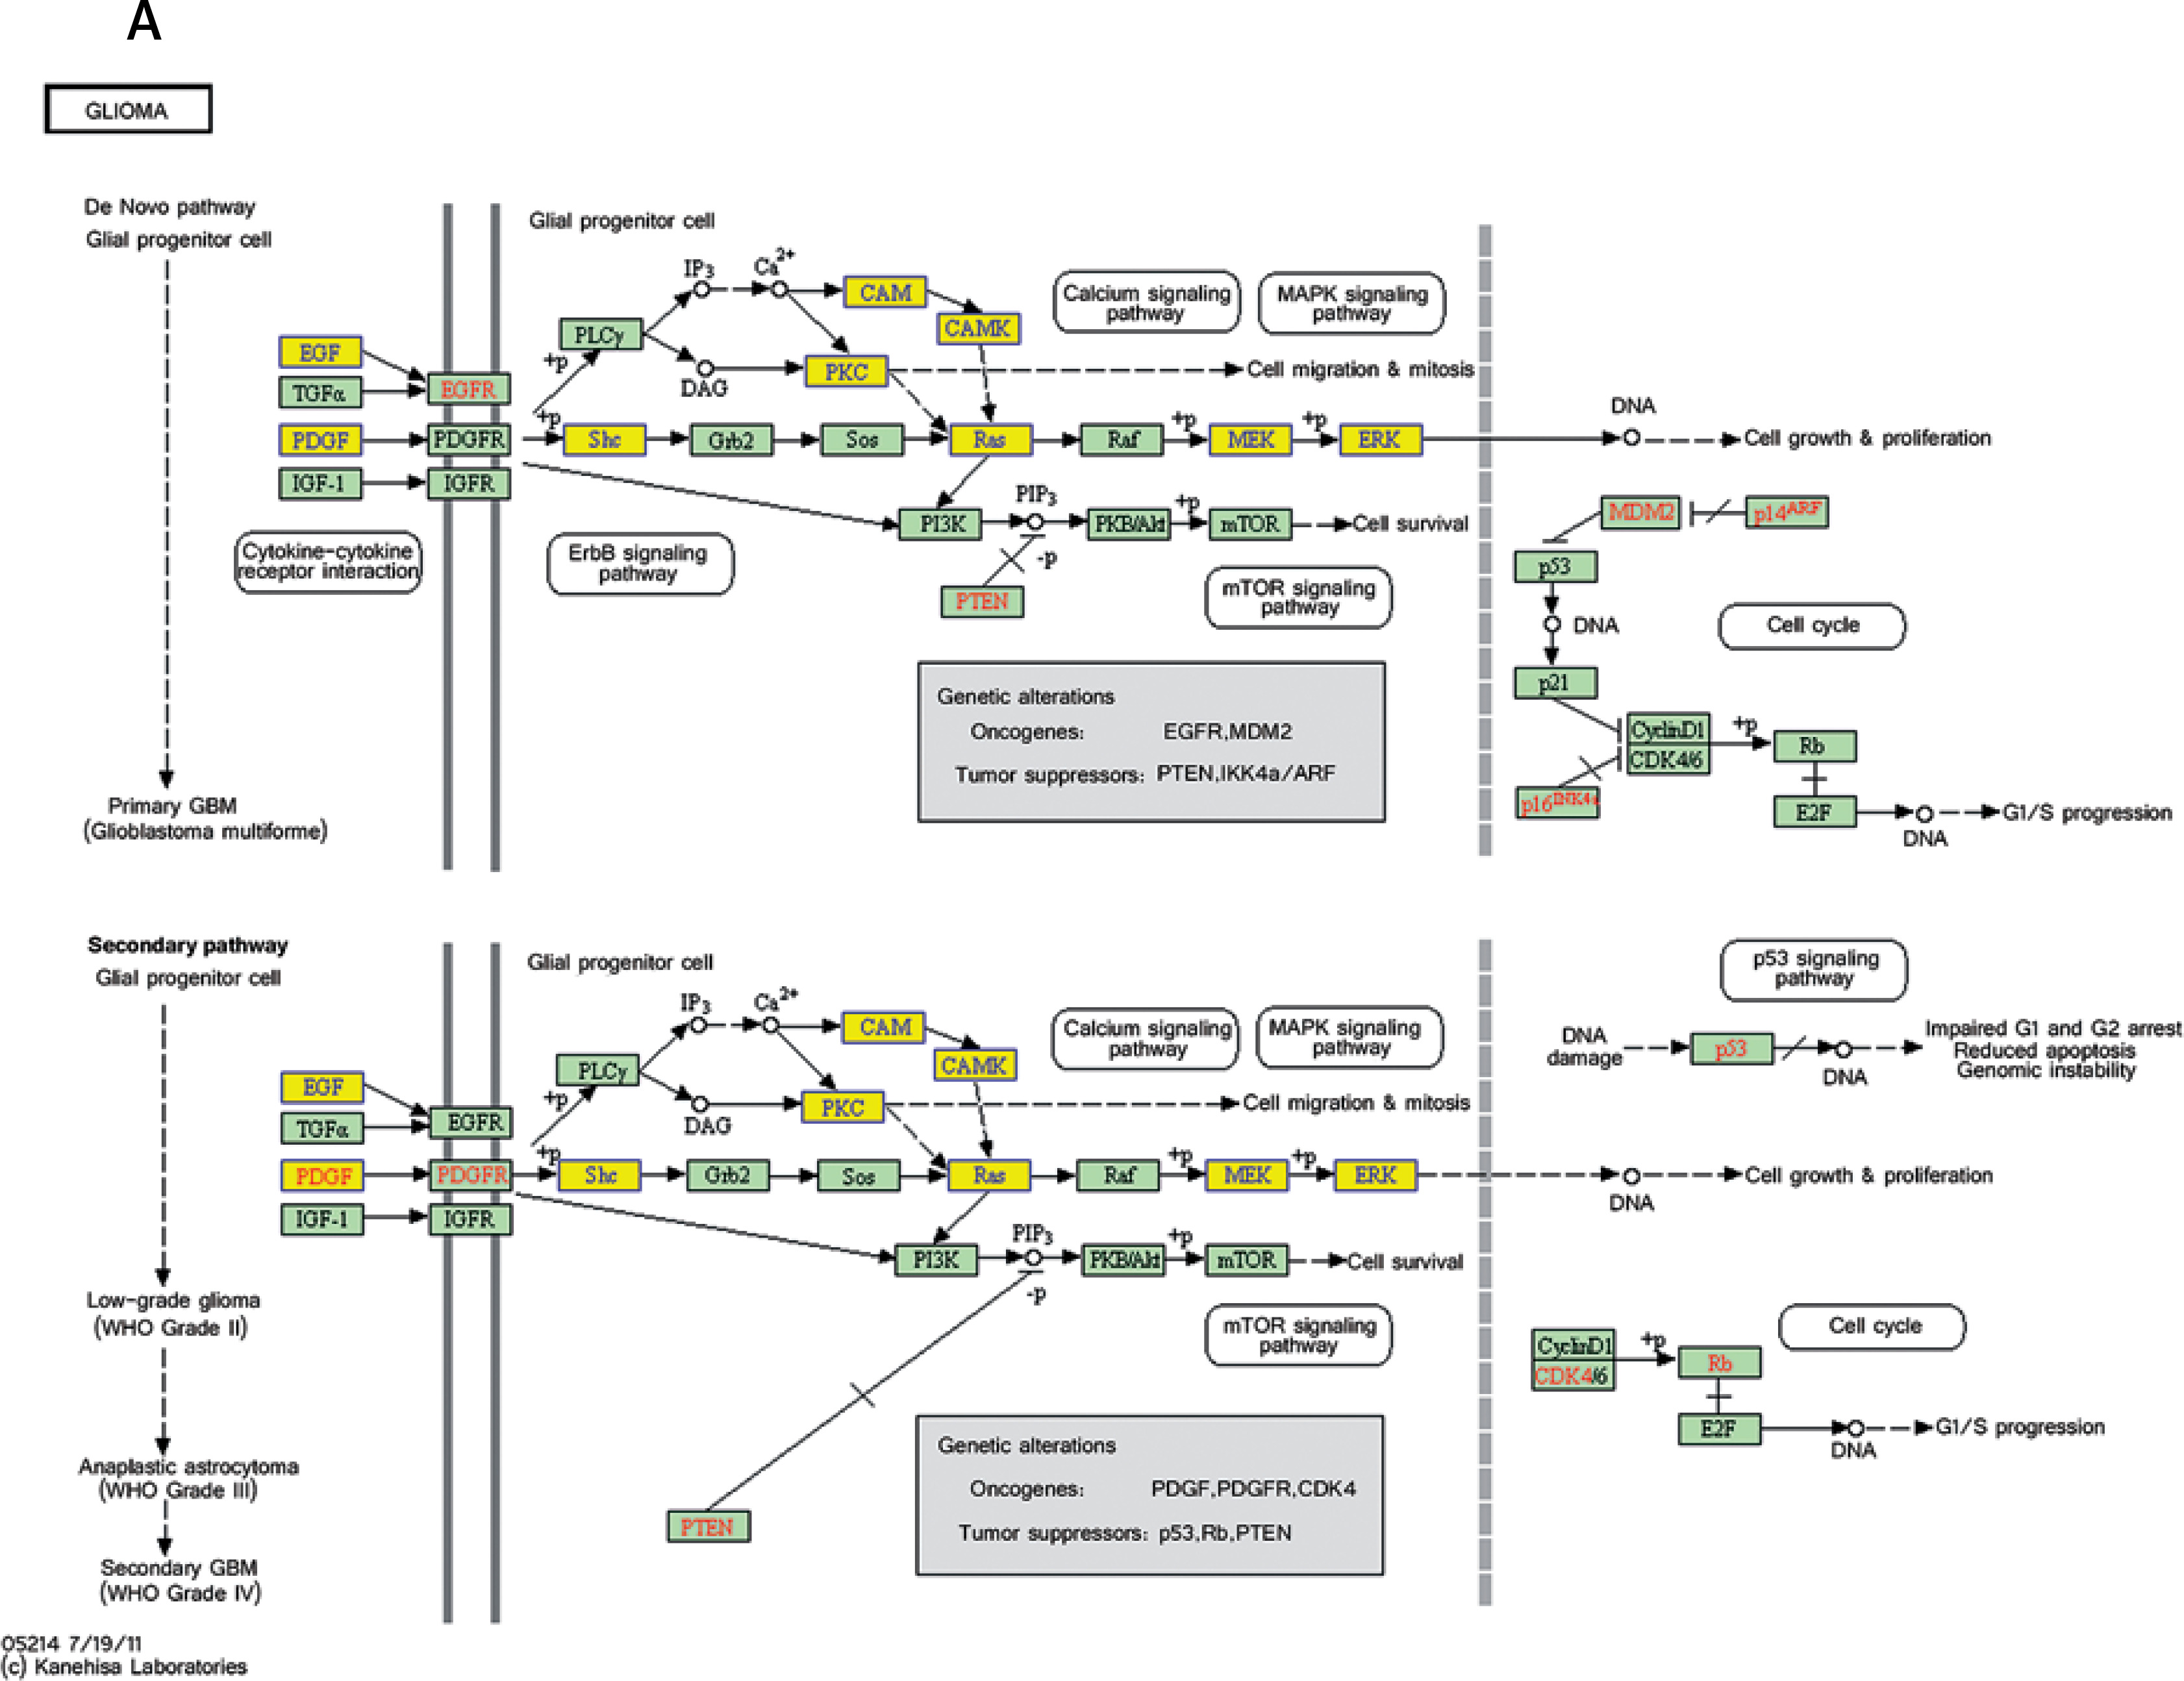
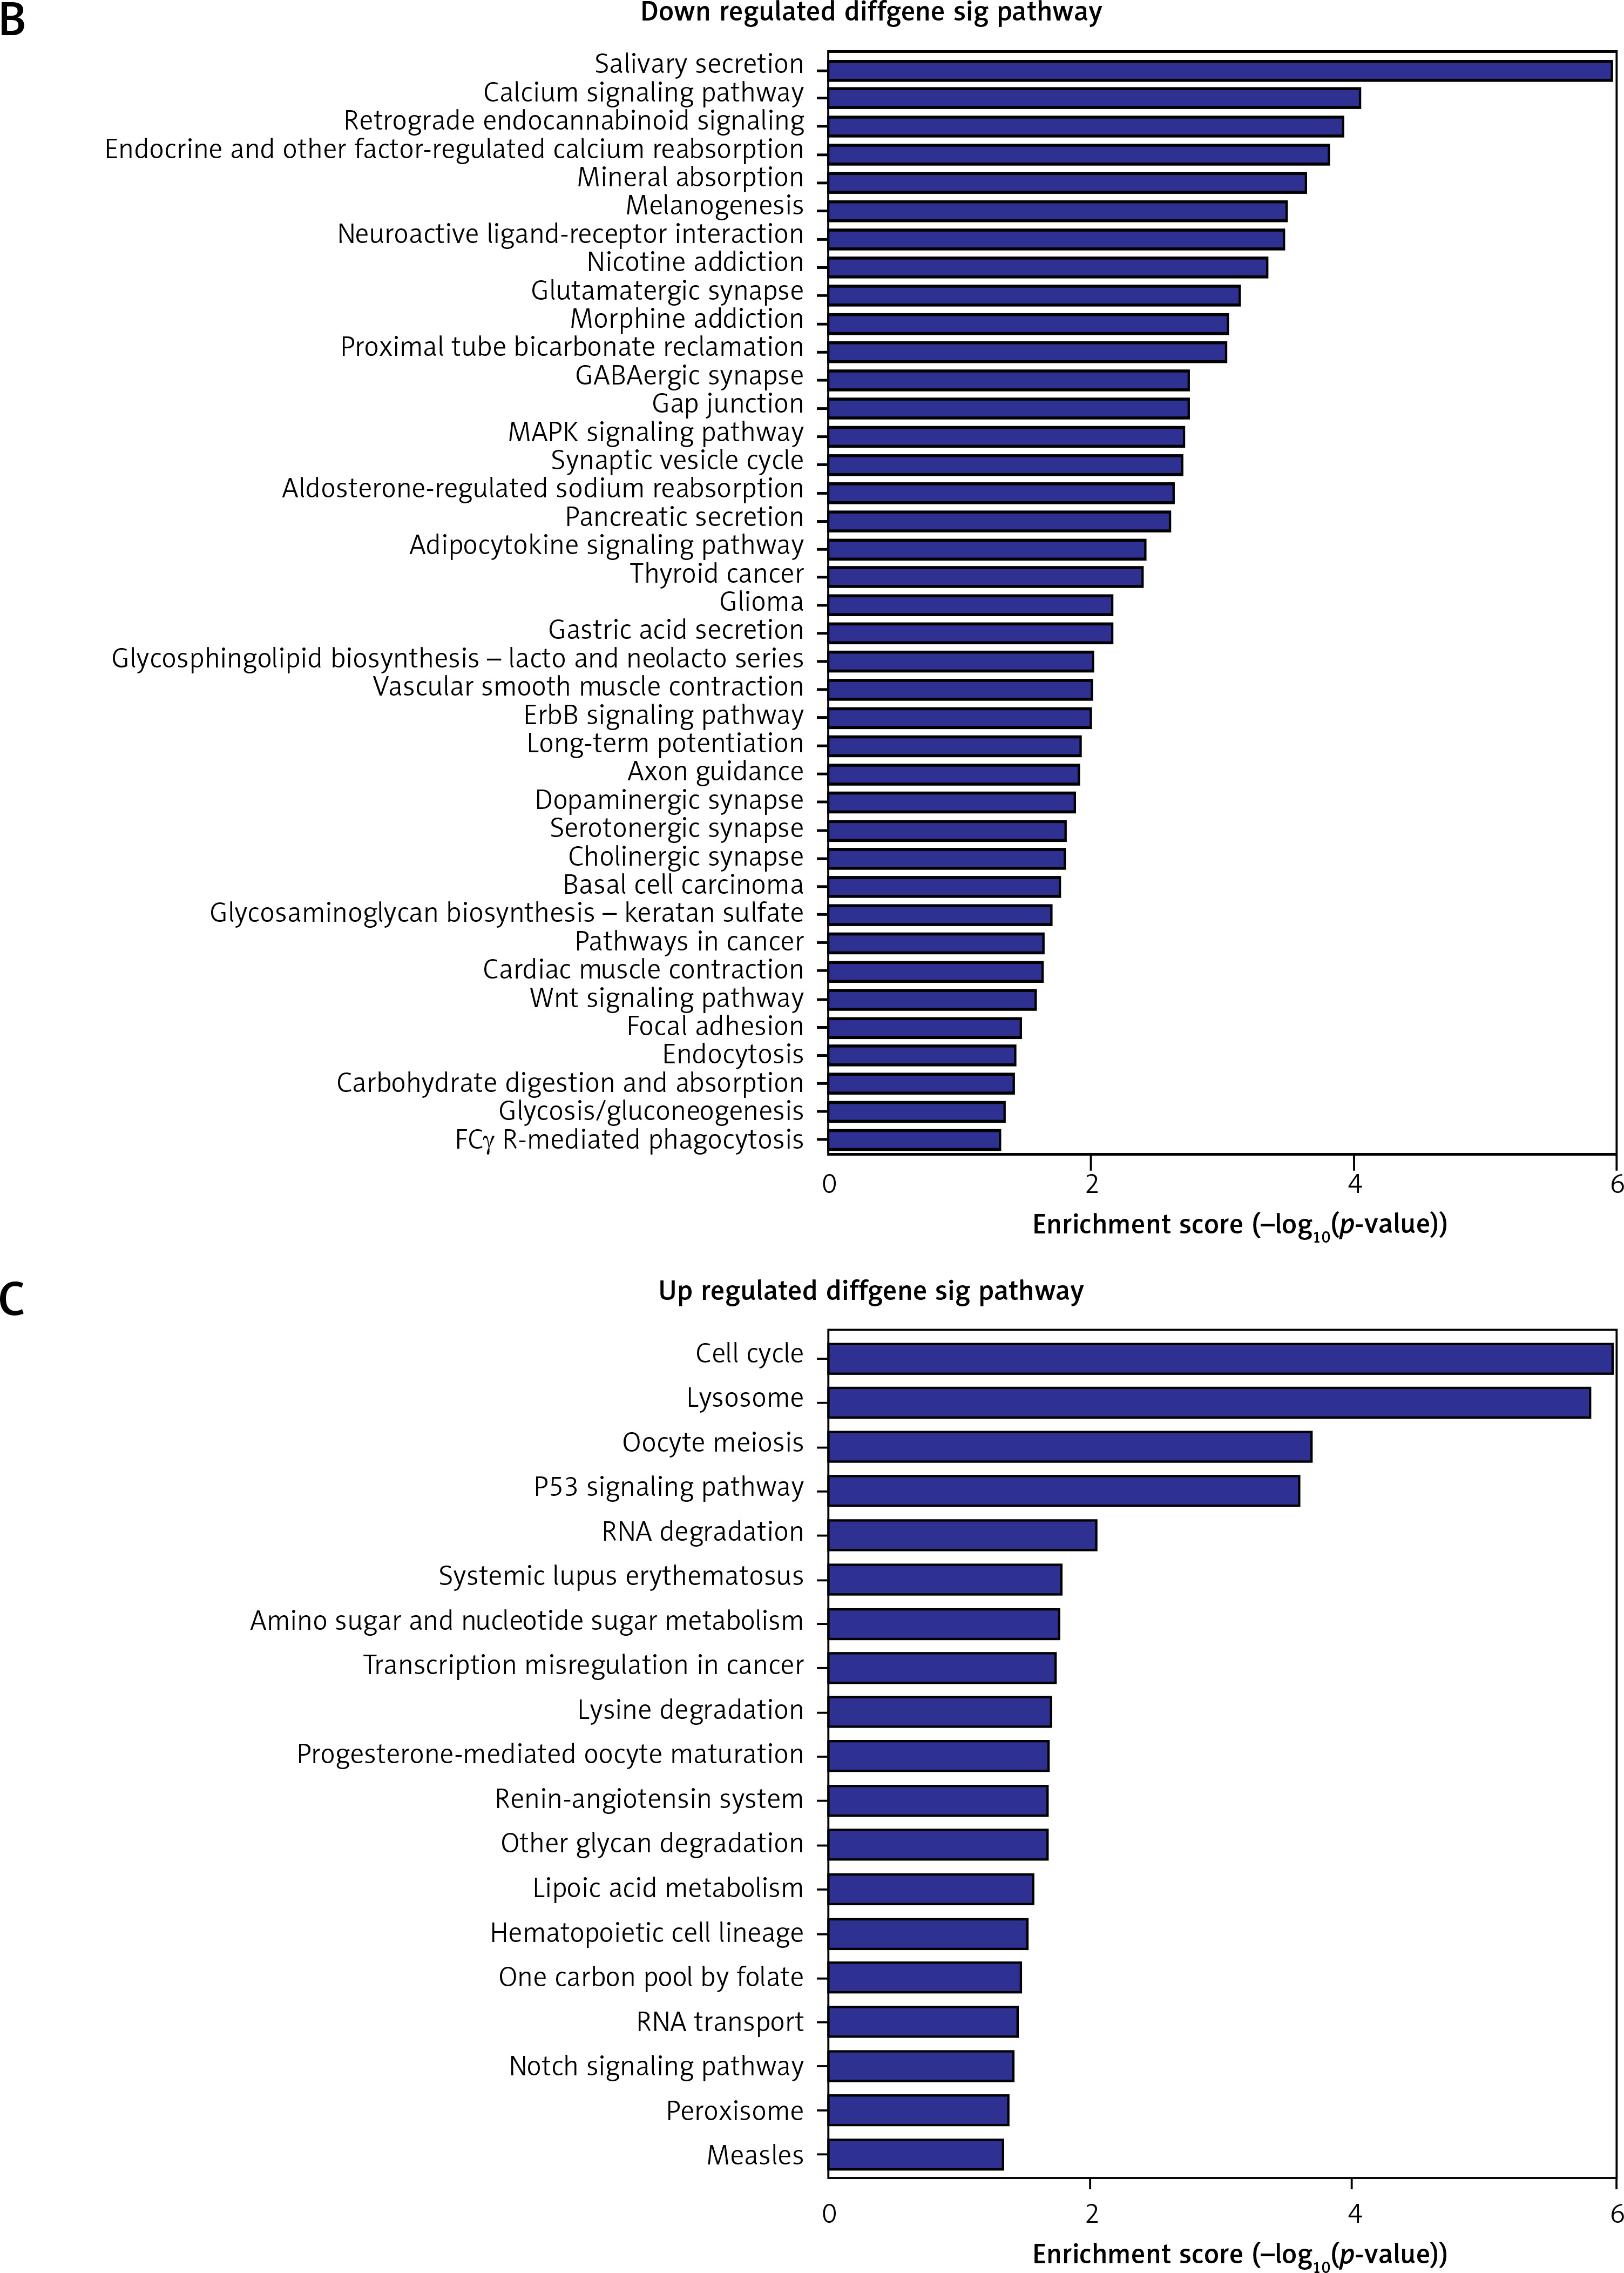
Pathway analysis was performed to identify the major signaling pathways activated in tumor cells. We identified 19 pathways that were associated with aberrantly up-regulated transcripts; the most highly enriched pathway was Cell cycle – Homo sapiens (human) consisting of 34 differentially expressed target genes. In contrast, 39 pathways were associated with down-regulated transcripts; the most highly enriched pathway in this group was Salivary secretion – Homo sapiens (human) consisting of 21 target genes (recommended p-value cut-off = 0.05). Based on these analyses, we can also conclude that the “GLIOMA” signaling pathway (KEGG Pathway ID: hsa05214) was clearly involved in glioma development (Figure 2).
Figure 2
Pathway analysis of aberrantly expressed transcripts in gliomas. A – Key genes belonging to the “GLIOMA” signaling pathway (KEGG: hsa05214), including PDGF, SHC, MDM2, and EGFR, also exhibit close relationships with lncRNAs. B – Pathway-associated down-regulated mRNAs are provided. C – Pathway-associated up-regulated mRNAs are provided
Establishing gene co-expression networks
We established lncRNA-mRNA co-expression networks to further investigate the connection between these two types of molecules. Only lncRNAs and mRNAs that were at least 5-fold differentially expressed between tumor and normal tissue were selected for construction of the co-expression network (Figure 3). Co-expression networks were constructed based on the expression values of differentially expressed lncRNAs and mRNAs in each sample. Since gene expression in tumors reflected the regulatory relationships among genes, the co-expression networks of differentially expressed lncRNAs and mRNAs were constructed based on tumor-specific conditions.
Figure 3
LncRNA-mRNA co-expression network: nodes with red cycle represent lncRNAs, nodes without cycle represent mRNAs, straight lines represent interactions between genes, purple represents increased expression, and blue represents decreased expression. The size of the node represents the degree; the higher the degree, the more genes interact with the particular node in the network
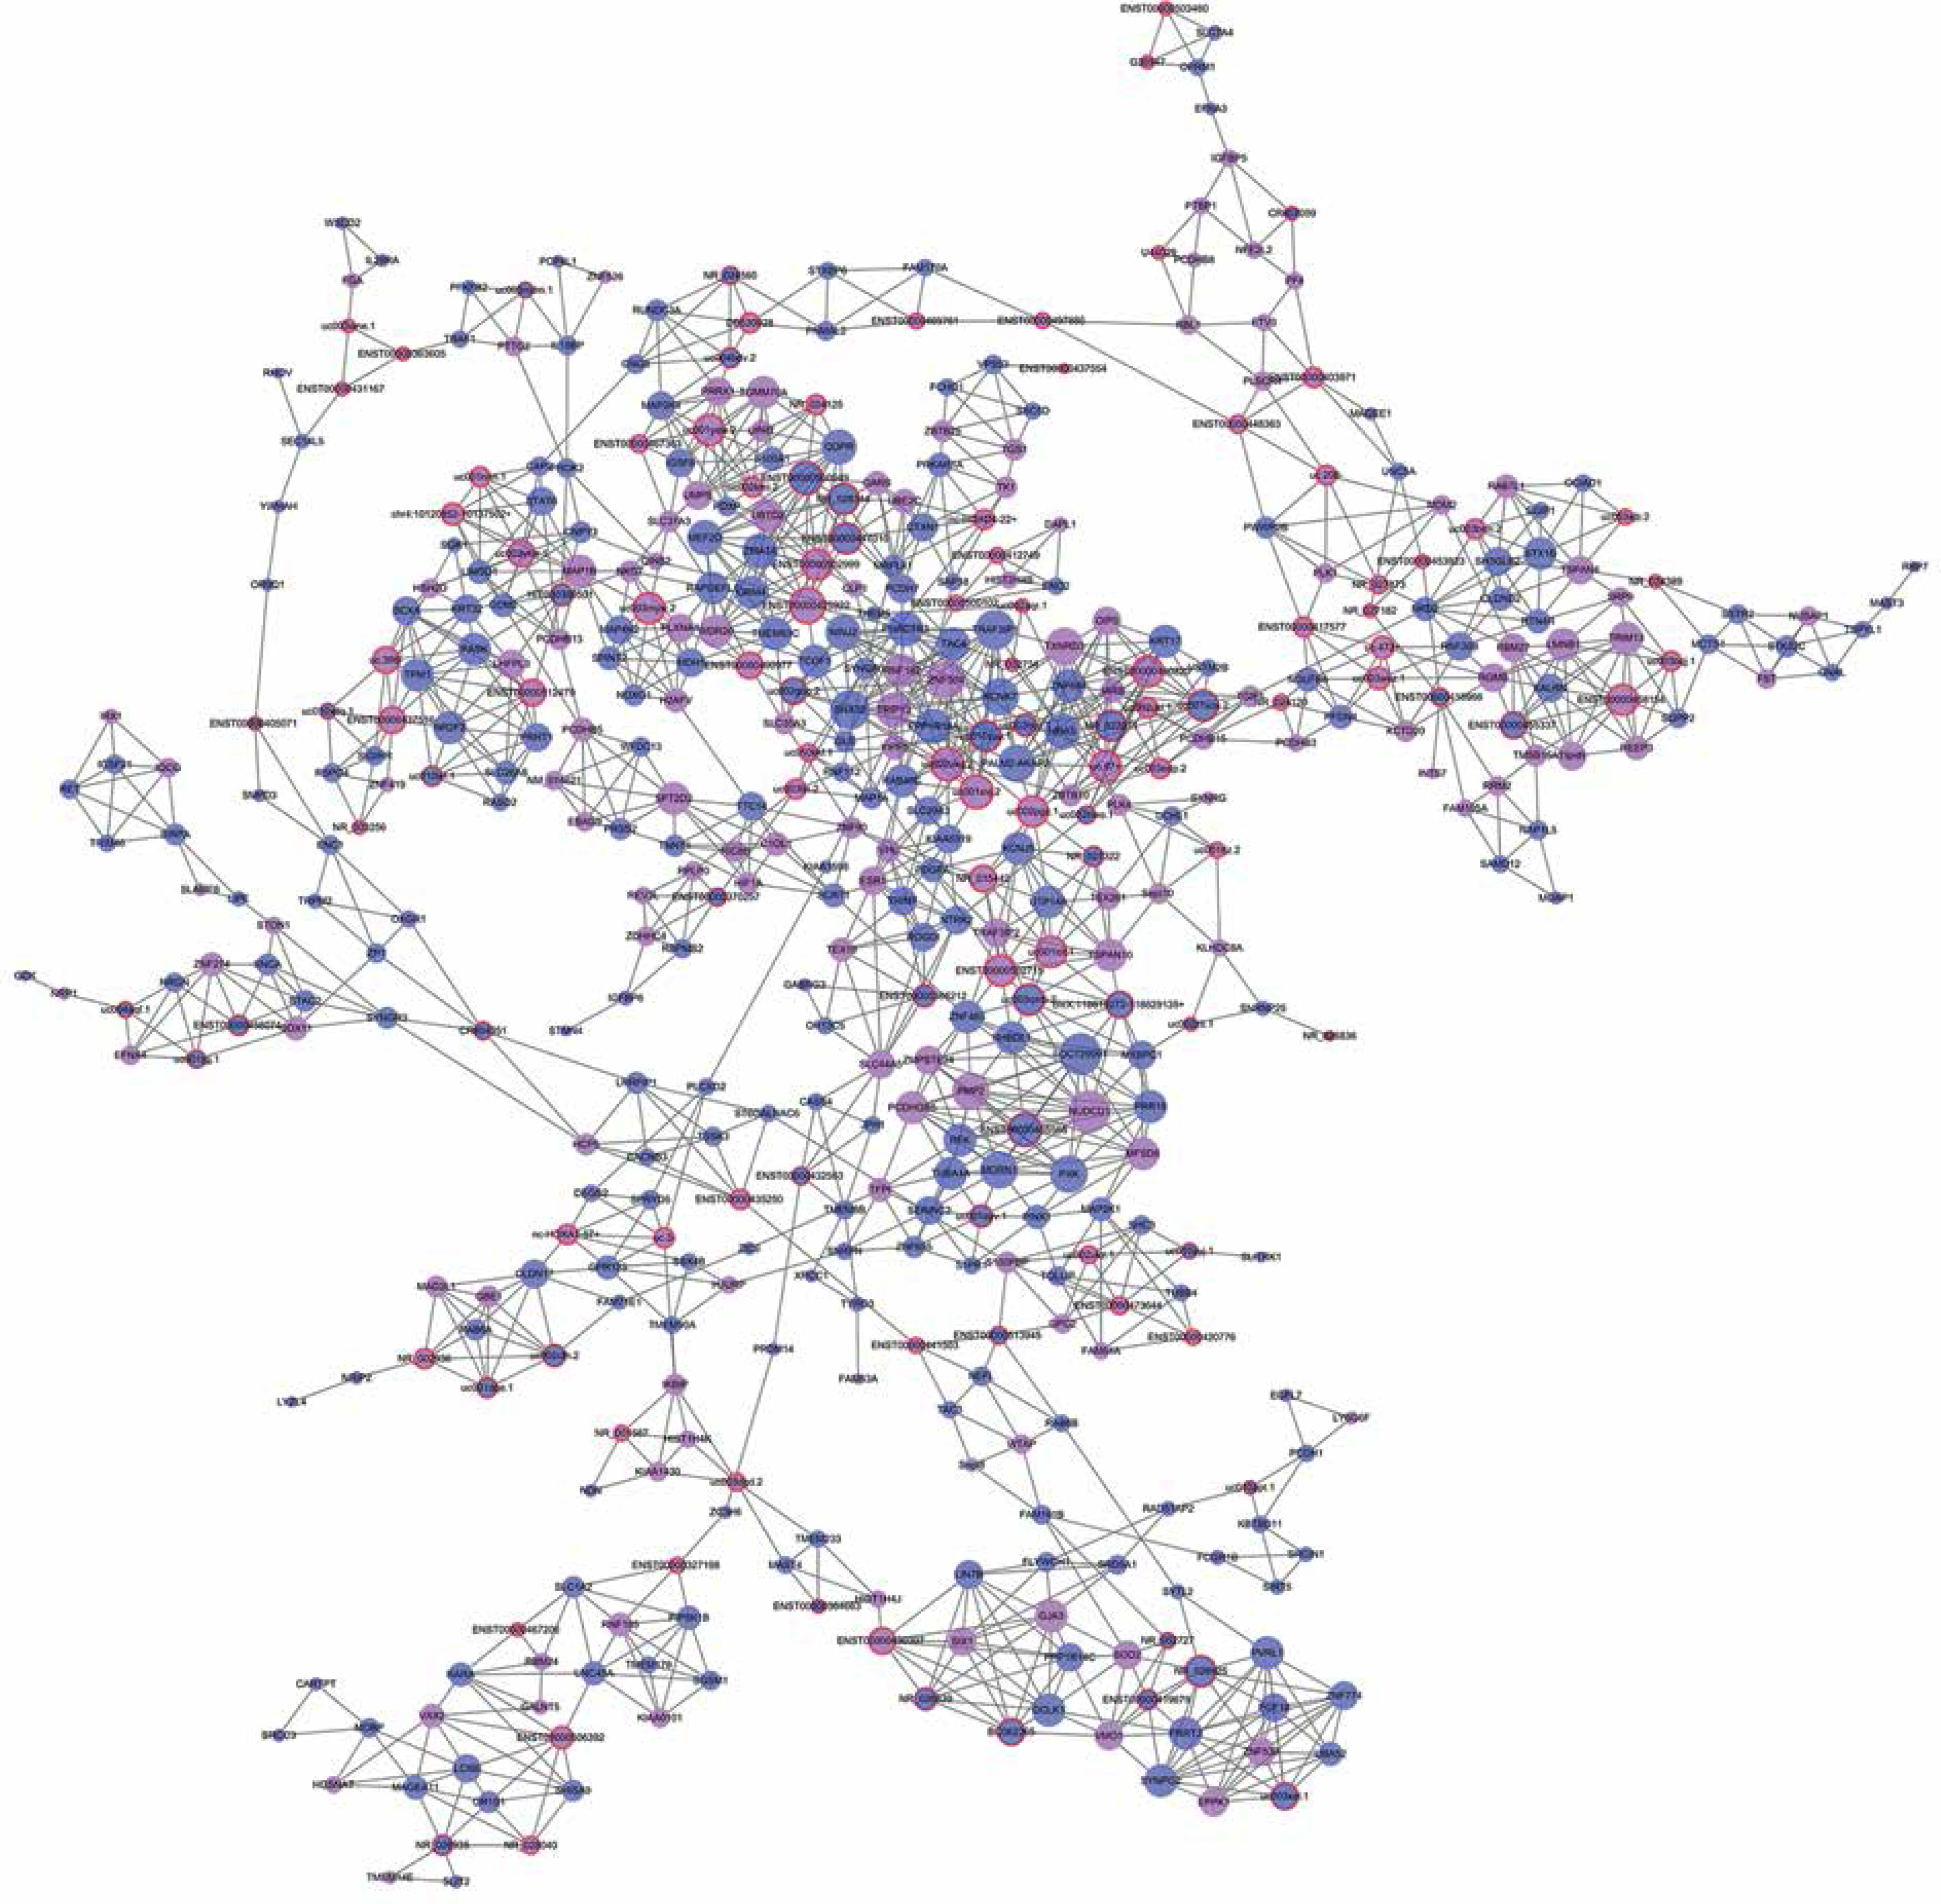
The network property of each node was analyzed based on the co-expression network. The degree of each gene in the network was used to predict mRNA/lncRNA interaction. A list of mRNAs and lncRNAs with the highest degrees is provided in Table III.
Table III
Degree was used to assess interactions in the lncRNA/mRNA network. This table is a collection of a series of key lncRNA/mRNAs
Using the mRNA/lncRNA network, we identified 119 lncRNAs and 335 mRNAs showing some degree of interaction in glioma (correlation = 0.99, p = 0.007). Of these, LOC729991 and NUDCD1 mRNAs had the highest degree value. ENST00000425922 and ENST00000455568 lncRNAs were the most extensively connected with other mRNAs and lncRNAs in the network. Additionally, key genes of the “GLIOMA” signaling pathway, including SHC3, PDGFA, and MDM2, all had high degree scores.
RT-qPCR verification
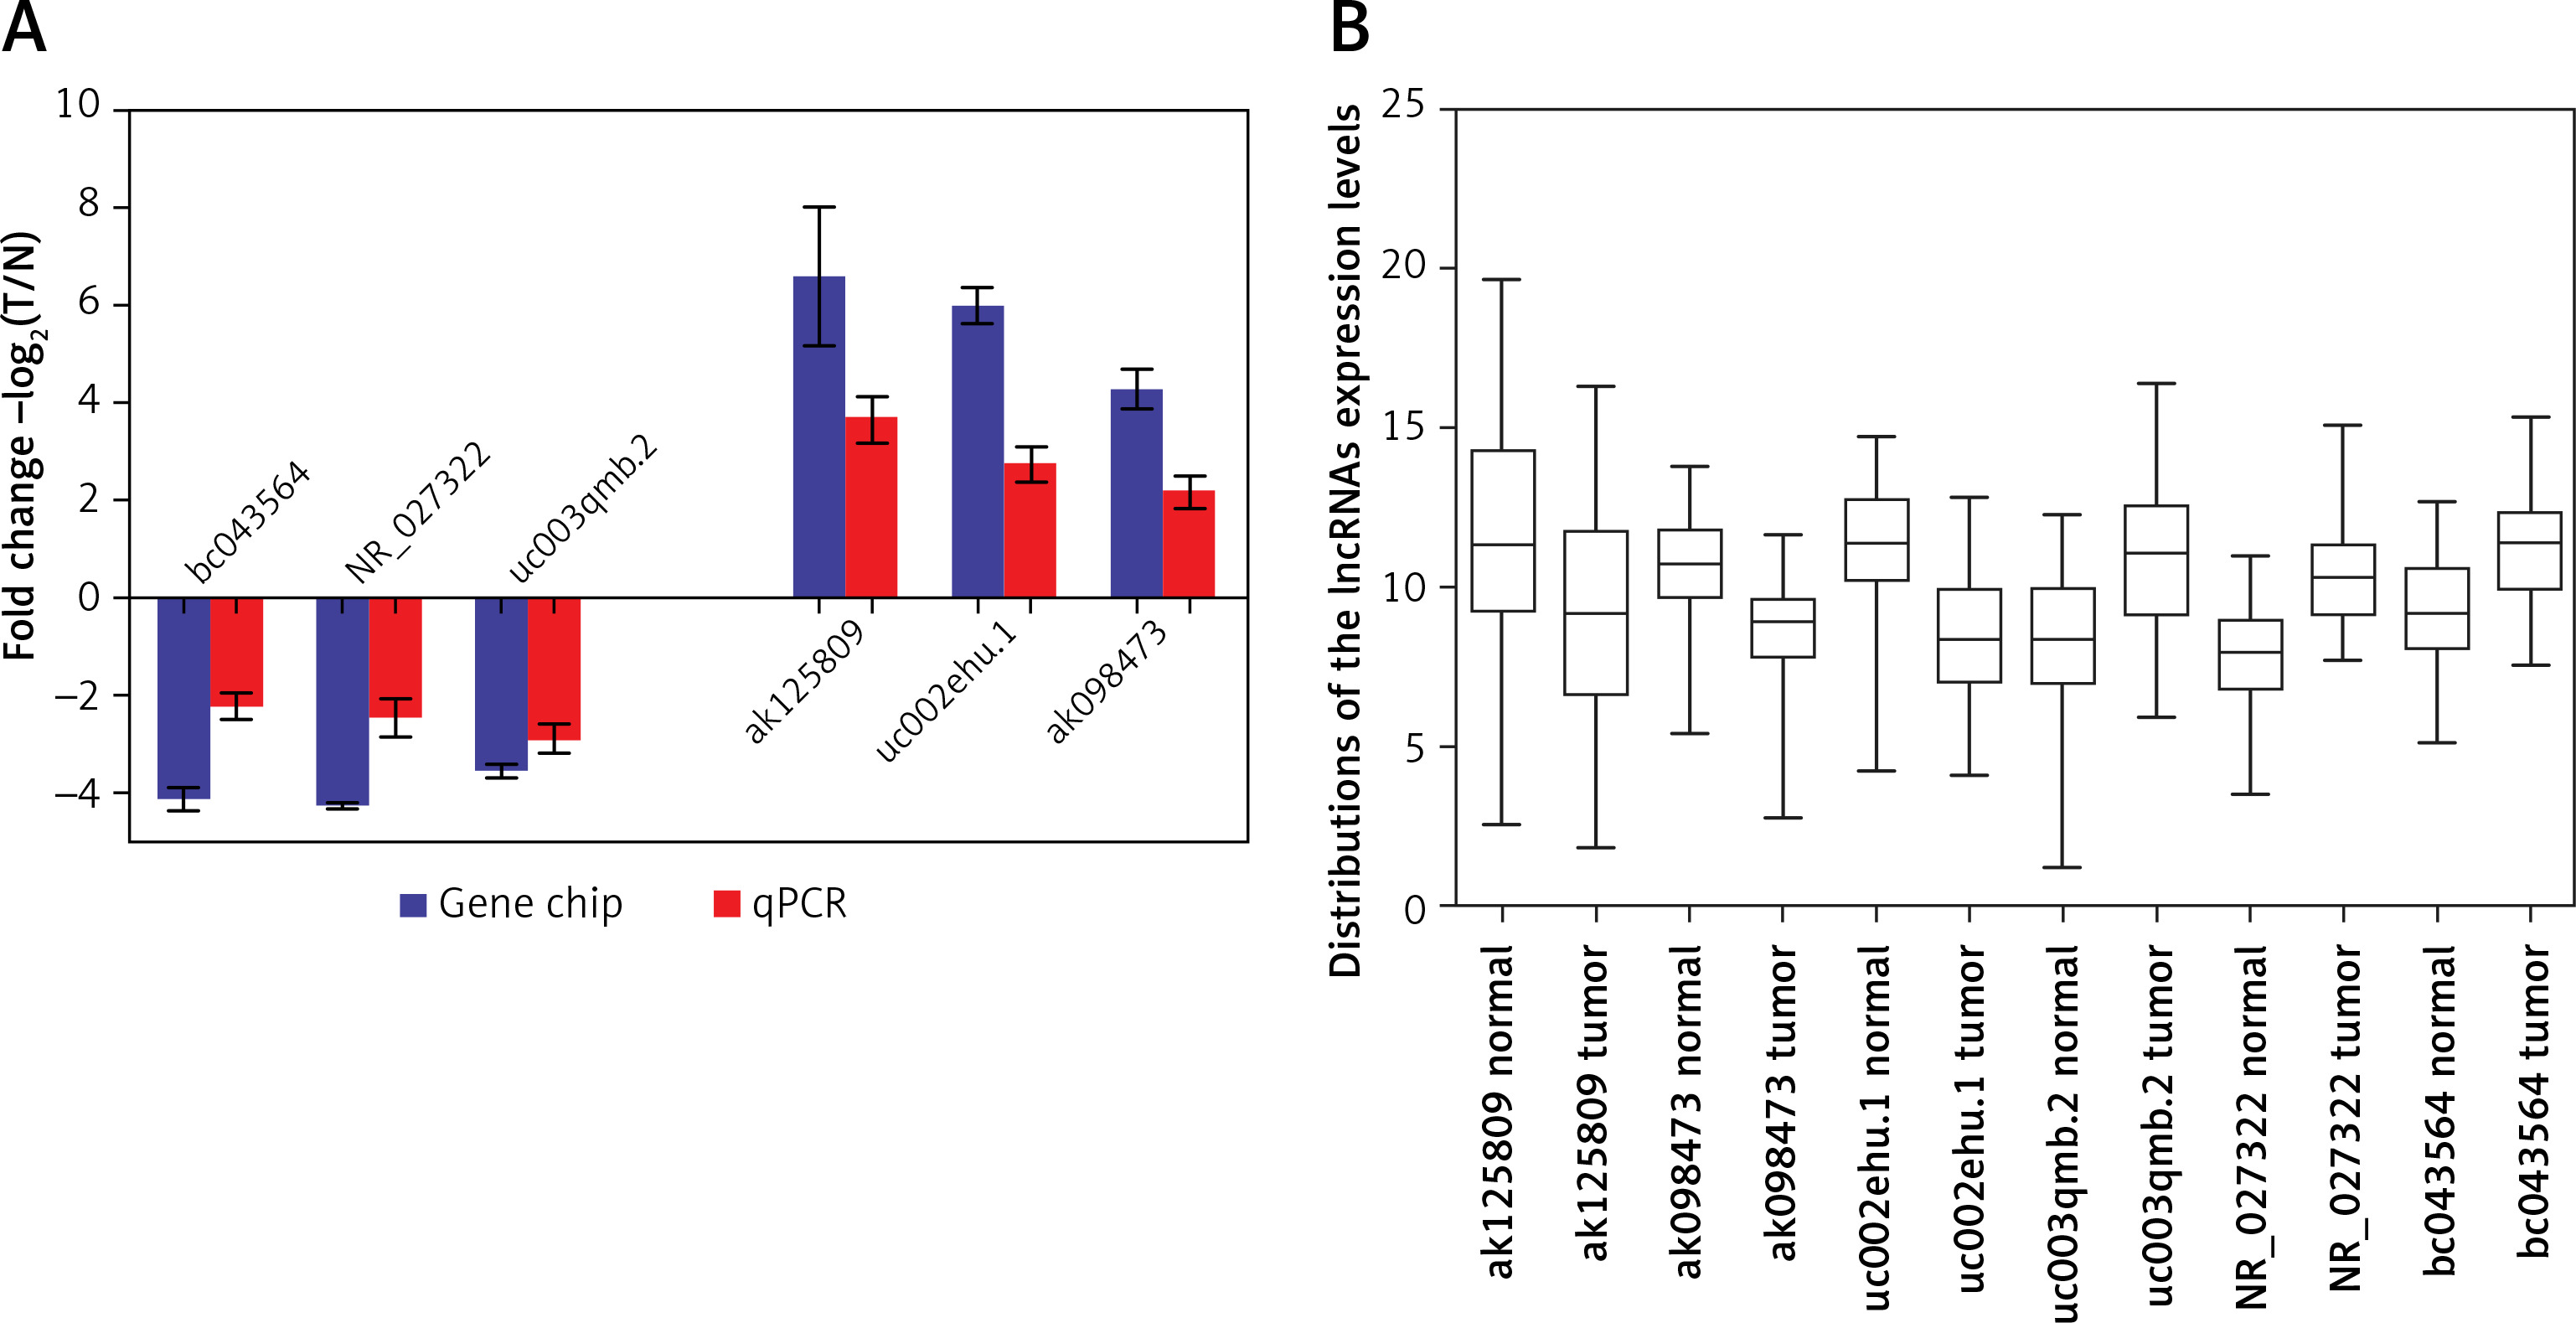
lncRNAs that were differentially expressed in all three tumor groups and had fold changes > 10 were arranged in descending order based on normalized intensity. The top six lncRNAs in this group (ak125809, ak098473, uc002ehu.1, bc043564, NR_027322, and uc003qmb.2) were validated by qPCR. We found that lncRNAs ak125809, ak098473, and uc002ehu.1 were up-regulated in over 90% of the 40 glioma cases. In contrast, lncRNAs bc043564, NR_027322, and uc003qmb.2 were down-regulated in tumor tissue compared to normal. These data are consistent with the microarray results (p = 0.03) (Figure 4).
Figure 4
Comparison of microarray data and qPCR results. A – qPCR was used to verify expression of lncRNAs ak125809, ak098473, uc002ehu.1, bc043564, NR_027322, and uc003qmb.2. B – Distribution of lncRNA expression levels were provided. All six lncRNAs of ak125809, ak098473, uc002ehu.1, bc043564, NR_027322, and uc- 003qmb.2 were validated by qPCR analysis in the 40 paired glioma and peritumoral tissues. Each histogram represents the average fold change (T/N) with logarithmic conversion. Error bars are indicative of standard deviation. Distribution of lncRNA expression
Discussion
The genetic basis of glioma development has been extensively studied, and the molecular pathways that become deregulated in the disease have also been examined [27, 28]. Aberrant expression of both mRNA transcripts and microRNAs have been shown to be involved in glioma development and progression [29, 30]. One study performed miRNA expression profiling and found that differential expression of miRNAs in malignant astrocytomas may influence tumor proliferation and response to chemotherapy [31]. While a role for both mRNAs and miRNAs in glioma has been well studied, a role for lncRNAs in the disease has yet to be established. Identification of lncRNAs that are important for disease progression could result in new options for glioma prognosis and treatment [16, 32].
In this study, we performed lncRNA expression profiling using microarray technology. We identified thousands of lncRNAs that were differentially expressed in human glioma samples compared to peritumoral normal tissue. We selected 6 lncRNAs (ak125809, ak098473, uc002ehu.1, bc043564, NR_027322, and uc003qmb.2) with fold changes greater than 10 and with relatively high normalized intensities for qPCR validation in 40 pairs of gliomas and their surrounding tissue. We hypothesize that these lncRNAs may be potential biomarkers in glioma. Additionally, the lncRNA HULC may be useful as a biomarker capable of being detected in plasma [12].
One of the 6 lncRNAs that was extensively examined in this study, ak125809, was upregulated in tumor tissue. ak125809 is located on chr7 and has a length of 3854 nt. It is the natural antisense transcript of the gene encoding vasoactive intestinal peptide receptor 2 (VIPR2), also known as PACAP-R-3. VIPR2-mediated signal transduction results in glial cell proliferation, a process that is closely related to glioma formation and repair following neurological damage. Ak125809 may have an indirect relation to glioma proliferation due to its regulation of VIPR2 expression [33]. The lncRNA BC043564, located on chr1 with a length of 2022 nt, is the exon sense-overlapping transcript of the Kcn2a gene, which encodes one subtype of proliferation-related voltage-gated potassium ion channel [34]. The lncRNA ak098473, located on chrX with a length of 1658 nt, is the natural antisense transcript of the gene encoding synaptotagmin-like protein 4 (SYTL4). The lncRNA uc002ehu.1 is located on chr17 and has a length of 643 nt. NR_027322 is located on chr10 with a length of 2427 nt. The biological function of the latter three lncRNAs is currently unknown.
We identified several oncogene-related lncRNAs in our microarray analysis. BC007968 was found to be significantly upregulated; it is a natural antisense transcript of cyclin-dependent kinase 4 (CDK4), a Ser/Thr protein kinase. Expression of CDK4 and its associated proteins, including D-type cyclins, p16 (INK4a), and Rb, has been shown to be important for glioma tumorigenesis; moreover, disruption of the p16INK4a-Cdk4-Rb pathway has been shown to be useful for glioma therapy [35, 36]. BC007968 is very likely to interfere with the p16INK4a-Cdk4-Rb pathway as a CDK4 antisense transcript and would be predicted to regulate glioma formation. The lncRNA BC008580 was also upregulated in glioma. This is an exon sense-overlapping transcript of glial cell line-derived neurotrophic factor (GDNF). Recent work has shown that GDNF is overexpressed in glioma, where it likely contributes to increased proliferation and metastasis [37, 38]. It is possible that the lncRNA BC008580 contributes to glioma development via regulation of GDNF. Taken together, our data support a role for lncRNAs in glioma tumorigenesis.
Interaction or co-expression networks can be generated based on multiple assays, including co-immunoprecipitation experiments [39] and gene function analyses [40]. We generated an lncRNA-mRNA expression network based on data from our microarray expression profiling. We determined Pearson correlation coefficients and selected highly correlated lncRNA-mRNA pairs to establish the network. The network indicated which lncRNAs might be responsible for regulation of specific mRNAs. While mRNAs seemed to directly influence tumorigenesis and disease malignancy, lncRNAs tended to have a more indirect effect, possibly via regulation of downstream mRNAs. Degree scores were assigned to molecules in the network, and those with the highest degree scores likely displayed the greatest extent of interaction. Through these analyses, we identified potential lncRNA-mRNA interactions. A better understanding of these interactions will likely help elucidate some key roles for lncRNAs in glioma.
We performed KEGG annotation of all mRNAs differentially expressed between glioma and normal tissue. Several pathways, including MAPK signaling, the Wnt pathway, p53 signaling, and the glioma pathway, were all found to be deregulated in the disease. Most of these pathways have been previously shown to influence glioma tumorigenesis and response to chemotherapy. For example, one study showed that down-regulation of Wnt2 and beta-catenin inhibited proliferation of malignant glioma [41]. Additionally, work by Johannessen et al. showed that activation of p53 by the MDM2 antagonist nutlin-3 improved sensitivity to chemotherapy treatment [42]. Of all pathways identified by KEGG analysis, the “Glioma” pathway (KEGG Pathway ID: hsa05214) particularly stood out [43–45]. Several genes belonging to this pathway, including PDGF, SHC, MDM2, and EGFR, have previously been shown to be important for glioma development [46, 47]. Many of these genes were also found to be differentially expressed in this study. Additionally, our lncRNA-mRNA co-expression network analysis showed that several of these genes correlate with particular lncRNAs. For example, shc3 correlated with uc002ukz.1, enst00000473644, and uc010ayj.1 (correlation = 1, p < 0.01). Pdgfa correlated with enst00000502715 and NR_022011. Mdm2 correlated with NR_027873 and uc.208- (correlation = 1, p < 0.01). We hypothesize that many of these lncRNAs regulate glioma formation by interfering with the expression of key factors in the “Glioma” pathway. We plan to test this hypothesis in future studies.
In this study, we identified differentially expressed lncRNAs in human glioma cases by both microarray profiling and qPCR validation. Importantly, data from both microarray and qPCR were consistent. We established an lncRNA-mRNA co-expression network to better understand the mechanisms of lncRNA action in the disease. We found lncRNA that may be associated with the pathogenesis of glioma, as a phenomenon, but the mechanism was not further explored, and whether it can be detected in blood and body fluids and become a biomarker is yet to be studied. The project team will further study this series of issues later. While this work provides a solid foundation, more research must be done to clearly define the molecular roles of lncRNAs in glioma development.