Introduction
Psoriatic arthritis (PsA) is a chronic inflammatory disease developing in about 30% of patients with psoriasis [1]. Numerous previous studies have demonstrated that patients with psoriasis have higher rates of comorbidities compared to the general population [2–4]. The occurrence of hypertension, obesity, hyperlipidemia, type 2 diabetes mellitus, rheumatoid arthritis, ankylosing spondylitis and at least one cardiovascular event was reported more often in PsA patients than in psoriatic patients without arthritis [4, 5]. Cardiovascular and cerebrovascular morbidity are increased by 43% and 22%, respectively, in patients with PsA compared with the general population [6]. The exact explanation for these findings remains unclear. It has been suggested that chronic inflammation, release of proinflammatory cytokines and consequent endothelial damage may be the possible cause of this association [7, 8].
Several studies have indicated lipid disturbances in psoriatic patients, showing higher serum concentrations of triglycerides, cholesterol, and low-density lipoprotein (LDL) and lower concentration of high-density lipoprotein (HDL) [9, 10]. PsA patients had been identified to have elevated HDL cholesterol and apolipoprotein A1 levels, lower total cholesterol and LDL cholesterol levels and a decreased total cholesterol to HDL cholesterol ratio [11]. In our previous study, we also demonstrated sphingolipid disturbances in PsA. We found increased levels of circulating ceramides (CER) in patients with psoriatic arthritis compared to psoriasis without arthritis [12].
Circulating fatty acids (FA) are the main source of energy in our body and serve as substrates for cell membrane formation. They also play an important role as signaling molecules in inflammatory and metabolic pathways [13]. Moreover, FA metabolism affects the Th17 cell function and plays an important role in psoriasis pathogenesis [14]. Circulating plasma FA may also directly contribute to articular inflammation and inflammatory joint diseases [15]. Depending on the length and saturation status FA may act as pro- or anti-inflammatory mediators [16]. Brenner et al. [17] reported reduced concentration of linoleic acid and raised levels of myristic and palmitoleic acids in psoriatic patients compared to healthy controls. The authors believed that the described changes were due to a selective loss via the scales or due to malabsorption. Another study demonstrated increased serum levels of palmitic, stearic, arachidic, and docosadienoic acids, while the levels of linoleic and arachidonic acids were decreased in psoriatic patients [18]. However, the function of lipid mediators in psoriasis and PsA pathogenesis remains unclear.
Therefore, the aim of the present study was to evaluate serum total FA concentrations and composition in patients with or without psoriatic arthritis related to healthy control individuals. We additionally assessed correlations between serum FA and inflammatory markers, serum lipid profile and vitamin D concentrations in the PsA group.
Material and methods
Fifty-four patients (12 females and 42 males) of the Department of Dermatology with active plaque-type psoriasis, and 32 healthy controls were included in the study. Psoriatic patients were divided into two groups: psoriasis of the skin with no joint involvement (n = 40) and PsA (n = 14) – patients with skin and joint involvement. The severity of psoriasis was estimated using the Psoriasis Area and Severity Index (PASI) [19]. Patients with other types of psoriasis (guttate, erythrodermic and pustular psoriasis), those with concomitant obesity, hypertension, type 2 diabetes or reported systemic treatment of psoriasis in the preceding 2 months, those who used any systemic treatment, vitamin D or other supplements that might influence FA or vitamin D status were excluded from the study. Patients and healthy individuals had not been on diet restriction prior to the study. All the subjects were Caucasian.
The routine analysis of laboratory parameters including C-reactive protein (CRP), white blood cells (WBC), serum fasting blood glucose, total cholesterol, HDL, LDL and triglycerides (TG) was performed in the laboratory of the University Hospital Center. Clinical and laboratory characteristics of examined patients are summarized in Table I. All patients and healthy individuals gave their written informed consent before enrollment. The study protocol was approved by the local bioethical committee. All procedures performed were in accordance with the ethical standards of the Bioethical Committee of Medical University of Białystok and the 1964 Helsinki Declaration and its later amendments or comparable ethical standards.
Table I
Clinical and laboratory characteristics of patients with psoriasis and psoriatic arthritis. Data are shown as median and quartiles (Q1 first quartile; Q3 third quartile). Significant differences between the groups are shown as: *p < 0.05; **p < 0.01; ***p < 0.001
Peripheral blood samples were collected from the patients (before starting the treatment) and from the control group after overnight fast. After centrifugation, the serum was stored at –80ºC until analyses. We analyzed the total serum FA content and composition according to the method by Glaser et al. [20]. Briefly, 100 μl of serum was incubated in 85°C for 45 min in 1.5 ml of 3 N methanolic HCl containing 2 g/l BHT (2,6-di-tert-butyl-p-cresol, antioxidant). Prior to incubation, 100 μl of an internal standard mixture (heptadecanoic acid, cholesteryl-heptadecanoate, triheptadecanoate, diheptadecanoate and diheptadecanoyl-phosphatidylcholine; 0.2/2/1.5/0.2/2 per weight, 10 μg of C17:0 total, in chloroform/methanol 2 : 1) was added to account for methylation and extraction losses. After cooling to room temperature, fatty acid methyl esters were extracted with 0.5 ml of hexane, 30 s of vortexing and centrifugation (5 min at 3000g). The upper organic phase was transferred to glass vials and 1 μl of sample was analyzed by gas-liquid chromatography using a Hewlett-Packard 5890 Series II gas chromatograph, an Agilent J&W CP-Sil 88 capillary column (50 m × 0.25 mm I.D.) and a flame-ionization detector. Argon was used as a carrier gas. The oven temperature was programmed (starting from 130°C and increasing by 5°C/min up to 220°C and then held at 220°C for 32 min). Fourteen fatty acid species were identified and quantified according to respective retention times of synthetic standards: myristic (14:0), palmitic (16:0), palmitoleic (16:1n-7), stearic (18:0), oleic (18:1n-9), linoleic (18:2n-6), α-linolenic (18:3n-3), arachidic (20:0), arachidonic (20:4n-6), lignoceric (24:0), eicosapentaenoic (20:5n-3), behenic (22:0), docosahexaenoic (22:6n-3) and nervonic (24:1n-9) acids. The FA were grouped into: saturated fatty acids (SFA – myristic acid, palmitic acid, stearic acid, arachidic acid, behenic acid, lignoceric acid) and unsaturated fatty acids (UFA). Next, UFA were additionally divided into MUFA (palmitoleic acid, oleic acid, nervonic acid) and PUFA (n-3 PUFA: α-linolenic acid, eicosapentaenoic acid (EPA), docosahexaenoic acid (DHA) and n-6 PUFA: linoleic acid and arachidonic acid).
Statistical analysis
The data were analyzed using the Statistica 12.0 software. Descriptive statistics were used to demonstrate sociodemographic and biochemistry characteristics of the study groups. The distribution of each continuous variable was examined using the Shapiro-Wilk test. We did not find the normal distribution of the analyzed variables. The data were presented as median and quartiles (first and third quartile). The statistical analyses were performed using Kruskal-Wallis and Mann-Whitney tests. We calculated the Spearman rank correlation coefficients to measure the relationships between the serum FA and metabolic and clinical variables. Differences were considered significant with a p < 0.05.
Results
Table I shows the characteristics of the psoriatic and PsA (31.8%) patients. Patients with PsA in our study were significantly older (p < 0.05) and had skin lesions for a longer time (p < 0.001) than patients with psoriasis.
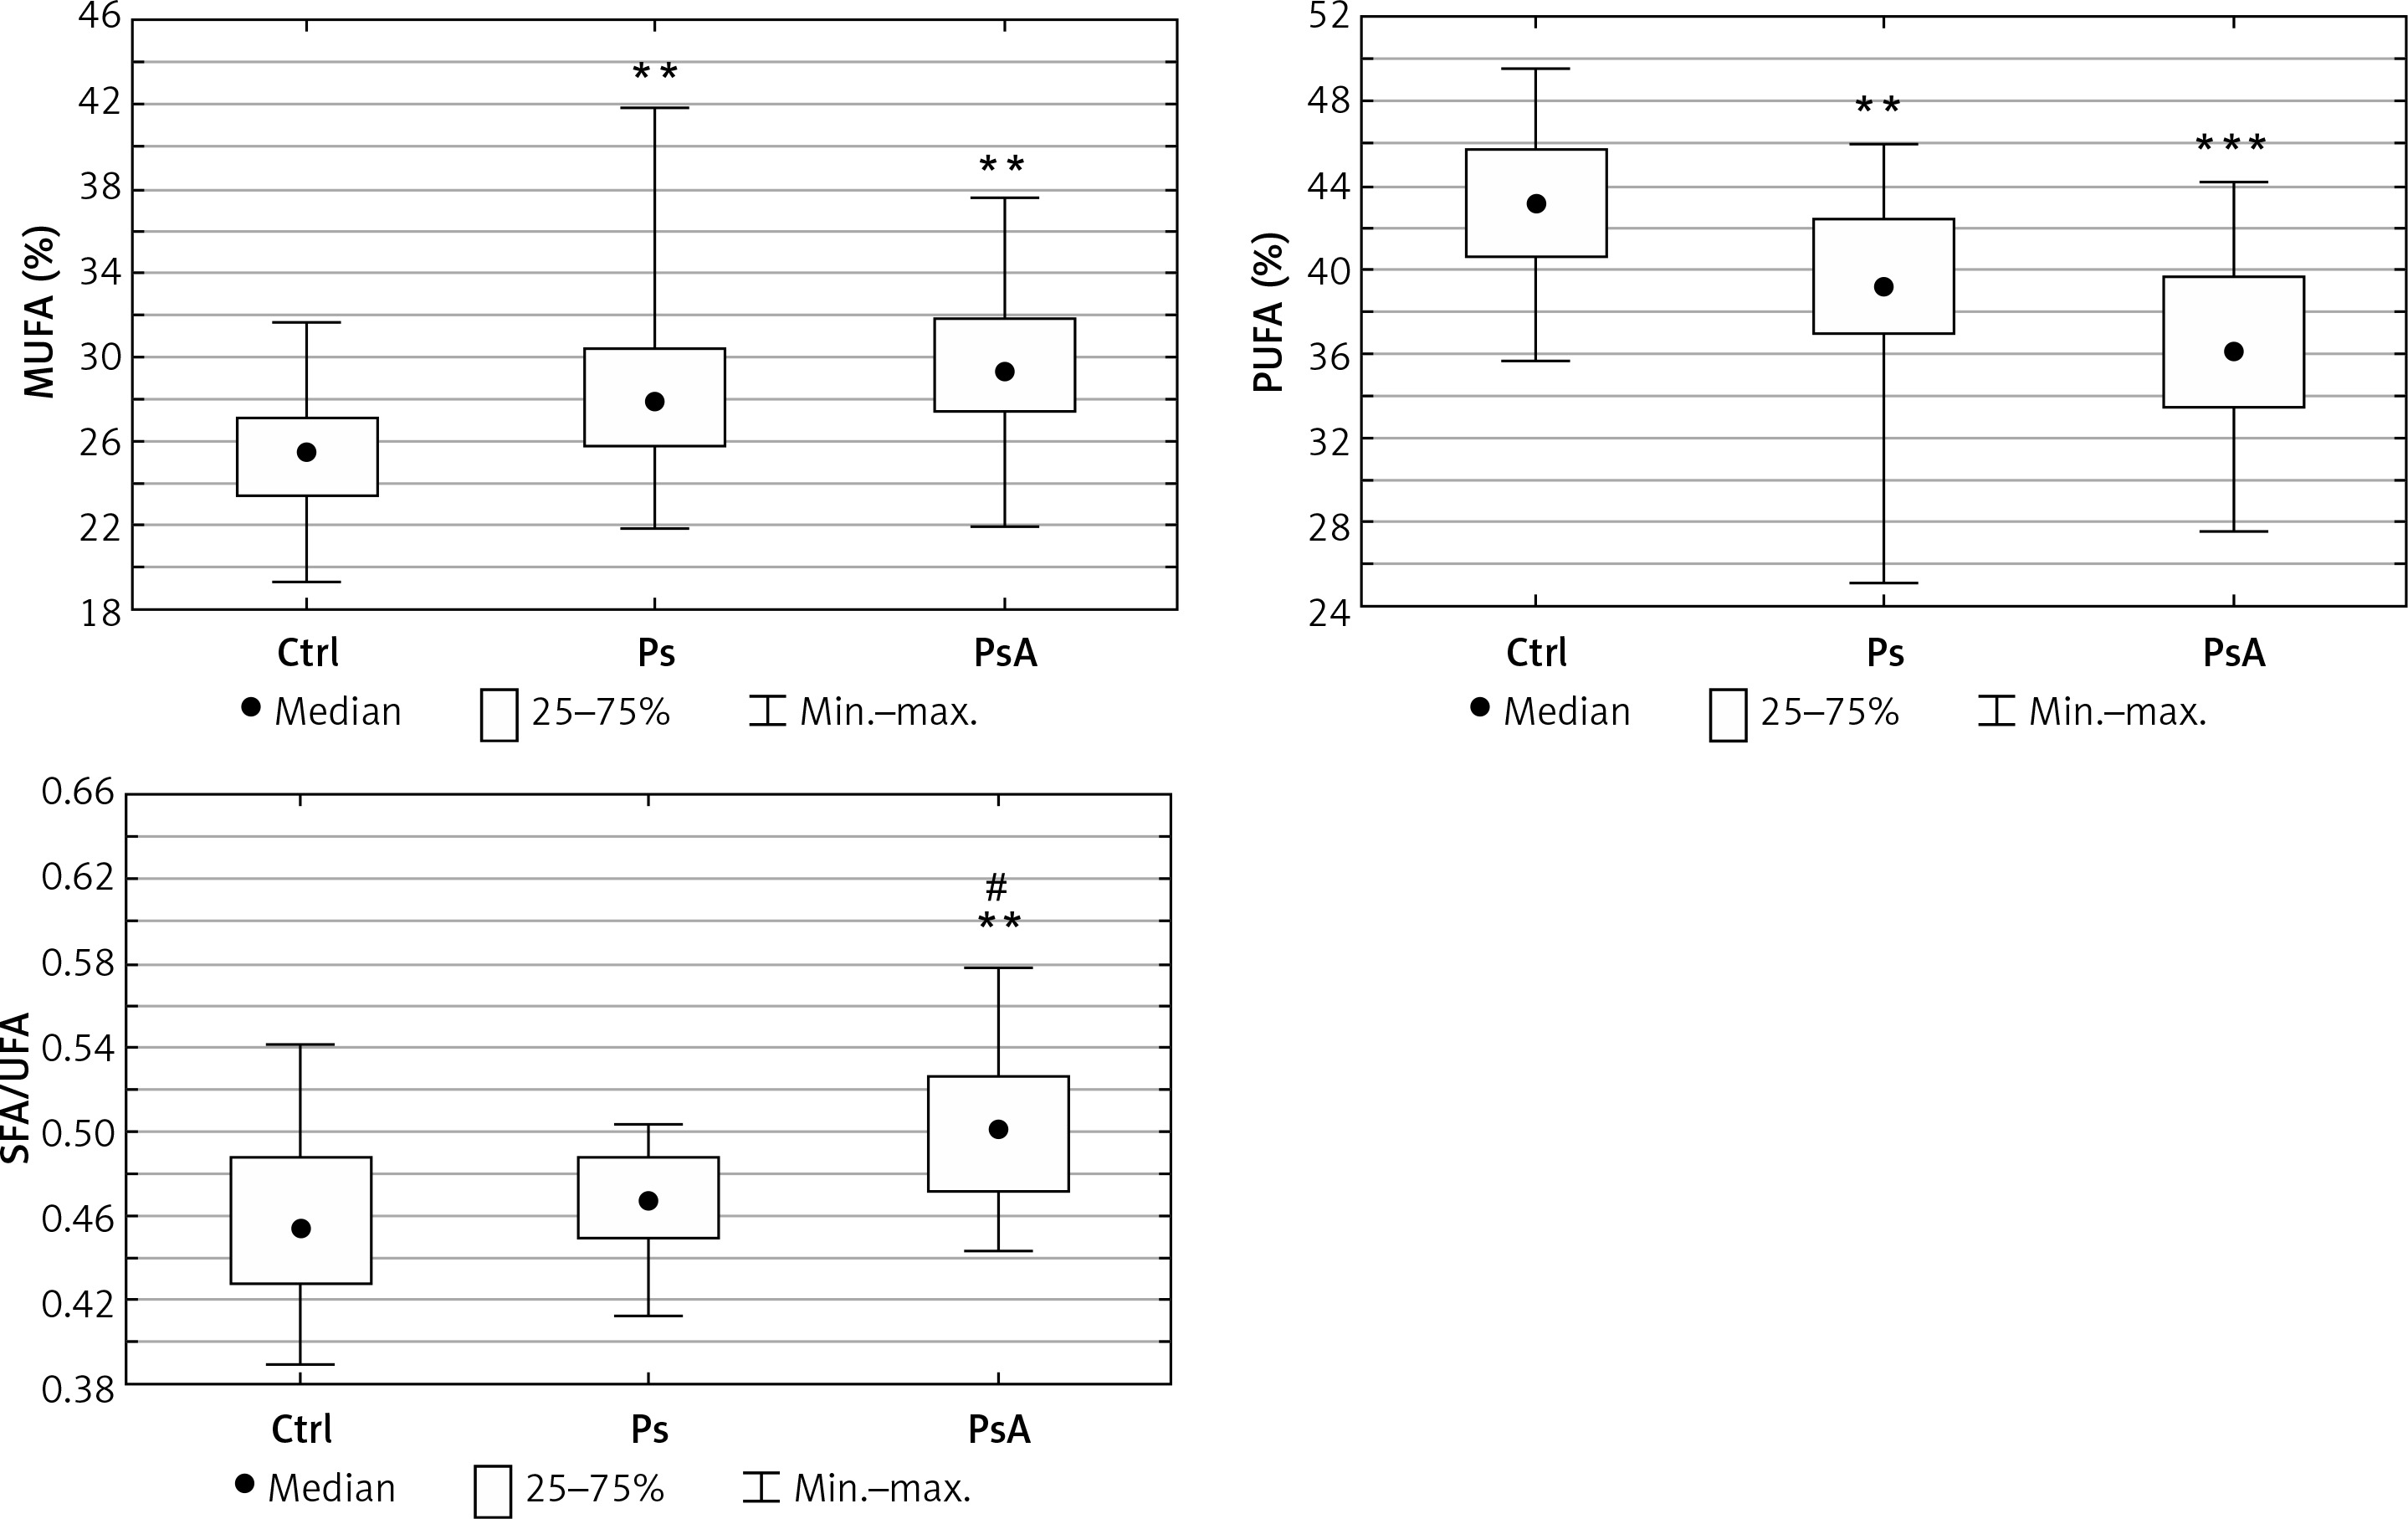
The total FA concentration was similar in the psoriatics (median: 3365.1 mg/l), PsA patients (median: 3572.6 mg/l) and in the control group (median: 3556.1 mg/l), but the particular FA were significantly different (p > 0.05, Table II). Significantly lower serum concentrations of C14:0 (p = 0.002), C18:0 (p = 0.04), C18:2n6 (p = 0.001), C20:0 (p < 0.001), C18:3 (p < 001), C22:0 (p < 0.001), C20:4n6 (p = 0.031), C24:0 (p < 0.001), C20:5 (p < 0.001), C22:6 (p = 0.034) were observed in patients with psoriasis in comparison with the control group. The PsA patients had even lower concentrations of C18:2n6 (p < 0.001), C20:0 (p < 0.001), C22:0 (p < 0.001), C20:4n6 (p = 0.0026), C24:0 (p < 0.001), C24:1 (p = 0.015) compared to the control group, but without significant differences compared to the psoriatic patients (Table II). After dividing FA into subgroups according to their biological properties we observed an increased percentage of SFA (p = 0.017) in PsA and MUFA (p = 0.001) in both psoriatic groups with a concomitant decrease in PUFA (p = 0.004 in psoriatics, and p < 0.001 in PsA) compared to the control group (Figure 1). Additionally, the content of n-3 PUFA was lower in the examined psoriatics and PsA groups (p < 0.001 and p = 0.015 respectively) than in the control group. The content of n-6 PUFA was also reduced in the serum in both groups (p < 0.001 in psoriasis and p < 0.001 in PsA) compared to the healthy controls (Table II). Moreover, the SFA/UFA ratio was significantly higher in PsA patients (p = 0.004) in relation to the controls and higher than in the patients with psoriasis without arthritis (p = 0.002) (Figure 1).
Table II
Differences between serum FA concentrations [mg/l] in psoriatic patients, psoriatic arthritis and control group. Data are shown as median and quartiles (Q1 first quartile, Q3 third quartile). Significant differences between the psoriatics and the control group are shown as: *p < 0.05; **p < 0.01; ***p < 0.001. The differences between the psoriatic subgroups (psoriasis and psoriatic arthritis) are shown as: #p < 0.05
Figure 1
Comparison of FA pattern in psoriatic patients (Ps), psoriatic arthritis (PsA) and the control group (Ctrl). Data are shown as median and quartiles. Significant differences between the psoriatic groups and the controls are shown as: *p < 0.05; **p < 0.01; ***p < 0.001. Significant differences between the psoriatic subgroups (Ps vs. PsA) are shown as #p < 0.05; ##p < 0.01
MUFA – monounsaturated fatty acids, PUFA – polyunsaturated fatty acids, SFA – saturated fatty acids, UFA – unsaturated fatty acids.
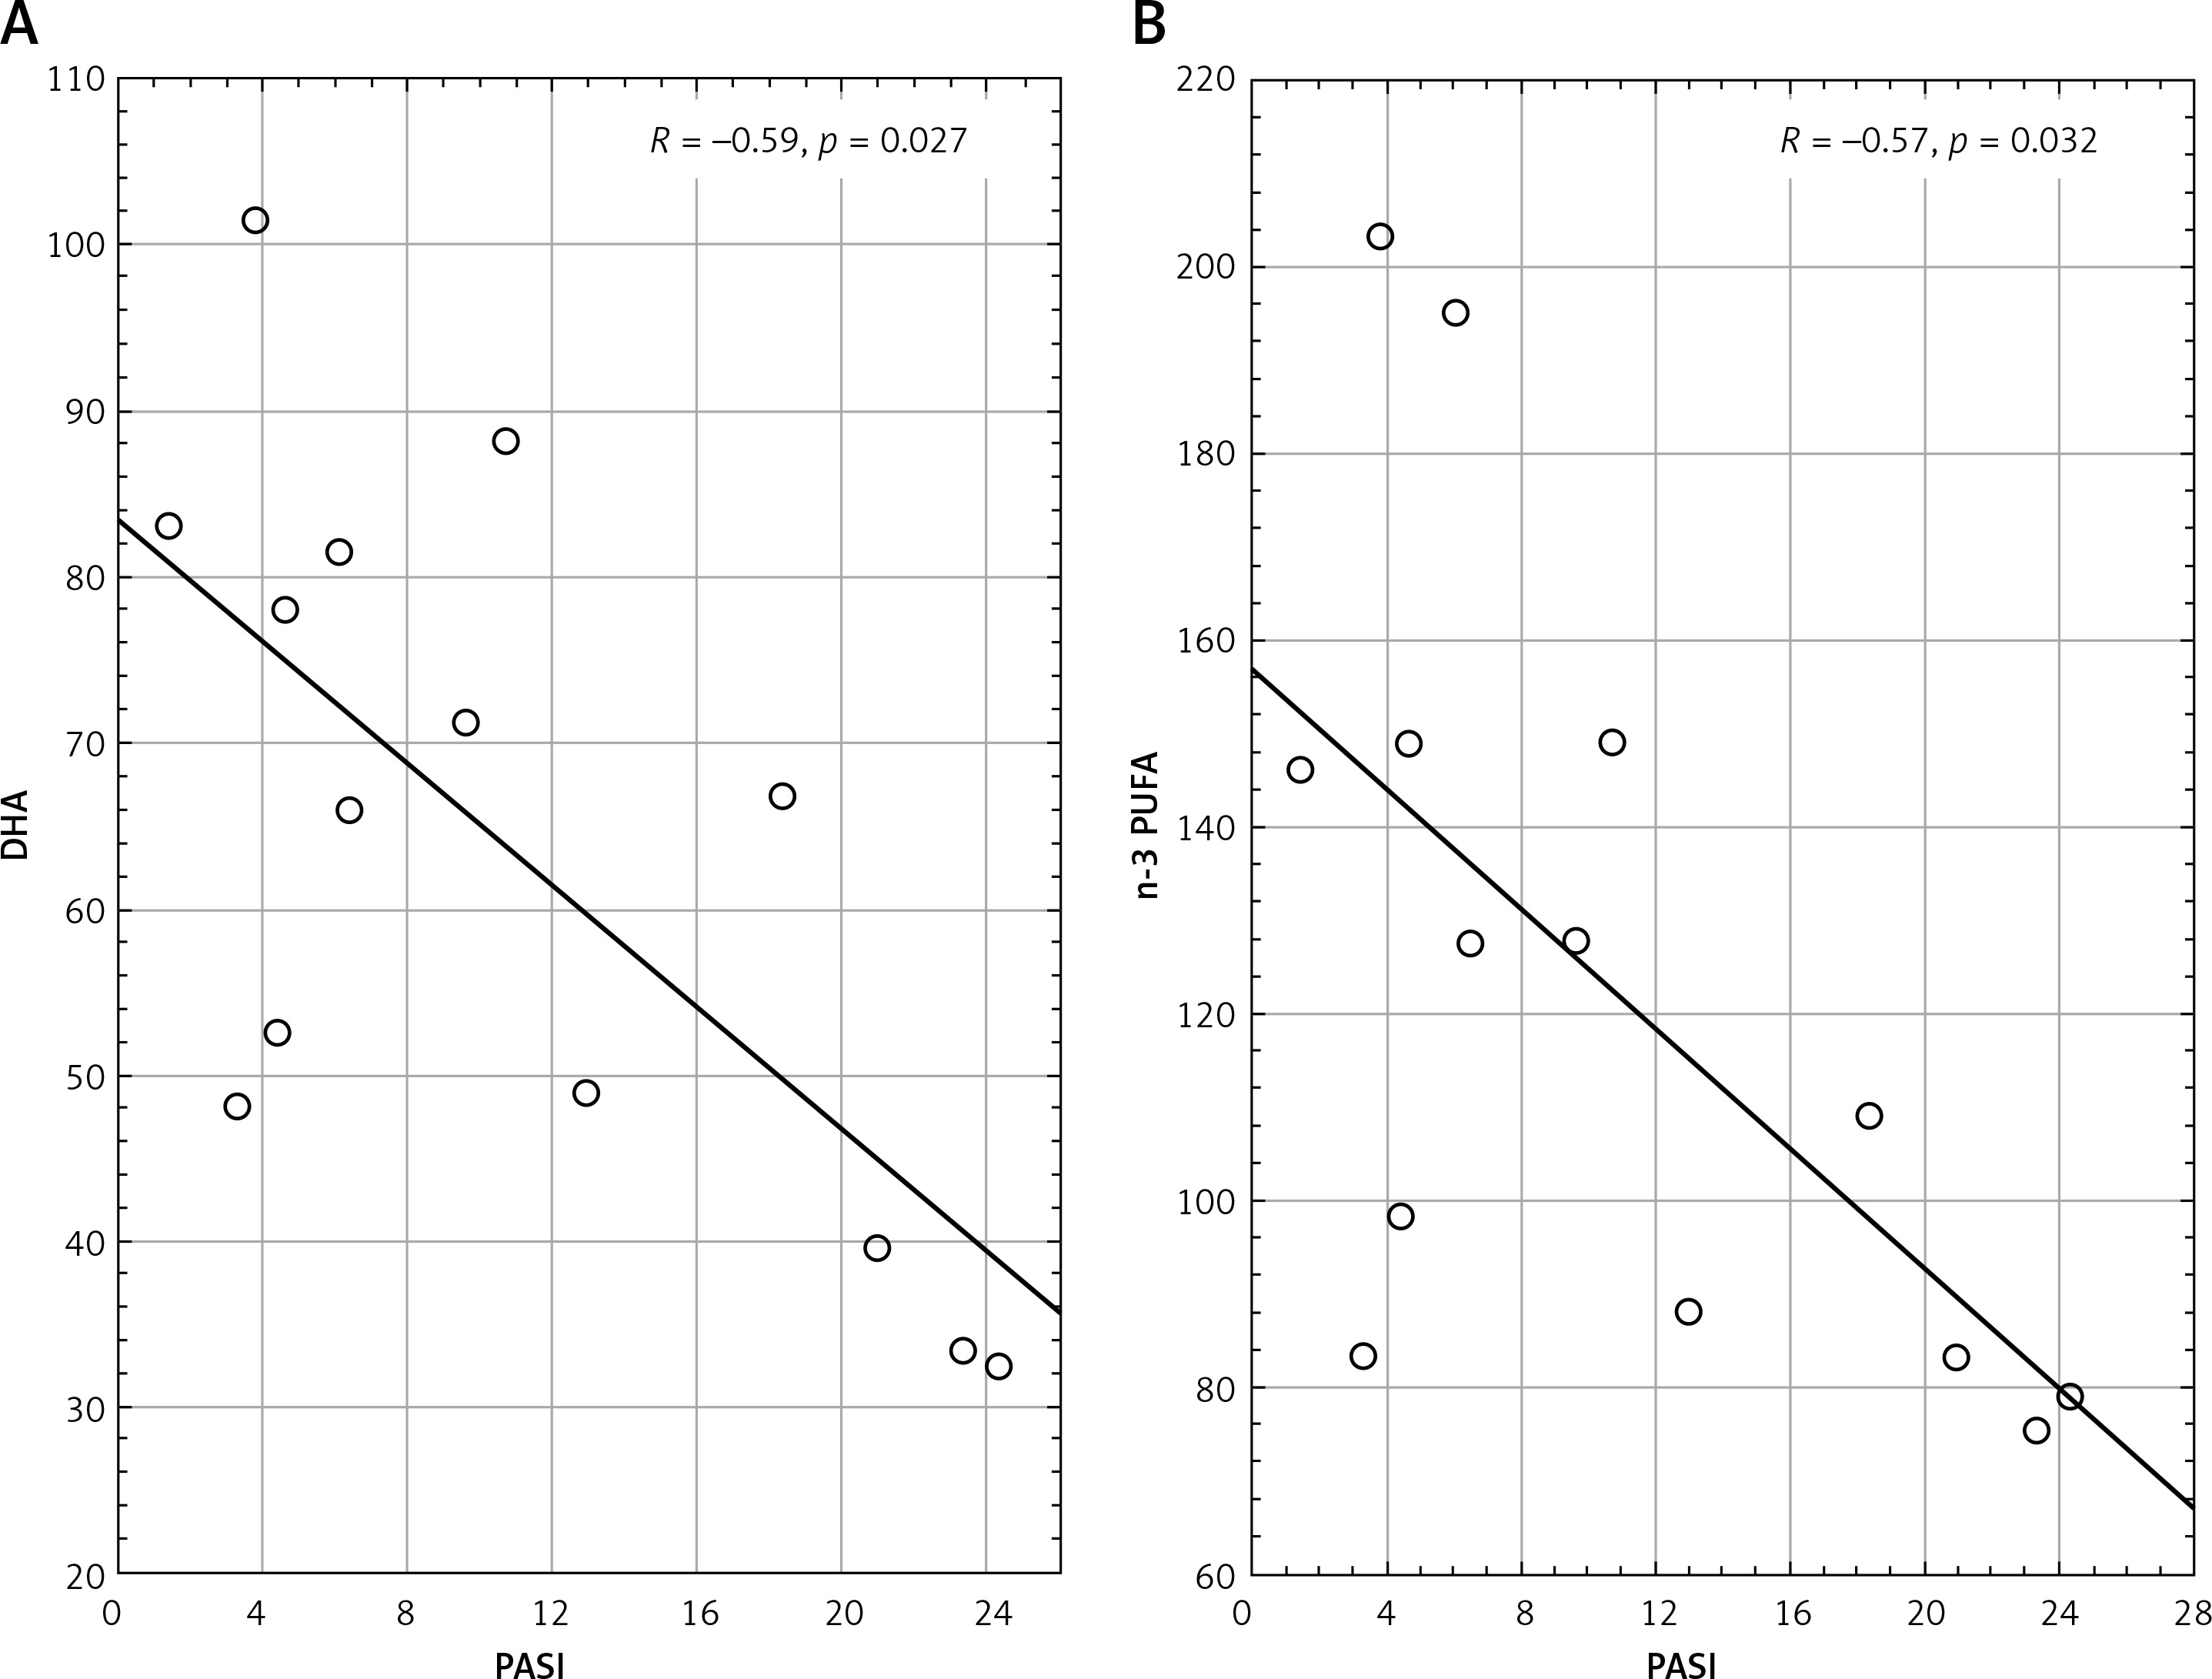
In the group of PsA the serum concentration of DHA and n-3 PUFA correlated inversely with PASI (p = 0.027 and p = 0.031 respectively) (Figure 2). In the same group of patients, concentration of EPA correlated positively with fasting glucose concentration (p = 0.032). In this group, we also observed a positive correlation of C18:0 (p = 0.037), C22:6n3 (p = 0.028), n-3 PUVA (p = 0.037) and n-6 PUVA (p = 0.025) with the total blood cholesterol. Moreover, the C14:0 (p = 0.033), C18:0 (p = 0.021), C18:1n9c (p = 0.015) and total FA concentration (p = 0.028) correlated positively with the triglyceride blood concentration.
Discussion
In the present study we examined FA serum content and composition in psoriasis and psoriatic arthritis. Although the total concentration of FA was not altered, the FA composition showed several significant differences. The major new finding of this study is that we noted abnormal FA composition in both psoriatic groups compared to the healthy controls. We demonstrated lower concentration of 11 out of 14 evaluated FA in psoriatic patients and 7 in the PsA group (Table II). Moreover, significant differences between both psoriatic groups and the control were also present after we grouped FA according to their biological properties (Figure 1). Interferon-γ has been reported to be abundant in psoriatic skin lesions. It has been found to decrease the mRNA expression of elongase of long-chain FA, an enzyme involved in FA metabolism and chain elongation [21]. This could be the possible mechanism leading to the observed FA profile in our study, since we found a decrease in long chain FA in comparison to the healthy control group.
We revealed higher percentages of SFA and MUFA and a lower percentage of PUFA in both psoriatic groups compared to the healthy controls. Interestingly, several differences were more expressed in PsA patients (Table II). In general, SFA are thought to have proinflammatory effects. By contrast, UFA, especially MUFA, are believed to have an anti-inflammatory function [22]. PUFA are required for the formation of eicosanoids, which are metabolic regulators. Eicosanoids derived from n-6 PUFA arachidonic acid (prostaglandins and leukotrienes) can exacerbate inflammatory processes and oxylipins derived from n-3 PUFA (resolvins, maresins, protectins) exhibit anti-inflammatory properties [22]. The observed elevation of SFA percentage in the PsA group may represent a potential link between PsA and the increased risk of metabolic comorbidity as SFA are generally linked to higher cardiometabolic risk [23].
Patients with PsA, in our study group, were older and suffered from psoriasis longer than patients without joint disease. These data correspond to the clinical observations as previously reported [24, 25]. The only significant difference in FA profile between psoriasis and PsA in our study was the higher SFA/UFA ratio in the PsA group (Figure 1). In our previous research, we found an elevated SFA/UFA ratio in obese psoriatics and in individuals with hypertension. Moreover, SFA/UFA ratio correlated positively with disease duration [26]. Taking into account our new finding – the higher SFA/UFA ratio in psoriatic arthritis – it seems that the SFA/UFA ratio conveys a cardiometabolic risk profile in psoriasis and in psoriatic arthritis.
Other metabolic disturbances have also been reported in PsA. Oliviero et al. [27] demonstrated lower serum levels of apolipoprotein A-I and HDL cholesterol in patients with inflammatory arthritis than in the control group. Patients with rheumatoid arthritis (RA) and PsA share a similar pattern of dyslipoproteinaemia. Patients with RA, like PsA patients, have also been reported to have an increased cardiometabolic risk burden that is substantially driven by systemic inflammation [28]. This risk might also increase when abnormalities of lipoproteins occur in these patients. There are controversial data about the circulating FA level in RA. According to Tang et al. [29] free fatty acid (FFA) levels were significantly higher in RA patients compared to healthy controls and FFA levels were positively correlated with disease activity. However, in another study serum FFA concentration did not differ significantly in patients with RA and controls [30]. Interestingly, Navarro et al. [31] found a mild decrease of several SFA, n-3, and n-6 PUFA in plasma and synovial fluid of patients with active RA. The composition of FA is no less important than the overall FA content. Due to a lack of data in the literature concerning FA composition in PsA we can only speculate, based on our data, that a changed FA profile may predispose PsA patients to a higher risk of comorbidity. Synovial fluid contains almost all plasma proteins and solutes, at least qualitatively. Oliviero et al. [27] proposed that synovial fluid composition reflects the metabolic status of synovial tissue and offers a unique opportunity to study lipoprotein pattern at the site of inflammation. Levels of apoprotein AI and total cholesterol were reported to increase in synovial fluid and decrease along with HDL cholesterol in the serum of patients with inflammatory arthropathies. FA can also be involved in the pathogenesis of joint destruction in PsA and RA since they were detected in higher concentrations in synovial fluid than plasma in rheumatic diseases. Moreover, it has been reported that FA induce proinflammatory cytokines, chemokines and matrix metalloproteinases in RA synovial fibroblasts [15].
Another noteworthy finding is related to the negative correlation of DHA and n-3 PUFA contents with disease severity measured by PASI in the group of PsA patients. Low concentrations of DHA and n-3 PUFA (DHA, EPA and α-linolenic acid) may predispose these patients to more severe disease with higher inflammation marker levels. PsA patients were reported to have a higher PASI score than those with psoriasis alone [32]. DHA is an essential fatty acid that is believed to have beneficial effects in several metabolic diseases (such as diabetes and obesity) a source of the anti-inflammatory pro-resolving mediators [33]. These bioactive metabolites have pleiotropic effects that include modulating the immune response by inhibiting leukocyte chemotaxis, adhesion molecule expression and leucocyte-endothelial adhesive interactions and promoting wound healing and tissue regeneration. Additionally, they can inhibit the production of eicosanoids including prostaglandins and leukotrienes from the n-6 PUFA arachidonic acid and the production of inflammatory cytokines and T cell reactivity [34, 35].
It has been shown that a diet designed to increase n-3 and reduce n-6 PUFA ameliorates the metabolic profile and improves the clinical outcomes of the immunosuppressive treatment of psoriasis [36]. The beneficial effect of n-3 PUFA supplementation has been reported by Rahman et al. [37]. The authors observed dose-dependent reduction of inflammation and healing of skin lesions after the omega-3 fatty acid systemic treatment of psoriasis. Furthermore, low serum concentration of n-3 PUFA in psoriasis with higher PASI, found in our group of PsA patients, may be associated with enhanced inflammation and it may play a role in the development of comorbidity. Several epidemiological studies have confirmed a strong association of moderate to severe psoriasis with cardiometabolic disorders including obesity, type 2 diabetes, dyslipidemia and metabolic syndrome, hypertension and arrhythmia [38, 39]. A diet enriched in n-3 PUFA ameliorates metabolic markers and clinical outcome in psoriatic patients with obesity [36].
Vitamin D deficiency is common in psoriatic patients and it can play an important role in the pathogenesis of metabolic disorders [40, 41]. The levels of vitamin D among individuals with metabolic syndrome were found to be lower than among people without metabolic syndrome [41]. Previous in vitro studies have indicated that MUFA and PUFA can decrease the binding affinity of vitamin D metabolites for vitamin D-binding protein [42], which in turn may influence serum levels of free and/or bioavailable 25(OH)D [43]. In our study we confirmed vitamin D deficiency in both study groups: psoriasis and PsA. We did not observe correlations with total FA or specific FA in our patients.
They are several limitations of our study including the relatively small group of patients with PsA, which could affect significant differences. We have to point out that concentrations of many FA (18:2n6; 20:0; 22:0; 20:4n6; 24:0) showed a tendency to decrease in the psoriasis group but it did not reach the level of statistical significance. Another limitation is that in the PsA group we did not measure the disease activity specific for joint involvement. The diagnosis of PsA was just confirmed by consulting independent rheumatologists. A correlation of FA with the disease activity was previously reported in rheumatoid arthritis [44]. Our study does not clarify the association between FA disturbances and psoriatic arthritis. Prospective studies are required to resolve this issue. Moreover, assessment of the FA intake in food would be a valuable adjunct in such studies.
In conclusion, in the present study we found, for the first time, an abnormal FA profile, with a higher SFA/UFA ratio in PsA compared to psoriasis without arthritis and lower concentration of PUFA and higher concentration of MUFA in psoriasis and PsA compared to healthy controls. We observed negative correlations of DHA and n-3 PUFA with PASI in PsA. These findings may explain, at least partially, the higher risk for cardiovascular events and metabolic syndrome in PsA patients in comparison to psoriasis without arthritis. These results support the relevance of lipidomic studies in PsA and provide a rationale for exploration of new therapeutic targets. Further investigations are needed to clarify the relation between serum FA and PsA activity and, what is even more important, to predict the group of patients with higher risk of developing metabolic complications in view of possible prophylactic or therapeutic interventions.