BACKGROUND
Experiencing fear is normal and healthy regarding emotional growth development. However, when these fears linger and become more intense, the development of a specific phobia may occur. According to DSM-5, fear is defined as an emotional reaction to real or perceived imminent danger, while anxiety refers to the anticipation of the potential threat in the future (APA, 2013). Anxiety disorders encompass several types, i.e. separation anxiety disorder, selective mutism, panic disorder attack, generalized anxiety disorder, substance/medication-induced anxiety disorder, agoraphobia, social anxiety disorder/social phobias, as well as specific phobias (APA, 2013). In particular, strong, persistent, specific fears lasting more than 6 months and accompanied by intense physiological symptoms and avoidance or distress typify the presence of a specific phobia (APA, 2013).
Phobia is known as a type of anxiety disorder characterized by exaggerated and irrational fear about some specific situation, place or object. Distinct from other types of disorder, specific phobias are characterized by immediate, intense, and irrational fear if particular objects or situations are confronted. When encountering the feared stimulus or phobic stimulus, the individual with specific phobia experiences automatic physiological reactions such as sweating, increased heart rate, and fainting (Koch & Fernando, 2018).
Charlson et al. (2019) stated that anxiety disorders are the most abundant type of psychiatric disorder in the recent WHO estimation of prevalence of mental disorders. Bandelow and Michaelis (2015) corroborated the same statement. According to European Study of Epidemiology of Mental Disorder (ESEMeD), specific phobia is the most common type of anxiety disorder across Europe (8.3%), whereas National Comorbidity Survey Replication (NCS-R) showed that specific phobia is the second most frequent type of anxiety disorders in the USA (13.8%). Furthermore, Bandelow and Michaelis (2015) argued that late adolescents and the adult population (18-35 years old) are the largest groups of people suffering from a specific phobia. In contrast, a number of studies revealed that the onset of specific phobias is in childhood. The average age of specific phobia onset is 8.7 years and depends on the type of phobia, for example, school age children for entomophobia and middle adolescence for scelerophobia (Capriola et al., 2017; Shahriari-Namadi et al., 2018; Settineri et al., 2019). Furthermore, another study found that around 10% of individuals with specific phobias are preschool children, 7% are boys and 13% are girls (Paulus et al., 2014). For the Indonesian population, we could not find any data regarding specific phobias, although the prevalence of anxiety disorders is around 6%, which is quite high (Ministry of Health, Republic of Indonesia, 2013). Furthermore, approximately 75% of individuals with a specific phobia fear three objects or situations (APA, 2013). Therefore, due to the multiple phobias commonly occurring in this population, diagnosis and intervention issues about specific phobias still exist.
In accordance with DSM-5, specific phobias are specified by animals (e.g. dogs, insects), natural environment (height, water, storm), blood-injection-injury (e.g. invasive medication, needles), situational (airplane, enclosed room, dark place), and others (e.g. costumed character) (APA, 2013). Moreover, American Psychiatric Association (2013) through DSM-5 postulated a number of diagnostic criteria, i.e. (1) anxiety or fear of a specific object or situation, (2) phobic stimulus provokes fear or anxiety immediately, (3) phobic stimulus is actively avoided or endured with great anxiety or fear, (4) the exaggerated fear or anxiety compared with the actual danger posed by the same specific object or situation in the social context, (5) the anxiety, fear, or avoidance behavior persists for 6 month or more, (6) the anxiety, fear, or avoidance behavior distress induces impaired social, occupational, or other important functioning.
DSM-5 criteria for a specific phobia enable us to do broad phobia screening in a population. A number of studies constructed several specific types of phobia measurement, e.g. spiders (Spider Phobia Questionnaire – SPQ, Abbreviated Spider Questionnaire – APQ-15), blood-injection-injury (Medical Fear Survey – MFS, Mutilation Questionnaire – MQ), enclosed place (Claustrophobia Questionnaire – CLQ), vomiting (Emetophobia Questionnaire – EmetQ-13), heights (Acrophobia Questionnaire – AQ), driving (Driving Cognition Questionnaire – DCQ) (Koch & Fernando, 2018). Another technique is utilized for specific phobias measurement, i.e. Behavioral Approach Test (BAT). BAT involves participants approaching as many objects or situations which participants possibly feared as the examiner could provide. Subsequently, participants rate the fear or anxiety through the 1-100 Subjective Units of Distress Scale (SUDS), for example, 75 for blood, 80 for a spider, 90 for lizard (Ollendick et al., 2010).
Also, the American Psychiatric Association (2013) released a screening instrument for identifying the severity of specific phobias, i.e. the Severity Measure for Specific Phobia (SMSP) for both adult and child. This severity measure is provided online at the APA official website. However, we cannot acquire sufficient data to validate this measurement. Sapmaz et al. (2018) provided the only scientific evidence for SMSP, where 50 Turkish children (11-17 years old) who had been diagnosed with a specific phobia in the child psychiatry unit completed the questionnaire. This study resulted in the Cronbach’s α consistency of .96 (from .95 to .96), significant adequacy of sample group and factor analysis (p < .001), and 7.41 for eigenvalue.
Several studies have revealed the validity of various measures to assess specific phobia in adolescents and adults. Zsido et al. (2018) applied the Snake Questionnaire (SNAQ) and Spider Questionnaire (SPQ) to 1354 Hungarian participants who were aged 18-52. Witthauer et al. (2016) conducted a structured psychopathological interview, the Munich Composite International Diagnostic Interview (DIA-X/M-CIDI), to assess the physical subtypes of specific phobias, on 4181 Germans aged 16 to 65 years. Wardenaar et al. (2017) and the WHO also conducted the DSM-IV-based cross-sectional survey on 124 902 adults (18 years old or older) in 22 countries. Yet, in terms of SMSP-A for assessing specific phobias of adolescents and adults, we cannot find any evidence regarding the validity of that instrument. Although the SMSP-A is employed for practical use, other evidence in a different setting is very limited, e.g. clinical and common society setting, as well as the involvement of adult participants. Therefore, further exploration of SMSP-A is necessary. To that end, the use of the instrument to measure a specific phobia can help the Indonesian clinician to conceptualize and develop the appropriate intervention. The cross-cultural adaptation of the instruments requires a methodology to reach equivalence between the original source and target source (Beaton et al., 2000).
We have two study aims, (1) to determine the psychometric properties of Severity Measure for Specific Phobia-Adult (SMSP-A) after being translated into the Indonesian language (Bahasa); (2) to validate the Indonesia Severity Measure for Specific Phobia-Adult (SMSP-A) scale.
PARTICIPANTS AND PROCEDURE
PARTICIPANTS
The study included 417 participants who were randomly selected from four universities in Indonesia. Eight investigators were trained and familiarized with the purpose and specific content of this scale. The questionnaires were handed out to participants and completed individually. On completion of the questionnaire if the investigator identified a missing item due to oversight the participant was asked to respond to the item. For all the studies, informed consent was obtained prior to data collection, from the participants. Participants were undergraduate students and were informed that their responses would remain anonymous.
The average age of the participants was 21.78 years (SD = 5.74, range 18 to 45); 18.46% were boys and 81.53% girls; 76% lived with both parents, 19% with a single mother and 2% with other people; 53.95% were Javanese, 20.86% Sundanese, 5.99% Bataknese, 2.63% Minangnese, 1.19% Melayunese and 15.34% belonged to different ethnic groups. Furthermore, the type of specific phobia most experienced by participants was altitude, storm, water (24.22%) and various types of animals and insects (20.38%). The specific phobias were categorized into none (15.58%), mild (29.49%), moderate (37.17%), severe (16.06%) and extreme (1.67%).
INSTRUMENTS
Severity Measure for Specific Phobia-Adult (SMSP-A; Craske et al., 2013) is designed to assess the severity of specific phobias in individuals age 18 and older. It consists of 10 items, each of which asks the individual to rate the severity of his or her specific phobia during the past 7 days. SMSP-A uses Likert summated ratings with five possible responses, namely never (score 0), occasionally (score 1), half of the time (score 2), most of the time (score 3), and all of the time (score 4).
The total score can range from 0 to 40 with higher scores indicating greater severity of the specific phobia. The raw scores on the 10 items should be summed to obtain a total raw score. Raw scores for the 10 items are added up to generate a raw total score. In addition, the clinician is asked to calculate and use the average total score. The average total score reduces the overall score to a 5-point scale, which allows the clinician to classify the severity of the individual’s specific phobia as none (0), mild (1), moderate (2), severe (3), or extreme (4). The use of the average total score was found to be reliable, easy to use, and clinically useful to the clinicians in the DSM-5 Field Trials. The average total score is calculated by dividing the raw total score by the number of items in the measure. Cronbach’s α for the SMSP-A in this sample was .93.
PROCEDURE
The study followed the ethical guidelines for research involving humans and was conducted in accordance with the principles of the 1975 Declaration of Helsinki, as revised in 2000. This work was approved by the Ethics Committees of the Diponegoro University, Indonesia (consent no. 34/EA/KEPK-FKM/2021). The original scale can be accessed openly on the American Psychiatric Association official website. This instrument can also be reproduced without permission by scale developers or researchers.
Before data collection, all participants provided written informed consent and detailed information about the study. Further, guidelines for translating and adapting the SMSP-A using the International Test Commission (2018) guidelines were followed. The stages of adaptation carried out by researchers were as follows: (1) In the preparation stage the researcher selects a group of translators and experts who will be involved in the forward translation process. (2) The second stage was translation of the Severity Measure for Specific Phobia-Adult (SMSP-A) scale into Indonesian language with the Indonesian cultural context. (3) The third stage is doing synthesis by discussing the results of the translation of the two translators facilitated by the researcher. (4) The fourth step is back translation and review of the results of the translation. (5) The fifth stage is the readability test. New sentences in Indonesian are consulted with linguists. After the item’s statement has been compiled into a scale, it is then tested on 10 students and interviews are conducted. At this stage, the Indonesian language SMSP-A semifinal was produced. (6) The sixth step is carried out by the researcher is to arrange the layout (layout) of the instructions and items of the SMSP-A statement so that it is ready to be presented to the participants. (7) In the last stage, the researcher tested the suitability of the measurement model for each dimension of the Indonesian version of the career commitment scale through confirmatory factor analysis (CFA) and reliability analysis using composite reliability.
DATA ANALYSES
A confirmatory factor analysis (CFA) using AMOS version 22 was conducted on data. In order to assess model fit, absolute fit indexes (χ2, χ2/df), relative fit indexes (IFI) and non-centrality fit indexes (CFI, RMSEA, SRMR) were used, as well as criteria for acceptable fit based on the degree of adjustment described by Hair et al. (2010) (ratio χ2/df < 5, SRMR < .08, RMSEA < .08, GFI, CFI, and IFI > .90). Further, Browne and Cudeck (1993) suggest that RMSEA values below .08 represent acceptable fit and that values at or below .05 represent a good fit. Lower values of the RMR reflect better fit, with values of .05 or lower representing excellent fit.
RESULTS
CONFIRMATORY FACTOR ANALYSIS
A two-factor structure was specified for the CFA. The model was tested to examine whether the SMSP-A can be best understood as a specific phobia measure. As shown in Table 1, the two-factor structure for the SMSP-A scale was close to but did not meet adequate fit criteria (χ2 = 176.07, df = 34, GFI = .91, CFI = .95, TLI = .93, RMSEA = .10). Whereas the GFI, CFI, and TLI were acceptable, the RMSEA was not. To determine the areas of the misfit in the previous model, modification indices were tested. Examination of the modification indices recommended that allowing the error terms of items based on the covariance would improve the model.
Table 1
Goodness-of-fit indices of models for the SMSP-A (N = 417)
| Model | k | χ2 | df | GFI | CFI | TLI | RMSEA |
|---|---|---|---|---|---|---|---|
| Two-factor model | 10 | 178.19* | 34 | .91 | .95 | .93 | .10 |
| Modified two-factor modelª | 10 | 88.65* | 33 | .96 | .98 | .97 | .06 |
[i] Note. *p < .01; k – number of items; df – degrees of freedom; GFI – goodness of fit index; CFI – comparative fit index; TLI – Tucker- Lewis index; RMSEA – root mean square error of approximation. ªRepresents a final model used in the study. Modified two-factor model: two-factor model with the inclusion of covariances between the three residuals of items 7 and 8.
However, an inspection of the modification indices suggested adding covariance to the two error terms of items pertaining to the same factor, i.e., 7 and 8 (“spent a lot of time preparing for or procrastinating about (i.e., putting off) these situations”). This may be a result of the relatively similar wording and underlying latent construct being assessed by these indicators. Further, we re-estimated the model. This modified model provided a marginally better fit than the original two-factor models, as evidenced by a decrease in the χ2 value and improved results for the GFI, CFI, and TLI, although the value for RMSEA (.03) was above the recommended criterion of .08 to indicate a good fit (χ2 = 17.07, df = 13, GFI = .99, CFI = .99, TLI = .97, RMSEA = .03).
DISTRIBUTION OF RESPONSES AMONG VARIABLES
Figure 3 shows a boxplot graph of each 10 items of SMSP-A by displaying the minimum, maximum, quartile 1, quartile 3 and median values. 10 items (SMSP-A) that have the same pattern are P1, P4, P5 and P6 (max 4, min 0, Q1 0, Q3 2, median 1), P2 and P3 (max 4, min 0, Q1 1, Q3 3, median 1), P7 and P9 (max 4, min 0, Q1 1, Q3 3, median 2) and P 10 (median 0).
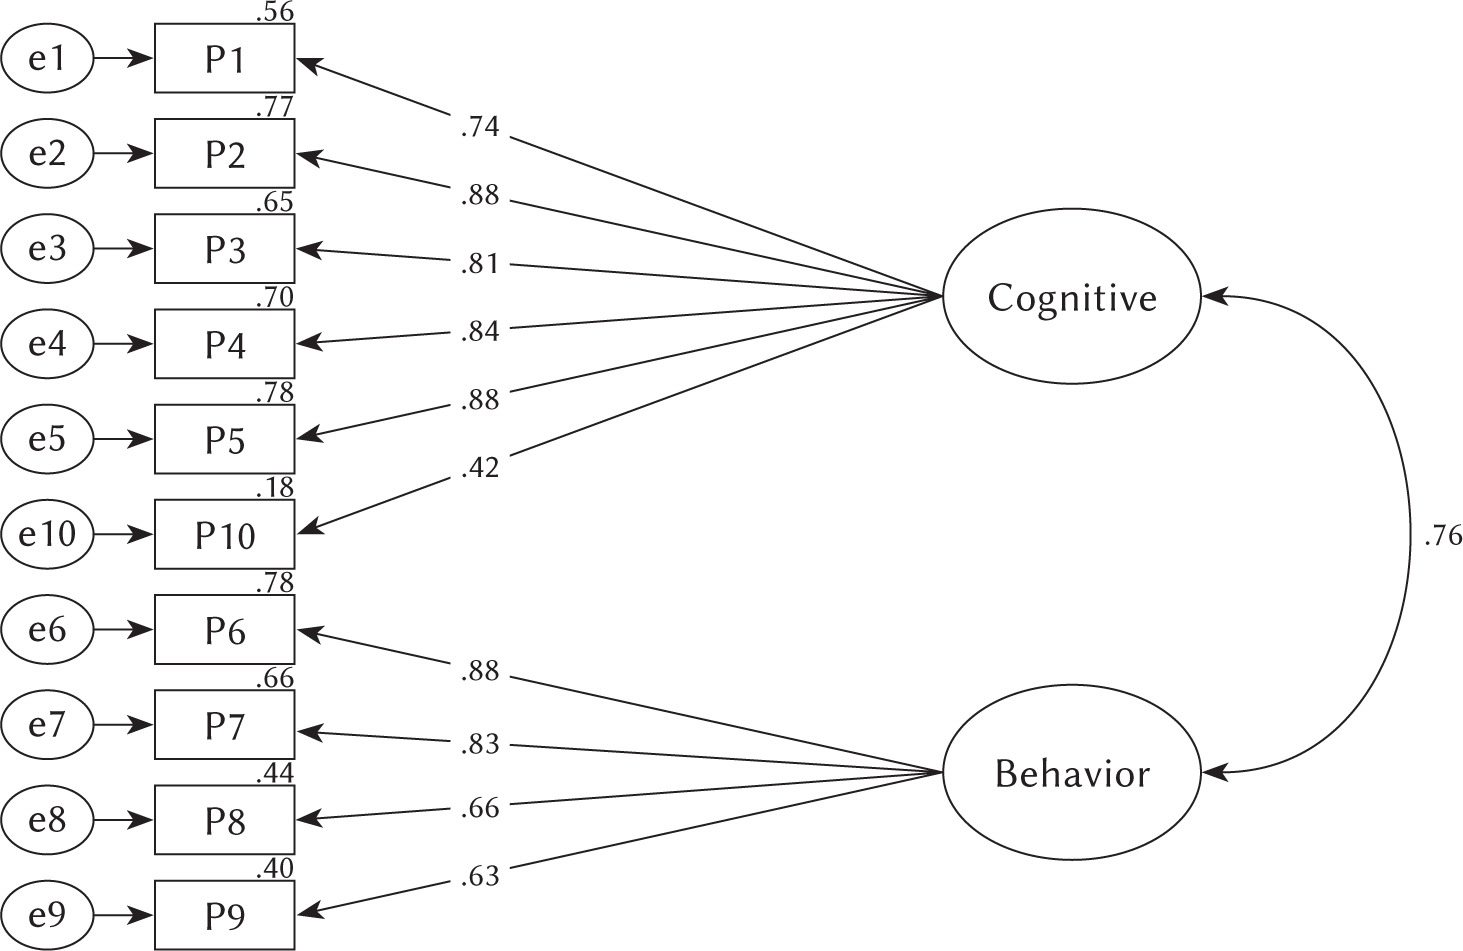
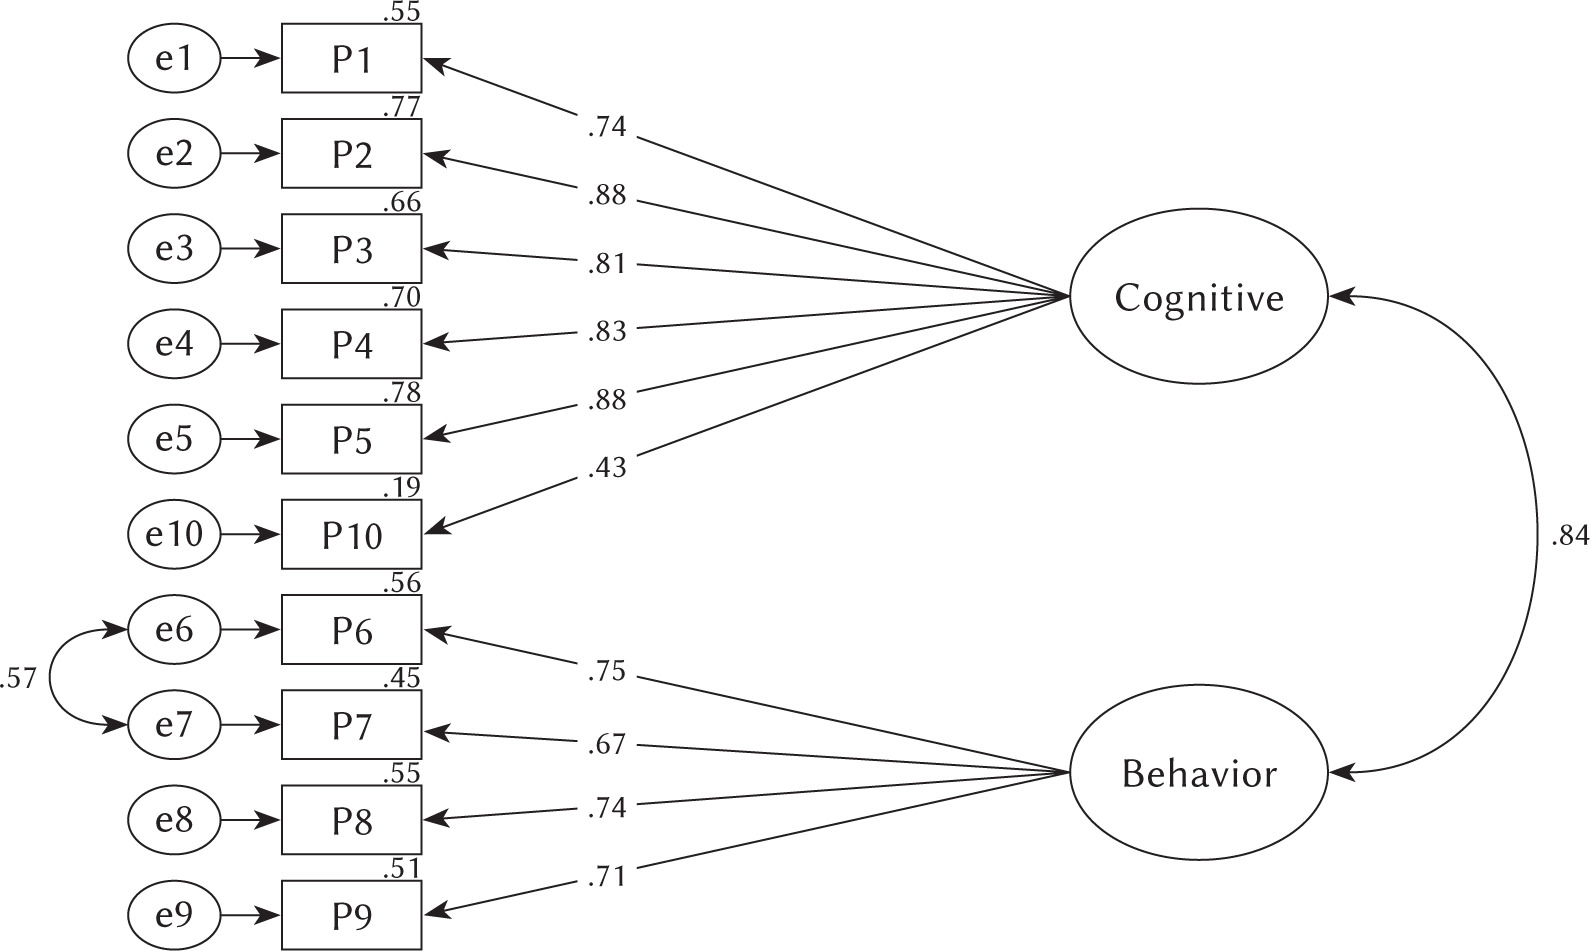
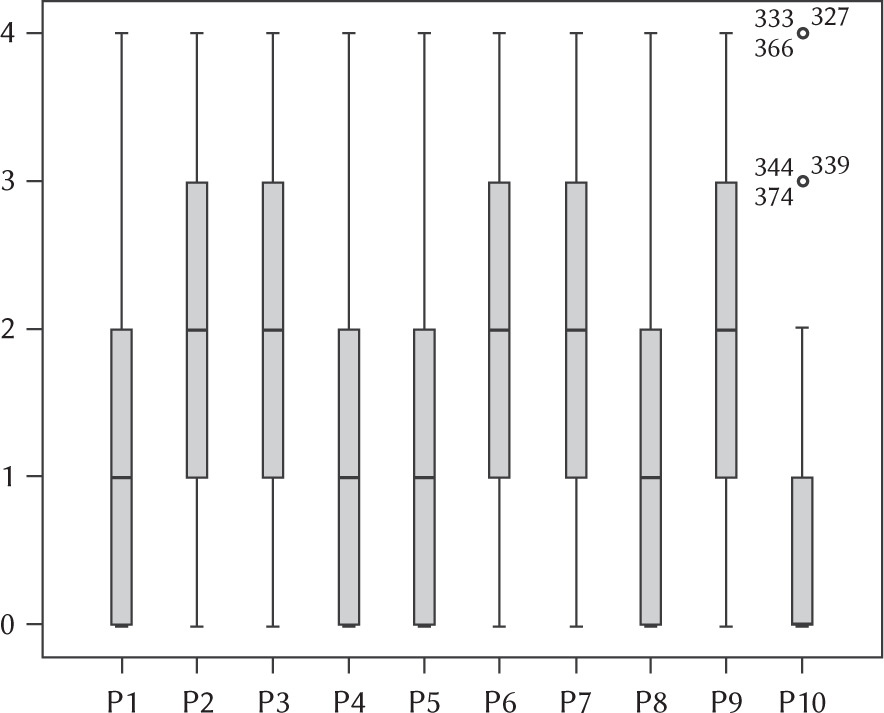
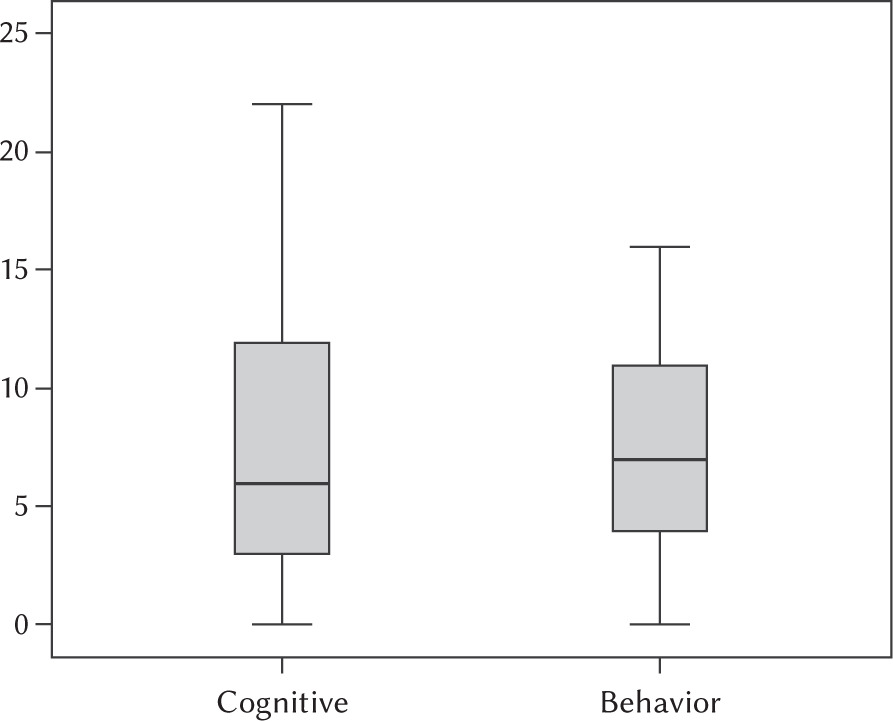
Figure 4 displays a boxplot graph on cognitive and behavioral variables. The cognitive variable has a median value of 6 (max 22, min 0, Q1 3, Q3 12) and the behavior variable has a median value of 7 (max 16, min 0, Q1 4, Q3 11). These data show that the behavior variable has a more symmetrical distribution than the cognitive data distribution.
CORRELATION BETWEEN EACH FACTOR
Based on the correlation test in Table 2, it can be seen that the value of the correlation coefficient between cognitive and behavior variables was .70 with a significance of .01, which means that there was a positive and significant correlation among variables.
Table 2
Correlation between each factor
DISCUSSION
The worldwide use of SMSP-A within the context of culture was considered important. To our knowledge, this is the first study assessing the two-factor model of SMSP-A in an Indonesian sample. Based on data, we generated a two-factor model using Varimax rotation. Assessment of fit between the model and the observed variables (items) was presented through the CFA approach. The modified two-factor model has been well identified as each factor has at least two items which are required in the model identification. Further, we named factor 1 as a cognitive functioning factor, consisting of items number 1, 2, 3, 4, 5 and 10. Factor 2 initialed as behavior functioning, consisting of items number 6, 7, 8, 9. The model assessment shows that two factors with 10-item structure have a good fit for the study.
The correlation between cognitive and behavior variables in this study showed that there was a positive and significant correlation among variables. This study is similar to a previous study conducted by Soraci et al. (2020) regarding validation of the Italian version of the SMSP-A scale which showed that the SMSP-A had an acceptable correlation between variables. Various studies have found that the cognitive aspects of individuals affects the way individuals behave (Huang et al., 2015; Batkoska & Koseska, 2012). Furthermore, the cognitive and behavior aspects of the individuals provide mutual control (Mirasandi, 2019).
Several studies posit that cognition plays an important role in the maintenance of phobia (Clark & Rock, 2016; Derakshan & Eysenck, 2009; Fogarty et al., 2019; Eysenck et al., 2007). Phobia is a form of excessive fear about something or a situation related to how the individual understands their bad or traumatic experiences. The cognitive factor has an influence in terms of the perceived ability to face the fear of certain things. Conditioning and modeling develop the cognitive distortion and lack of self-efficacy when faced with the phobia’s stimulus. Further, cognitive theories indicate that stress impairs performance by increasing attention to negative thoughts. Phobic people automatically scan the environment for threat cues, making it more difficult to disengage from that stimulus (Bar-Haim et al., 2007). This cognitive interference has been suggested to play a pivotal role in the development and/or maintenance of phobia (Hermans et al., 2014; Mogg & Bradley, 2016).
This study has been unable to compare the findings of the study with previous research studies as there are no studies undertaking the CFA approach and SEM to validate the SMSP-A among university students. For this reason, further studies that compare the findings of this study and test the fitness of the two-factor model will need to be undertaken. The new knowledge can be applied to further refine theoretical models of specific phobia and ultimately enhance current assessment with fit to cultural context.
CONCLUSIONS
From this study, we could conclude that the 10-item SMSP-A (adding covariance) provides a valid and reliable scale to measure specific phobia among Indonesian undergraduate students. The results also indicated that the scale is valid and reliable to measure the level of specific phobia in both male and female students. Therefore, the university’s counselors can use the SMSP-A in order to assess psychological conditions regarding phobia. The results from such assessments can be used to modify psychological education programs aiming at enhancing mental health.