

Introduction
Acute leukemias form a group of neoplastic diseases in which, due to accumulation of acquired genetic disorders, inhibition of differentiation and maturation of precursor cells (blasts), as well as abnormal cell proliferation and apoptosis occur. Cytogenetic and molecular assessment in acute leukemias constitutes the basis for their classification, and also provides information on the prognosis and potential therapeutic goals [1, 2]. The material for cytogenetic assays (bone marrow) should undergo appropriate procedures in accordance with standardized, laborious, and costly protocols. The final result may become available as late as ten or more days after the material has been delivered to the laboratory.
The nucleolar organizer region (NOR) is a chromosome segment that contains genes for major ribosomal RNA. A specific group of acidic, strongly argyrophilic, non-histone protein complexes located in the same regions as NORs allows for accurate and fast visualization of nucleolar organizer regions through silver nitrate staining. Silver-stained NORs are called AgNOR, and the argyrophilic NOR proteins are called AgNOR proteins [3]. The amount of AgNOR proteins is related to the cell proliferation activity and the degree of malignant transformation [4]. AgNOR surface area for each nucleus shape can be a predictor of tumor recurrence, and also provides useful information for treatment planning [5].
The AgNOR staining method has been used in the research of neoplasms of such organs and systems as kidneys, prostate, bronchi, breasts, gastrointestinal tract, thyroid gland, uterus, and skin. Most of the results, though not all, showed a correlation between the number of AgNOR in the cell and the survival of patients [6-12]. Correlations between the AgNOR proteins and the malignancy stage of non-Hodgkin lymphomas, percentage of cells showing expression of the Ki-67 protein on their surfaces, and the number of cells in the S-phase have also been reported [13-19].
The AgNOR protein staining method has also been used in acute leukemias. Initial studies conducted in children with acute lymphoblastic leukemia (ALL) demonstrated that larger AgNOR surface area is associated with a higher number of deaths, more frequent relapses, and shorter time until disease recurrence [20].
Studies conducted in adults with acute myeloid leukemia showed that patients in whom remission was achieved had a higher number of AgNOR in their cells compared to patients in whom remission was not achieved [21].
In further research, the analysis of AgNOR in acute leukemias in adults was used, among others, to compare and define the stage of acute myeloid leukemia (AML) and ALL. However, data on this subject are scarce. Therefore, the decision was made to reanalyze selected AgNOR indexes as the differentiating parameters in AML and ALL blastic cells. A further goal of this research was to find out whether analyzing the number and configuration of AgNOR in relation to certain cytogenetic-molecular disorders would allow for a quick, initial assessment of cytogenetic lesions and assignment of patients to a specific risk group without performing difficult and expensive specialist examinations.
Material and methods
Patients
The study group consisted of 70 adult patients hospitalized in the Department of Internal Diseases and Hematology of the Military Institute of Medicine in 2017-2021.
Patients with the criteria for the diagnosis of blast crisis in chronic myeloid leukemia and patients undergoing chemotherapy and/or radiotherapy for solid tumors were excluded from the analysis. Among 45 patients with AML there were 25 women and 20 men aged 20 to 85 years (mean 55.8). The diagnosis was made according to French-American-British (FAB) criteria: 5 with M0, 20 with M2, 17 with M4 and 3 with M5. Patients were divided into risk groups using the cytogenetic classification developed by ELN 2017 (European LeukemiaNet): 27 patients belonged to the group of cytogenetic risk with intermediate prognosis (ELN2) and 18 patients belonged to the group of cytogenetic risk with an unfavorable prognosis (ELN3) [20]. Patients with acute lymphoblastic leukemia comprised 25 cases: 11 women and 14 men aged 25 to 81 years (mean 55). Of the 21 patients with B-cell ALL, 10 were Philadelphia chromosome positive patients. Morphological, immunophenotypic and genetic (bone marrow and/or peripheral blood) assessments were performed prior to any therapeutic intervention.
AgNOR analysis
Staining of the nucleolus organizer zones (AgNOR) was performed according to the following method: the marrow aspirate was smeared on a glass slide and then, after drying at room temperature, it was fixed in ethyl alcohol for 10 min. The slide was rinsed in distilled water and stained for 20 min at room temperature, protected from light.
The staining solution was prepared by immediately and rapidly mixing one volume of solution A (2% solution of gelatin dissolved in distilled water, to which formic acid was added to give a 1% final solution) with two volumes of solution B (50% silver nitrate solution in distilled water). After the staining was completed, the staining solution was decanted, and the slides were rinsed several times with distilled water, then placed for 10 min in a 5% thiosulfone solution and rinsed again in distilled water. After drying, the stained slides were analyzed under a light microscope at a total magnification of 1000× (Olympus BX51 microscope, MDOB3 model, Tokyo, Japan).
The computerized image analysis system called cell* Soft Imaging System (Germany) and the Microsoft Excel program were used to determine the AgNOR surface area, cell nucleus shape and individual structures. Cell and nucleus outlines were made and AgNOR parameters were determined. These values were collected, calculated using the author’s program and exported to the EXCEL spreadsheet. Using the EXCEL function, frequencies of occurrence of particular types and groups of AgNOR were calculated.
Blast cells were identified as cells containing yellow-brown stained cell nuclei, with dark brown spots corresponding to AgNOR structures. 200 blasts were analyzed in each case.
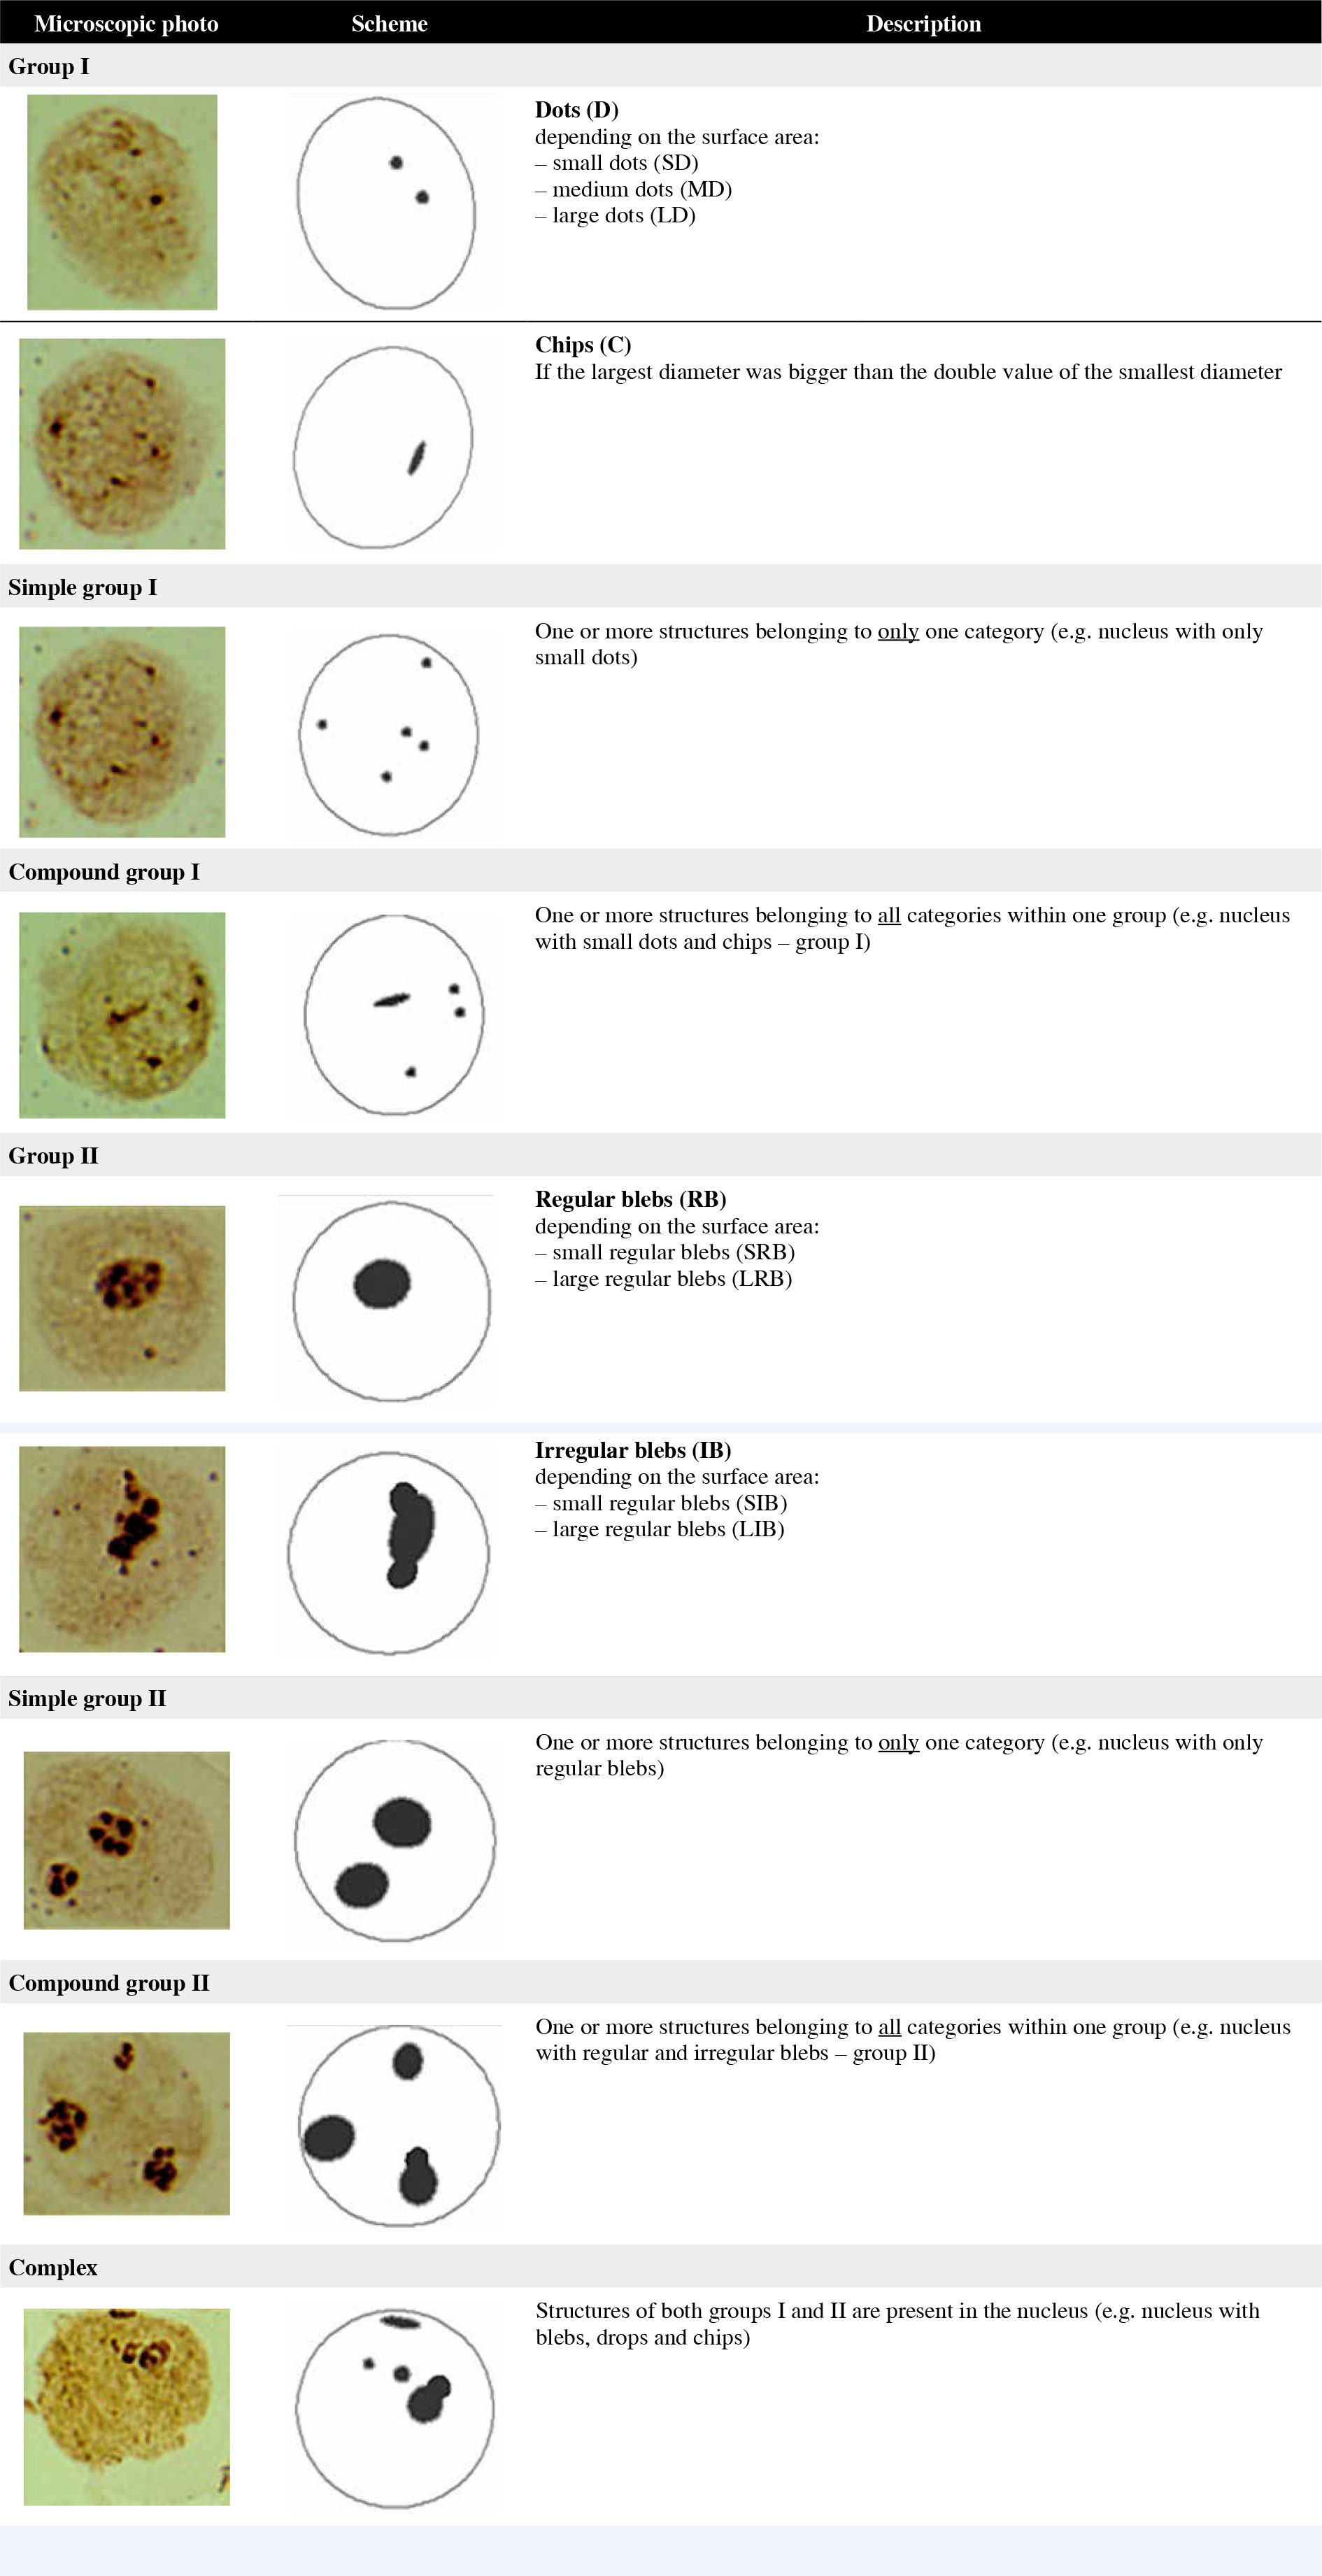
The structure and distribution of AgNOR granules in bone marrow blastic cells were classified according to the system developed by Nikicz, with modification [22]. The modification consisted in differentiating AgNOR depending on surface area.
AgNOR in the shape of regular dots, with irregular structure and with surface area < 4.5 µm2, were classified as group I.
Regular dots were divided into three size categories:
those with surface area ≤ 0.75 µm2 were classified as small dots (SD);
those with surface area > 0.75 µm2 and ≤ 1.7 µm2 were classified as medium dots (MD);
those with surface area > 1.75 µm2 and ≤ 4.5 µm2 were classified as large dots (LD)
and if the largest diameter was bigger than double the value of the smallest diameter, the structure was classified as chips (C).
AgNOR in the shape of regular or irregular blebs and surface area > 4.5 µm2 were classified as group II.
Regular blebs were divided into two size categories:
those with surface area ≤ 12 µm2 were classified as small regular blebs (SRB);
those with surface area > 12 µm2 were classified as large regular blebs (LRB).
AgNOR with largest diameter length equal or larger than the double length of their smallest diameter were classified as irregular blebs.
Irregular blebs were divided into two size categories:
those with a surface area ≤ 12 µm2 were classified as small irregular blebs (SIB);
those with a surface area > 12 µm2 were classified as large irregular blebs (LIB).
Additionally, group I and group II were divided according to the type of AgNOR structures in the nucleus:
Simple configuration – the presence of one or more structures belonging to only one category (e.g. nucleus with only medium dots);
Compound configuration – the presence of one or more structures belonging to all categories within one group (e.g. nucleus with medium dots and chips).
Structures of both groups (I and II) in the nucleus were classified as complex configurations (e.g. nucleus medium dots, chips and blebs).
The different structures of AgNOR granules in bone marrow blastic cells depending on shape, surface area and distribution are shown schematically in Figure 1.
Results
AgNOR structure patterns
We found a statistically significantly higher value for MD in patients with ALL compared to patients with AML (p = 0.0125) in group I, estimating the distribution of regular dots (Table 1).
Table 1
Distribution of AgNOR structures in AML and ALL (*p < 0.05)
We observed significantly higher values for all examined structures in group II of AgNOR blebs in the patients with AML as compared to patients with ALL: SRB (p = 0.0000), SIB (p = 0.0342), LRB (p = 0.0001), and LIB (p = 0.0057) (Table 1).
In group I, we found a statistically significantly higher value among simple (p = 0.000) and compound (p = 0.0035) structures in ALL patients comparing to AML patients. In contrast, in group II, statistically significant values among simple (p = 0.0166) and mixed (p = 0.0000) structures were demonstrated in AML, compared to ALL. Complex structures were much more numerous in the group of patients with ALL than in patients with AML (p = 0.0000) (Fig. 2).
Fig. 2
Distribution of individual structures’ configurations in AML and ALL
AgNOR – argyrophilic nucleolar organizer regions, ALL – acute lymphoblastic leukemia, AML – acute myeloid leukemia
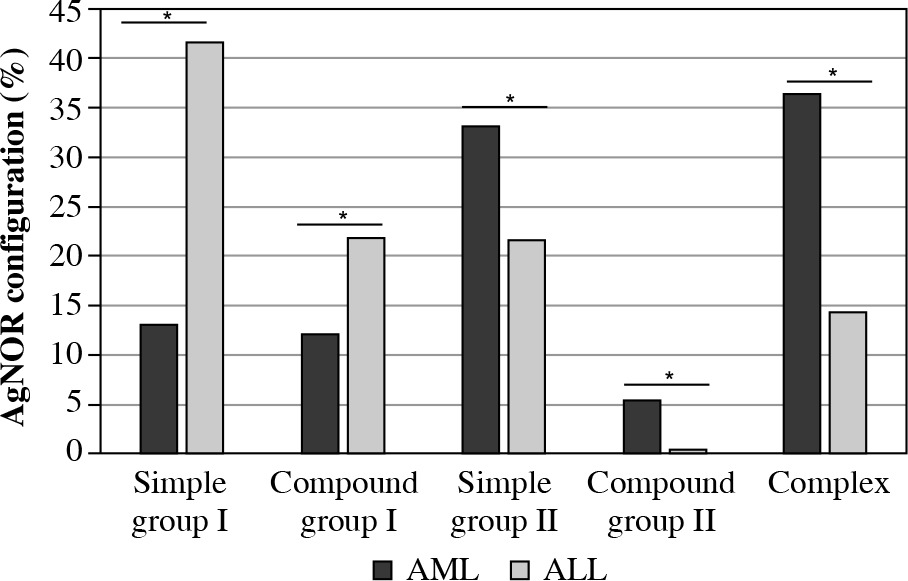
Table 2 shows that the dominant AgNOR structure patterns in AML were: 1 × LRB present in 965 leukemic cells, which constitutes 10.72% of the entire analyzed group and 2 × SRB present in 960 cells, which constitutes 10.67% of the entire analyzed group.
Table 2
AgNOR map patterns in AML (the table shows the 10 most common patterns)
| SD | MD | LD | C | SRB | SIB | LRB | LIB | % | Quantity |
|---|---|---|---|---|---|---|---|---|---|
| 0 | 0 | 0 | 0 | 0 | 0 | 1 | 0 | 10.72 | 965 |
| 0 | 0 | 0 | 0 | 2 | 0 | 0 | 0 | 10.67 | 960 |
| 0 | 0 | 0 | 0 | 1 | 0 | 0 | 0 | 8.82 | 794 |
| 0 | 0 | 1 | 0 | 1 | 0 | 0 | 0 | 8.64 | 778 |
| 0 | 0 | 2 | 0 | 1 | 0 | 0 | 0 | 5.00 | 450 |
| 0 | 0 | 1 | 0 | 2 | 0 | 0 | 0 | 4.49 | 404 |
| 0 | 0 | 0 | 0 | 1 | 0 | 1 | 0 | 3.74 | 337 |
| 0 | 0 | 3 | 0 | 0 | 0 | 0 | 0 | 3.66 | 329 |
| 0 | 0 | 2 | 0 | 0 | 0 | 0 | 0 | 3.50 | 315 |
| 0 | 0 | 1 | 0 | 0 | 0 | 1 | 0 | 2.46 | 221 |
Table 3 shows that, in ALL, the dominant AgNOR structure pattern was 1 × LD, which was present in 920 leukemic cells (of the 5000 counted cells), constituting 18.4% of the entire analyzed group.
Table 3
AgNOR map patterns in ALL (the table shows the 10 most common patterns)
| SD | MD | LD | C | SRB | SIB | LRB | LIB | % | Quantity |
|---|---|---|---|---|---|---|---|---|---|
| 0 | 0 | 1 | 0 | 0 | 0 | 0 | 0 | 18.4 | 920 |
| 0 | 0 | 0 | 0 | 1 | 0 | 0 | 0 | 14.9 | 747 |
| 0 | 0 | 2 | 0 | 0 | 0 | 0 | 0 | 10.1 | 505 |
| 0 | 1 | 1 | 0 | 0 | 0 | 0 | 0 | 6.4 | 319 |
| 0 | 0 | 1 | 0 | 1 | 0 | 0 | 0 | 6.2 | 311 |
| 0 | 1 | 2 | 0 | 0 | 0 | 0 | 0 | 3.7 | 185 |
| 0 | 0 | 0 | 0 | 0 | 0 | 1 | 0 | 3.5 | 175 |
| 0 | 2 | 0 | 0 | 0 | 0 | 0 | 0 | 3.1 | 157 |
| 0 | 1 | 0 | 0 | 0 | 0 | 0 | 0 | 2.9 | 145 |
| 0 | 0 | 3 | 0 | 0 | 0 | 0 | 0 | 2.8 | 140 |
Comparing groups of the cytogenetic risk with intermediate prognosis (ELN2) and the cytogenetic risk group with poor prognosis (ELN3) we found a statistically significant difference in the mean number of AgNOR for LRB structures (p = 0.01) (Table 4).
Table 4
Distribution of AgNOR structures in AML depending on the cytogenetic-molecular risk according to European LeukemiaNet (ELN) (*p < 0.05)
| Group | Number of AgNOR | Number of AgNOR in group I | Number of AgNOR in group II | ||||||||
|---|---|---|---|---|---|---|---|---|---|---|---|
| SD | MD | LD | C | Total | SRB | SIB | LRB* | LIB | Total | ||
| ELN2 | 2.57 | 0.04 | 0.34 | 1.16 | 0.04 | 1.58 | 0.79 | 0.04 | 0.15 | 0.01 | 0.99 |
| ELN3 | 2.37 | 0.02 | 0.22 | 0.84 | 0.05 | 1.13 | 0.91 | 0.05 | 0.27 | 0.01 | 1.24 |
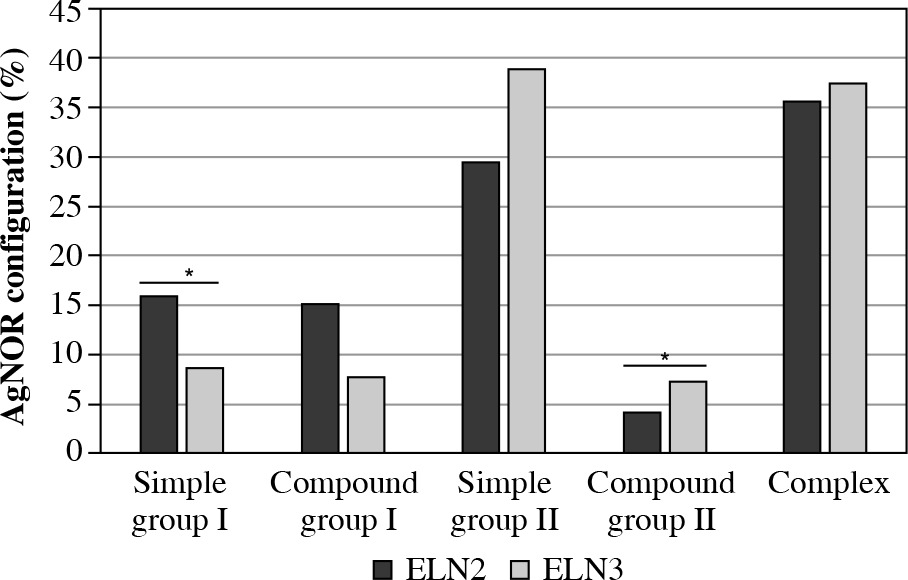
Statistically significant differences in the AgNOR configuration distribution in AML were found between the cytogenetic risk group with intermediate prognosis (ELN2) and the cytogenetic risk group with poor prognosis (ELN3) among simple structures (p = 0.04) in group I and among mixed structures in group II (p = 0.03) (Fig. 3).
Fig. 3
AgNOR configuration distribution in prognosis groups
AgNOR – argyrophilic nucleolar organizer regions, ELN – European LeukemiaNet
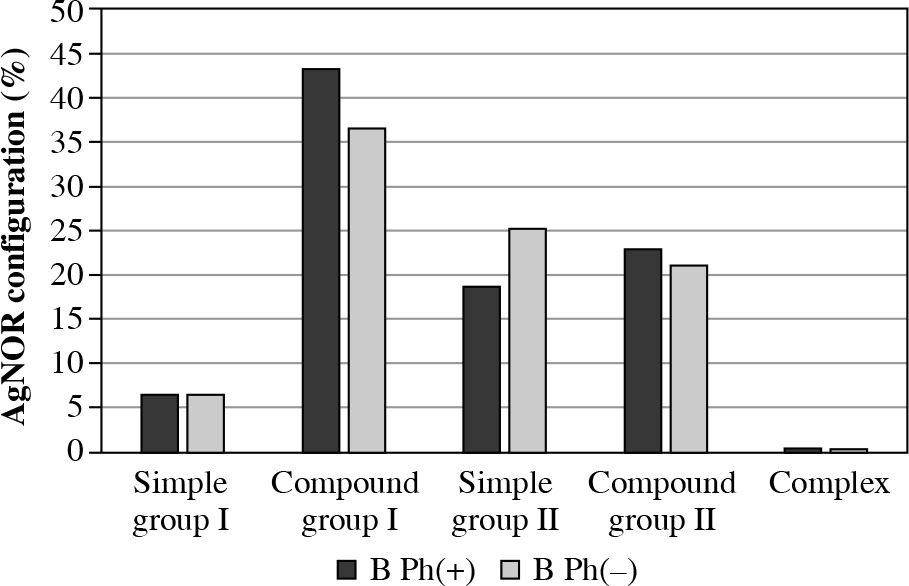
No statistically significant differences were detected in both group I and II of all AgNOR structures and configuration distributions in ALL-B taking into account the presence of the Philadelphia chromosome (Table 5, Fig. 4).
Table 5
Distribution of AgNOR structures in individual ALL types (*p < 0.05)
Fig. 4
AgNOR configuration distribution in ALL-B with consideration of the presence of the Philadelphia chromosome
AgNOR – argyrophilic nucleolar organizer regions, ALL – acute lymphoblastic leukemia, Ph – Philadelphia chromosome
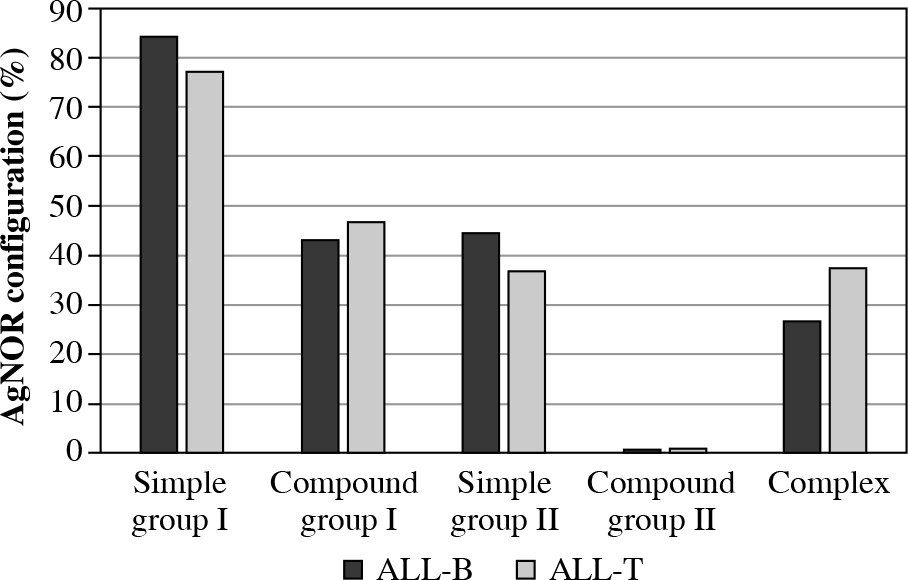
A statistically significant difference was found in the mean number of AgNOR between ALL-T and ALL-B among SD structures (p = 0.03) (Table 6, Fig. 5).
Fig. 5
AgNOR configuration distribution in ALL-B and ALL-T
AgNOR – argyrophilic nucleolar organizer regions, ALL – acute lymphoblastic leukemia
Discussion
The main goal of this study was to determine whether it is possible to use AgNOR staining for differentiation of acute leukemias in adults and the possibility of classification according to the severity of the disease. Available literature data show that the best diagnostic index of bone marrow proliferative diseases is the number of AgNOR [4, 23]. The advantage of the quantitative analysis based on counting each silver stained NOR under an optical microscope lies in its simplicity and low cost. In our research we used specifically developed software for AgNOR analysis, in which individual AgNOR structures were differentiated based on the size of their surface areas. This method of analysis is, in our opinion, quick, accurate and objective.
Klobusicka et al. noted a significantly higher number of AgNOR in bone marrow blastic cells in AML, compared to ALL [23]. In their research, Shome and Khurana also observed a significantly higher number of AgNOR in blastic cells in AML [24]. Nakamura et al., on the other hand, did not find a significant difference in the above index between the quoted leukemia types [25]. Our research showed a statistically higher mean number of AgNOR in the cell nucleus in AML [26]. The discrepancies between the quoted results may be due to the staining method used in our study, the significantly more numerous group of patients with AML (45 people in our study, 16 people in Klobusicka’s study), the analysis of acute leukemias without differentiating between adults and children (in the case of Klobusicka’s study), or the significantly higher number of blastic cells analyzed (500) (in the case of Nakamura) [23-25].
Nikicicz and Norback used the single-step silver staining technique proposed by Ploton for visualizing NORs in normal bone marrow cells. Based on the differences in size, structure, and shape, AgNOR were divided into two groups. Then, four subgroups were created in each group based on the distribution of individual AgNOR. Using this kind of AgNOR classification it was demonstrated that immature cells contain more AgNOR than mature ones and more often present with structure configuration classified as group II.
The AgNOR classification proposed by Nikicicz and Norback for the analysis of normal bone marrow was used in our study [22]. This analysis in relation to leukemic cells showed a significantly higher number of AgNOR in all structures with a surface area larger than 4.5 µm2 in AML blastic cells. In ALL, on the other hand, a significantly higher number of AgNOR was demonstrated only in the structures classified as medium dots (MD) (structure surface area up to 4.5 µm2). We have no possibility of comparing our data with special AgNOR configuration distribution with other studies. In the available medical databases, we were unable to find any paper on the comparative analysis of AgNOR in acute leukemias based on the above-mentioned classification.
Nikicicz and Norback reported that the blastic cells of normal bone marrow contain several AgNOR (3.5/cell on average) with complex configuration [22]. Complex configurations were more frequently observed in AML blastic cells in the research by Shome and Khurana [24]. In ALL, they detected the presence of group I structures in about 90% of blastic cells. In this study, the classification method by Nikicicz and Norback was simplified by dividing AgNOR into just two major groups (according to the surface area, as in our study) and disregarding the division into subgroups as we have done in our analysis. The results of our analysis of AgNOR configuration in acute leukemias in adults coincide with the results obtained by Shome and Khurana [24]. Our research results also show a higher incidence of complex configurations in AML. About 70% of blastic cells in AML showed the presence of group II AgNOR structures, half of which were in complex configuration. In ALL, about 60% of blastic cells showed the presence of simple or complex group I structures. The percentage distribution of individual structures in both leukemias is different in our study compared to the study by Shome and Khurana (in AML 45% of blastic cells showed the presence of group II AgNOR structures, which in 25% of cases were in complex configuration; in ALL over 90% of blasts showed the presence of simple or complex group I structures).
There is no single characteristic significantly dominant structure of AgNOR in any type of leukemia, although the pattern map is different in AML and ALL. Such a presentation of the results of AgNOR structures is innovative; there are no literature data. In our opinion, this could be a useful method for differentiating patients with different types of leukemia.
A further goal of this study was to analyze the number and configuration of AgNOR in relation to certain cytogenetic disorders. Leukemic clone dependent prognostic factors in AML are cytogenetic and molecular anomalies. In clinical practice, the cytogenetic classification developed by ELN is used for risk assessment [27]. Our study demonstrated statistically significant differences in the mean number of AgNOR between the quoted cytogenetic risk groups only in one structure group (LRB). The analysis of AgNOR configuration showed differences among simple structures in group I and mixed structures in group II.
It needs to be noted that in both leukemia types, the quoted configurations were not dominant. We are unable to compare our results to any other research. In their paper on AgNOR analysis in AML in adults, Pich et al. considered the cytogenetic disorders but only those related to chromosomal anomalies (chromosomal anomalies were found in 11 out of 26 individuals in whom such analysis was conducted) [21].
The presence of the BCR-ABL1 fusion gene in ALL is considered as an independent factor of very high risk. Such situations are an indication for conducting allo-HSCT during first remission, independent of the MRD status. The analysis of both the structure distribution and configuration of AgNOR in ALL with consideration to the presence of the Philadelphia chromosome did not demonstrate significant differences between groups that would allow for cytogenetic risk analysis. This may result from the relatively small number of ALL-B patients analyzed [22]. The fact of the presence of a statistically significantly larger number of AgNOR in ALL-T compared to ALL-B needs to be noted. In their research, Trere et al. found a significantly larger surface area of AgNOR in ALL-T in children [20].
The blastic cells in AML and ALL can be identified based on the quantitative analysis of AgNOR. Similarly, AgNOR configurations have some characteristic features.
Conclusions
The aim of our study was to establish the diagnostic and differentiating value of selected AgNOR parameters in AML and ALL blasts and to determine their weight power in relation to specific karyotypic and molecular disorders. The AgNOR staining method is a simple, fast and inexpensive research method, and analysis of selected AgNOR parameters may allow for a quick, preliminary assessment of genetic changes and assignment of the patient to a specific risk group. It is possible that finding a certain set of AgNOR features in combination with specific cytogenetic abnormalities would contribute to the prognosis in the acute leukemia patient group. This presentation of the results of AgNOR structures is innovative and can be a useful method of differentiating patients with acute leukemia types and prognostic assessment.
The study was conducted according to the guidelines of the Declaration of Helsinki and approved by the Institutional Review Board of the Military Institute of Medicine.
Informed Consent Statement: Informed consent was obtained from all subjects involved in the study.