Introduction
Schizophrenia is a severe and debilitating psychiatric disorder [1]. Many hypotheses have been postulated to explain the etiology of schizophrenia, and the abnormal neurodevelopmental hypothesis is one of the most widely acknowledged ones [2]. With the development of imaging technology, substantial progress in the diagnosis of schizophrenia has been made. In recent years, cerebral functional abnormalities in patients with schizophrenia have been shown in many neuroimaging studies [3–6]. Functional magnetic resonance imaging (fMRI), measuring the blood oxygenation level dependent (BOLD) signals to reflect intrinsic neural oscillations, is important for modulating cortical excitability during resting states [7]. Measuring the amplitude of low-frequency fluctuation (ALFF) with a BOLD signal is one way to explore regional neural function and has been correlated with local field potential activity [8]. At the same time, ALFF appears to be a biologically significant parameter for assessing regional brain function [9]. In resting state fMRI (rs-fMRI), low-frequency oscillations, especially in the 0.01–0.08 Hz band, are physiologically relevant and related to neuronal fluctuations in brain gray matter, making it an appropriate band to use when studying neuropsychiatric disorders [10–12].
Childhood-onset schizophrenia is a chronic and treatment-refractory psychiatric disorder continuous with and typically more severe than its adult counterpart [13, 14]. The clinical presentation of childhood-onset schizophrenia is similar to that of adult-onset schizophrenia, including such symptoms as psychosis, delusions, disorganization, flat affect and social withdrawal [15]. Previous studies pointed out that childhood-onset schizophrenic patients have reduced gray matter volume due to a loss occurring in childhood [16, 17]. Recent advances in neuroimaging research have brought new insights into functional and neural abnormalities in childhood-onset schizophrenia, as well as the developmental course of the disease in the brain as it matures [18].
The impact of obsessive-compulsive symptoms on functioning in schizophrenia is still debated. Schizophrenic patients with obsessive-compulsive symptoms were shown to have more severe psychotic and depressive symptoms and poorer quality of life [19]. High rates of comorbidity are found in childhood-onset schizophrenia; about 99% of the children with schizophrenia or schizoaffective disorder had at least one comorbid psychiatric illness [20]. In the present study, we used rs-fMRI to explore the functional changes in brain regions in COSO or COS.
Material and methods
Participants
We recruited child patients with schizophrenia from the Department of Psychiatry at the Second Affiliated Hospital of Xinxiang Medical University, Xinxiang, China, between October 2013 and March 2015. A total of 81 right-handed subjects were recruited, including 51 patients with childhood-onset schizophrenia (30 COS and 21 COSO) and 30 healthy controls. The study was approved by the Second Affiliated Hospital of Xinxiang Medical University ethical committee, and all patients and controls provided written informed consent for their participation. The diagnosis of childhood schizophrenia was based on the Structured Clinical Interview for DSM-IV (SCID-IV). Diagnoses of schizophrenia with or without obsessive-compulsive symptoms were determined by a consensus of the attending psychiatrist performing a clinical interview and a trained interviewer using the Yale-Brown Obsessive Compulsive Scale (Y-BOCS) [21, 22]. The cut-off score on the Y-BOCS to be assigned to the COSO group was 16 or above. Subjects with a total score of less than 16 were assigned to the COS group. The Positive and Negative Syndrome Scale (PANSS) was administered to all patients with schizophrenia 1 week after admittance to the hospital. The diagnostic definitions were established based on a formal diagnostic consensus discussion by clinicians with at least 2 years of experience. All patients were aged between 11 and 15 years. The course of the disease in patients was no longer than 12 months, and patients were naive for antipsychotic medication. We recruited healthy controls from a middle school of Xinxiang. All controls were screened using the Structured Clinical Interview, Non-patient version (SCID-NP) to confirm their personal as well as first-degree relatives’ lifetime absence of psychiatric and neurological illness. The intelligence quotient of all subjects was assessed using the Wechsler Intelligence Scale for Children (WISC). Complete demographic and clinical characteristics of the study sample are provided in Table I.
Table I
Subject demographics and clinical characteristics
Data acquisition
All subjects underwent structural and functional MRI scanning in a single session using a 3T MR system (TIM Trio, Siemens, Erlangen, Germany). Participants were instructed to relax with their eyes closed and to lie still without moving during the entire scan. Sponges were used to fix the subjects’ head to the coil to prevent motion artifacts. Patients were given a headset to reduce noise. Head three-dimensional (3D) images were obtained using 3D-magnetization prepared rapid acquisition gradient echo sequences (3D-MPRAGE). Parameters were used as follows: slice thickness = 1 mm, TR/TE = 2530 ms/2.43 ms, FOV = 256 × 256 mm2, flip angle = 7°. The MR images, sensitized to changes in BOLD signal levels (TR/TE = 2000 ms/30 ms, flip angle = 90°), were obtained using a gradient echo echo-planar imaging (EPI) sequence. A total of 33 axial slices with a slice thickness of 1 mm and no slice gap were obtained with a matrix size of 64 × 64 and a FOV of 220 × 220 mm2, resulting in a voxel size of 6 × 6 × 6 mm3. For each participant, the fMRI scanning lasted for 8 min, and 240 volumes were obtained.
Data preprocessing and ALFF computation
During rs-fMRI scanning, data from subjects with head translation movement of more than 2 mm or rotation of more than 2° were excluded from the study. For each subject, EPI images were slice-time-corrected and realigned to the first image in the first series. All realigned images were spatially normalized to the Montreal Neurological Institute (MNI) EPI template, and each voxel was resampled to 3 × 3 × 3 mm3. Preprocessing of fMRI, T1 weighting and computation of ALFF images were conducted using the REST toolbox [23]. After band-pass filtering (0.01–0.08 Hz) [10] and linear trend removing, the time series was transformed to frequency domains using fast Fourier transforms (FFTs) (parameters: taper percent = 0, FFT length = shortest) and the power spectrum was obtained. Because the power of a given frequency is proportional to the square of the amplitude of the frequency component, the power spectrum obtained by FFT was square-rooted and then averaged across 0.01–0.08 Hz at each voxel. This averaged square root was taken as the ALFF value. For standardization purposes, the ALFF of each voxel was divided by the global mean ALFF value.
Statistical analysis
The data obtained from our experiments were presented as mean ± standard deviation (SD) and analyzed using the analysis of variance (ANOVA) test, Student’s t test and Pearson’s χ2 test that were a part of the SPSS software (version 17.0). P < 0.05 was considered statistically significant.
Results
There were no significant differences in age, sex, illness duration, handedness or head motion among the three groups. The shift of all subjects was no more than 2 mm, and rotation was lower than 2°.
We found ALFF values in the typical frequency band (0.01–0.08 Hz). Compared with controls, the COS group showed significantly increased ALFF in the right caudate body, middle temporal gyrus and inferior parietal lobule, while demonstrating decreased ALFF in the left cerebellum posterior lobe (Table II and Figure 1). Compared with controls, the COSO group had increased anterior power in the left and right frontal lobe, cerebellum posterior lobe and precuneus (Table III and Figure 2). In addition, when comparing the COS group with the COSO group, the COSO group showed significantly higher ALFF in the left cerebellum posterior lobe, frontal lobe, supramarginal gyrus, precuneus, right inferior frontal gyrus and medial frontal gyrus. Interestingly, significantly lower values of ALFF were found in the right fusiform gyrus, corpus callosum and inferior parietal lobule in the COSO group, compared with the COS group (Table IV and Figure 3).
Table II
Regions with ALFF (0.01–0.08 Hz) differences in controls and COS subjects
Table III
Regional differences in ALFF values (0.01–0.08 Hz) in controls and COSO subjects
| Brain region | Cluster size | Peak coordinates (MNI) | T-values | ||
|---|---|---|---|---|---|
| x | y | z | |||
| L cerebellum posterior lobe | 72 | 0 | –69 | –21 | 3.3655 |
| R frontal lobe | 362 | 9 | 54 | 36 | 3.7762 |
| L frontal lobe | 265 | –36 | 15 | 21 | 4.7388 |
| L precuneus | 40 | –15 | –63 | 30 | 3.3178 |
Table IV
Regional differences in ALFF values (0.01–0.08 Hz) in COS and COSO subjects
Figure 1
Comparisons of the ALFF between COS and normal controls (p < 0.05, AlphaSim corrected). The red color represents higher ALFF values in the COS group, whereas blue color represents lower ALFF values. Compared with controls, the COS group showed significantly increased ALFF in the right caudate body, middle temporal gyrus and inferior parietal lobule, while showing decreased ALFF in the left cerebellum posterior lobe
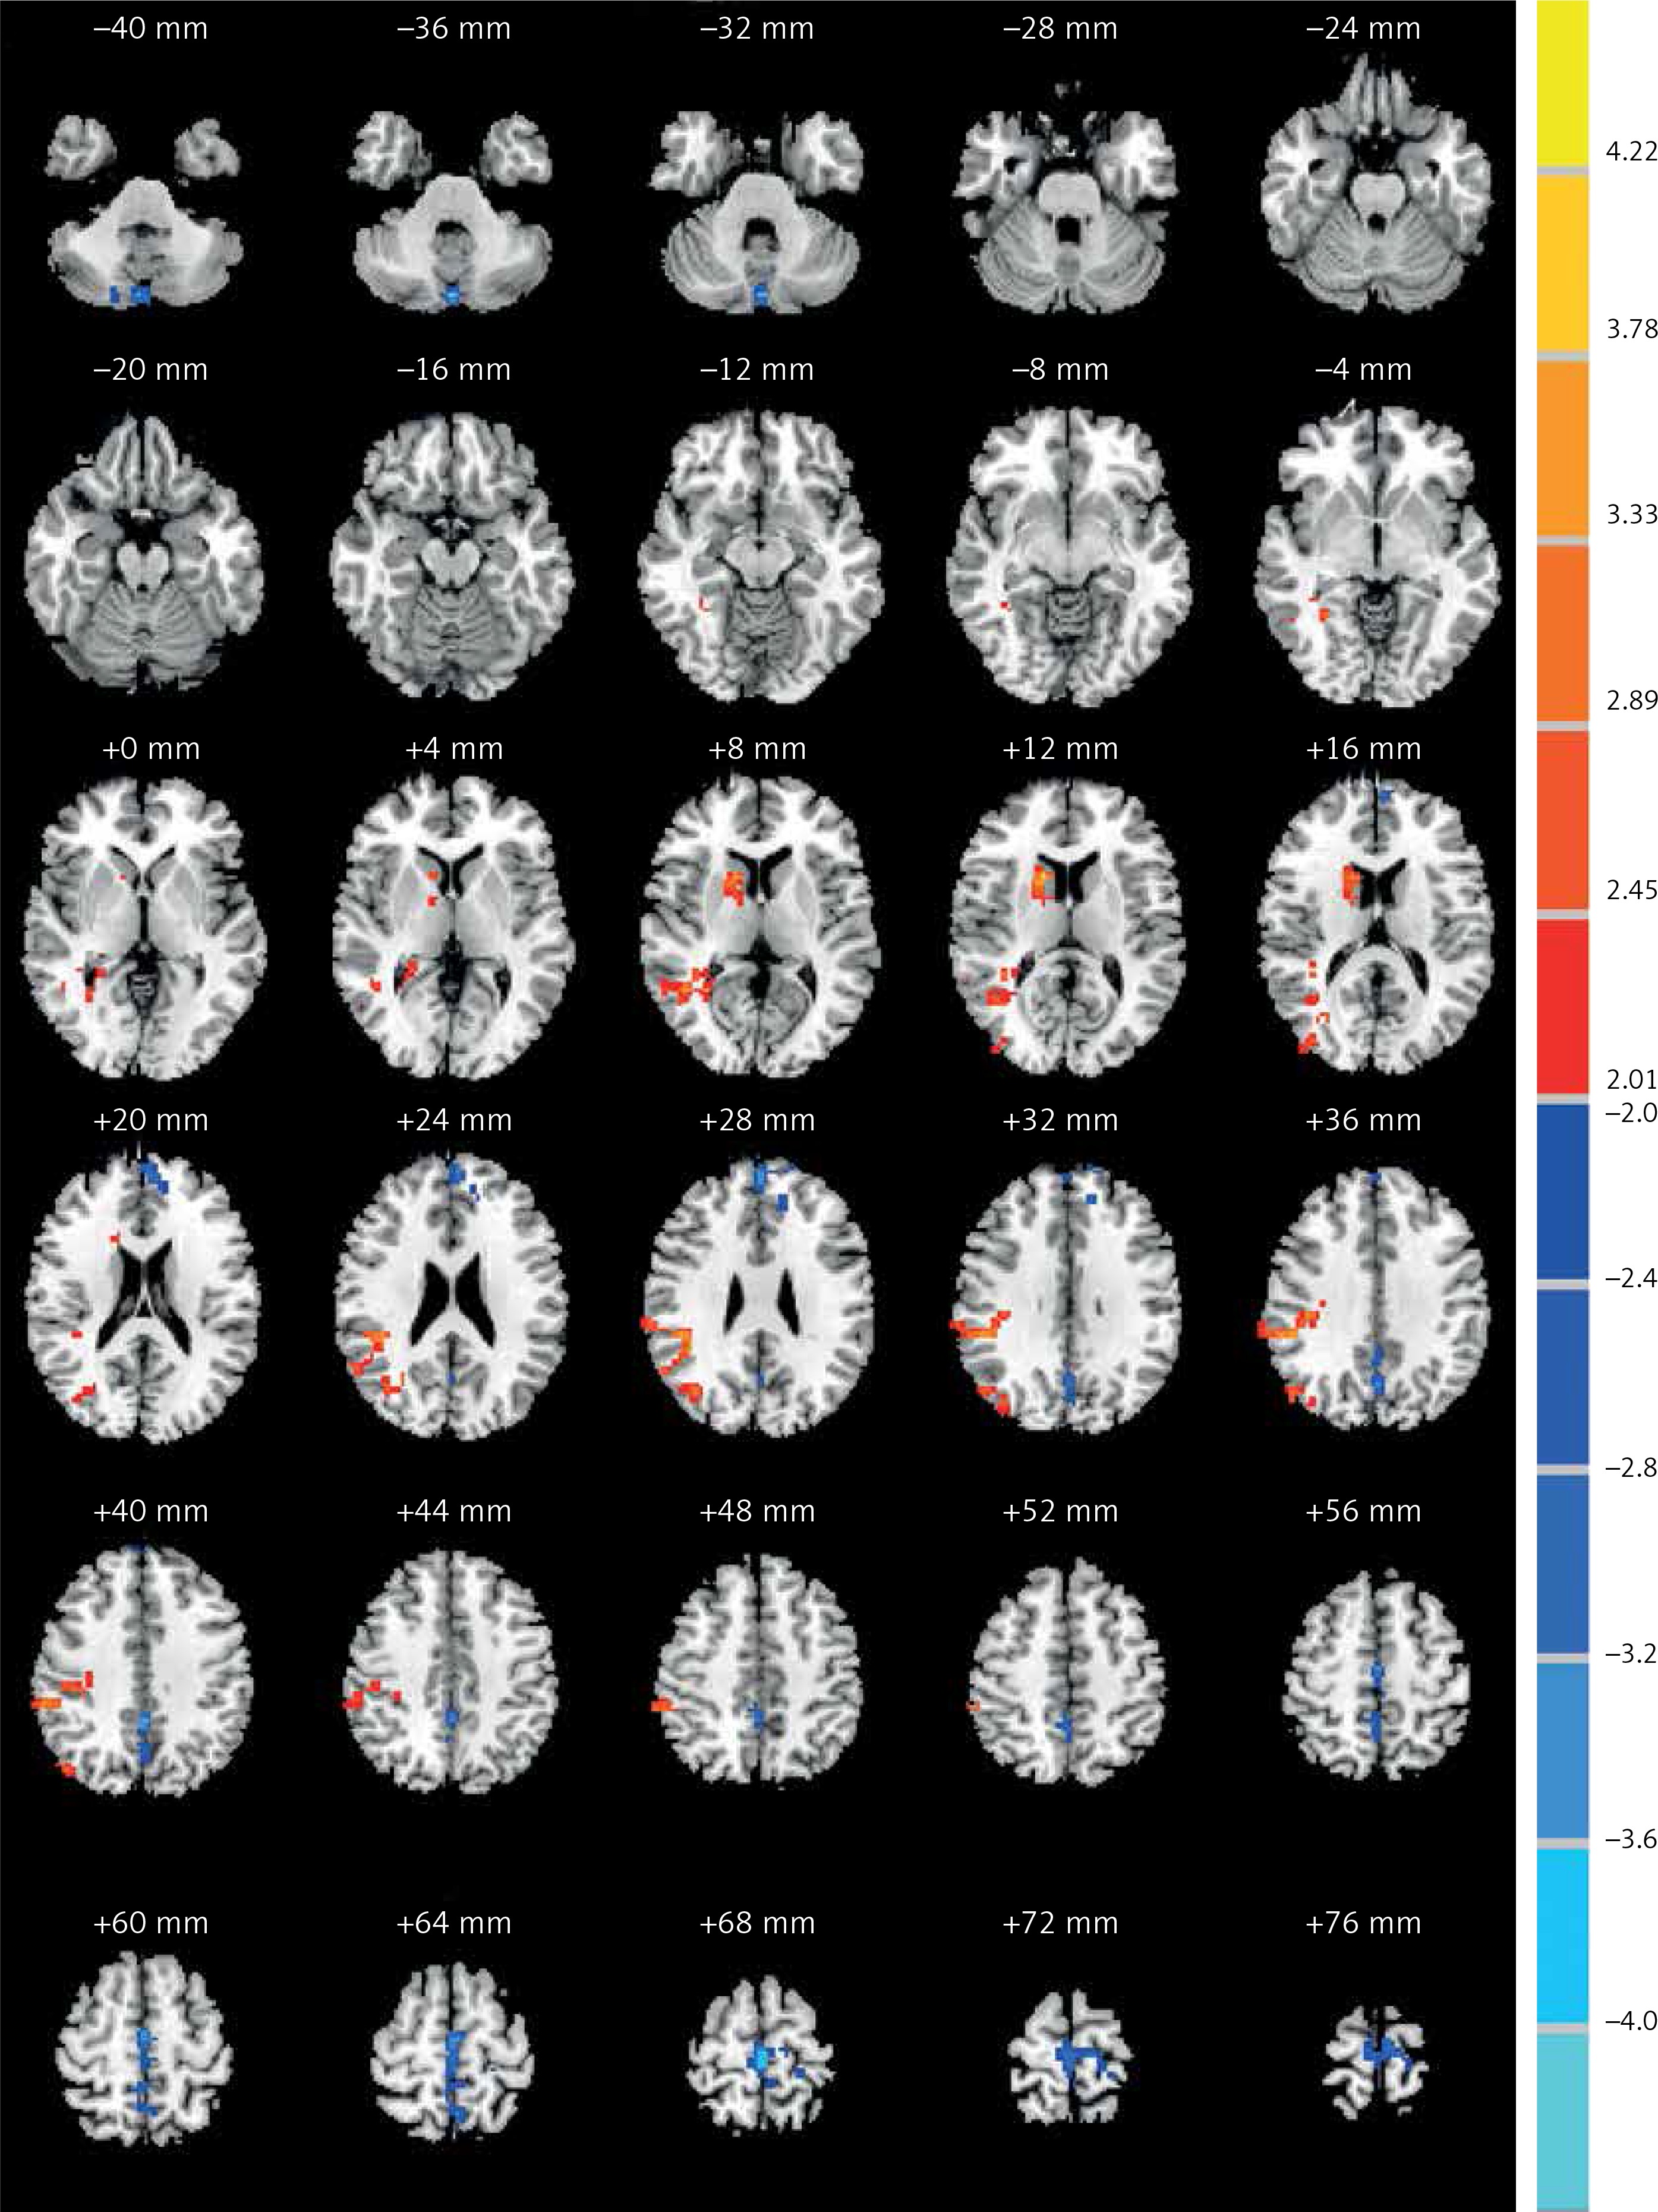
Figure 2
Comparisons of the amplitude of ALFF between COSO and normal controls (p < 0.05, AlphaSim corrected). The red color represents higher ALFF values in the COSO group. Compared with controls, the COSO group showed significantly increased ALFF in the left and right frontal lobe, cerebellum posterior lobe and precuneus
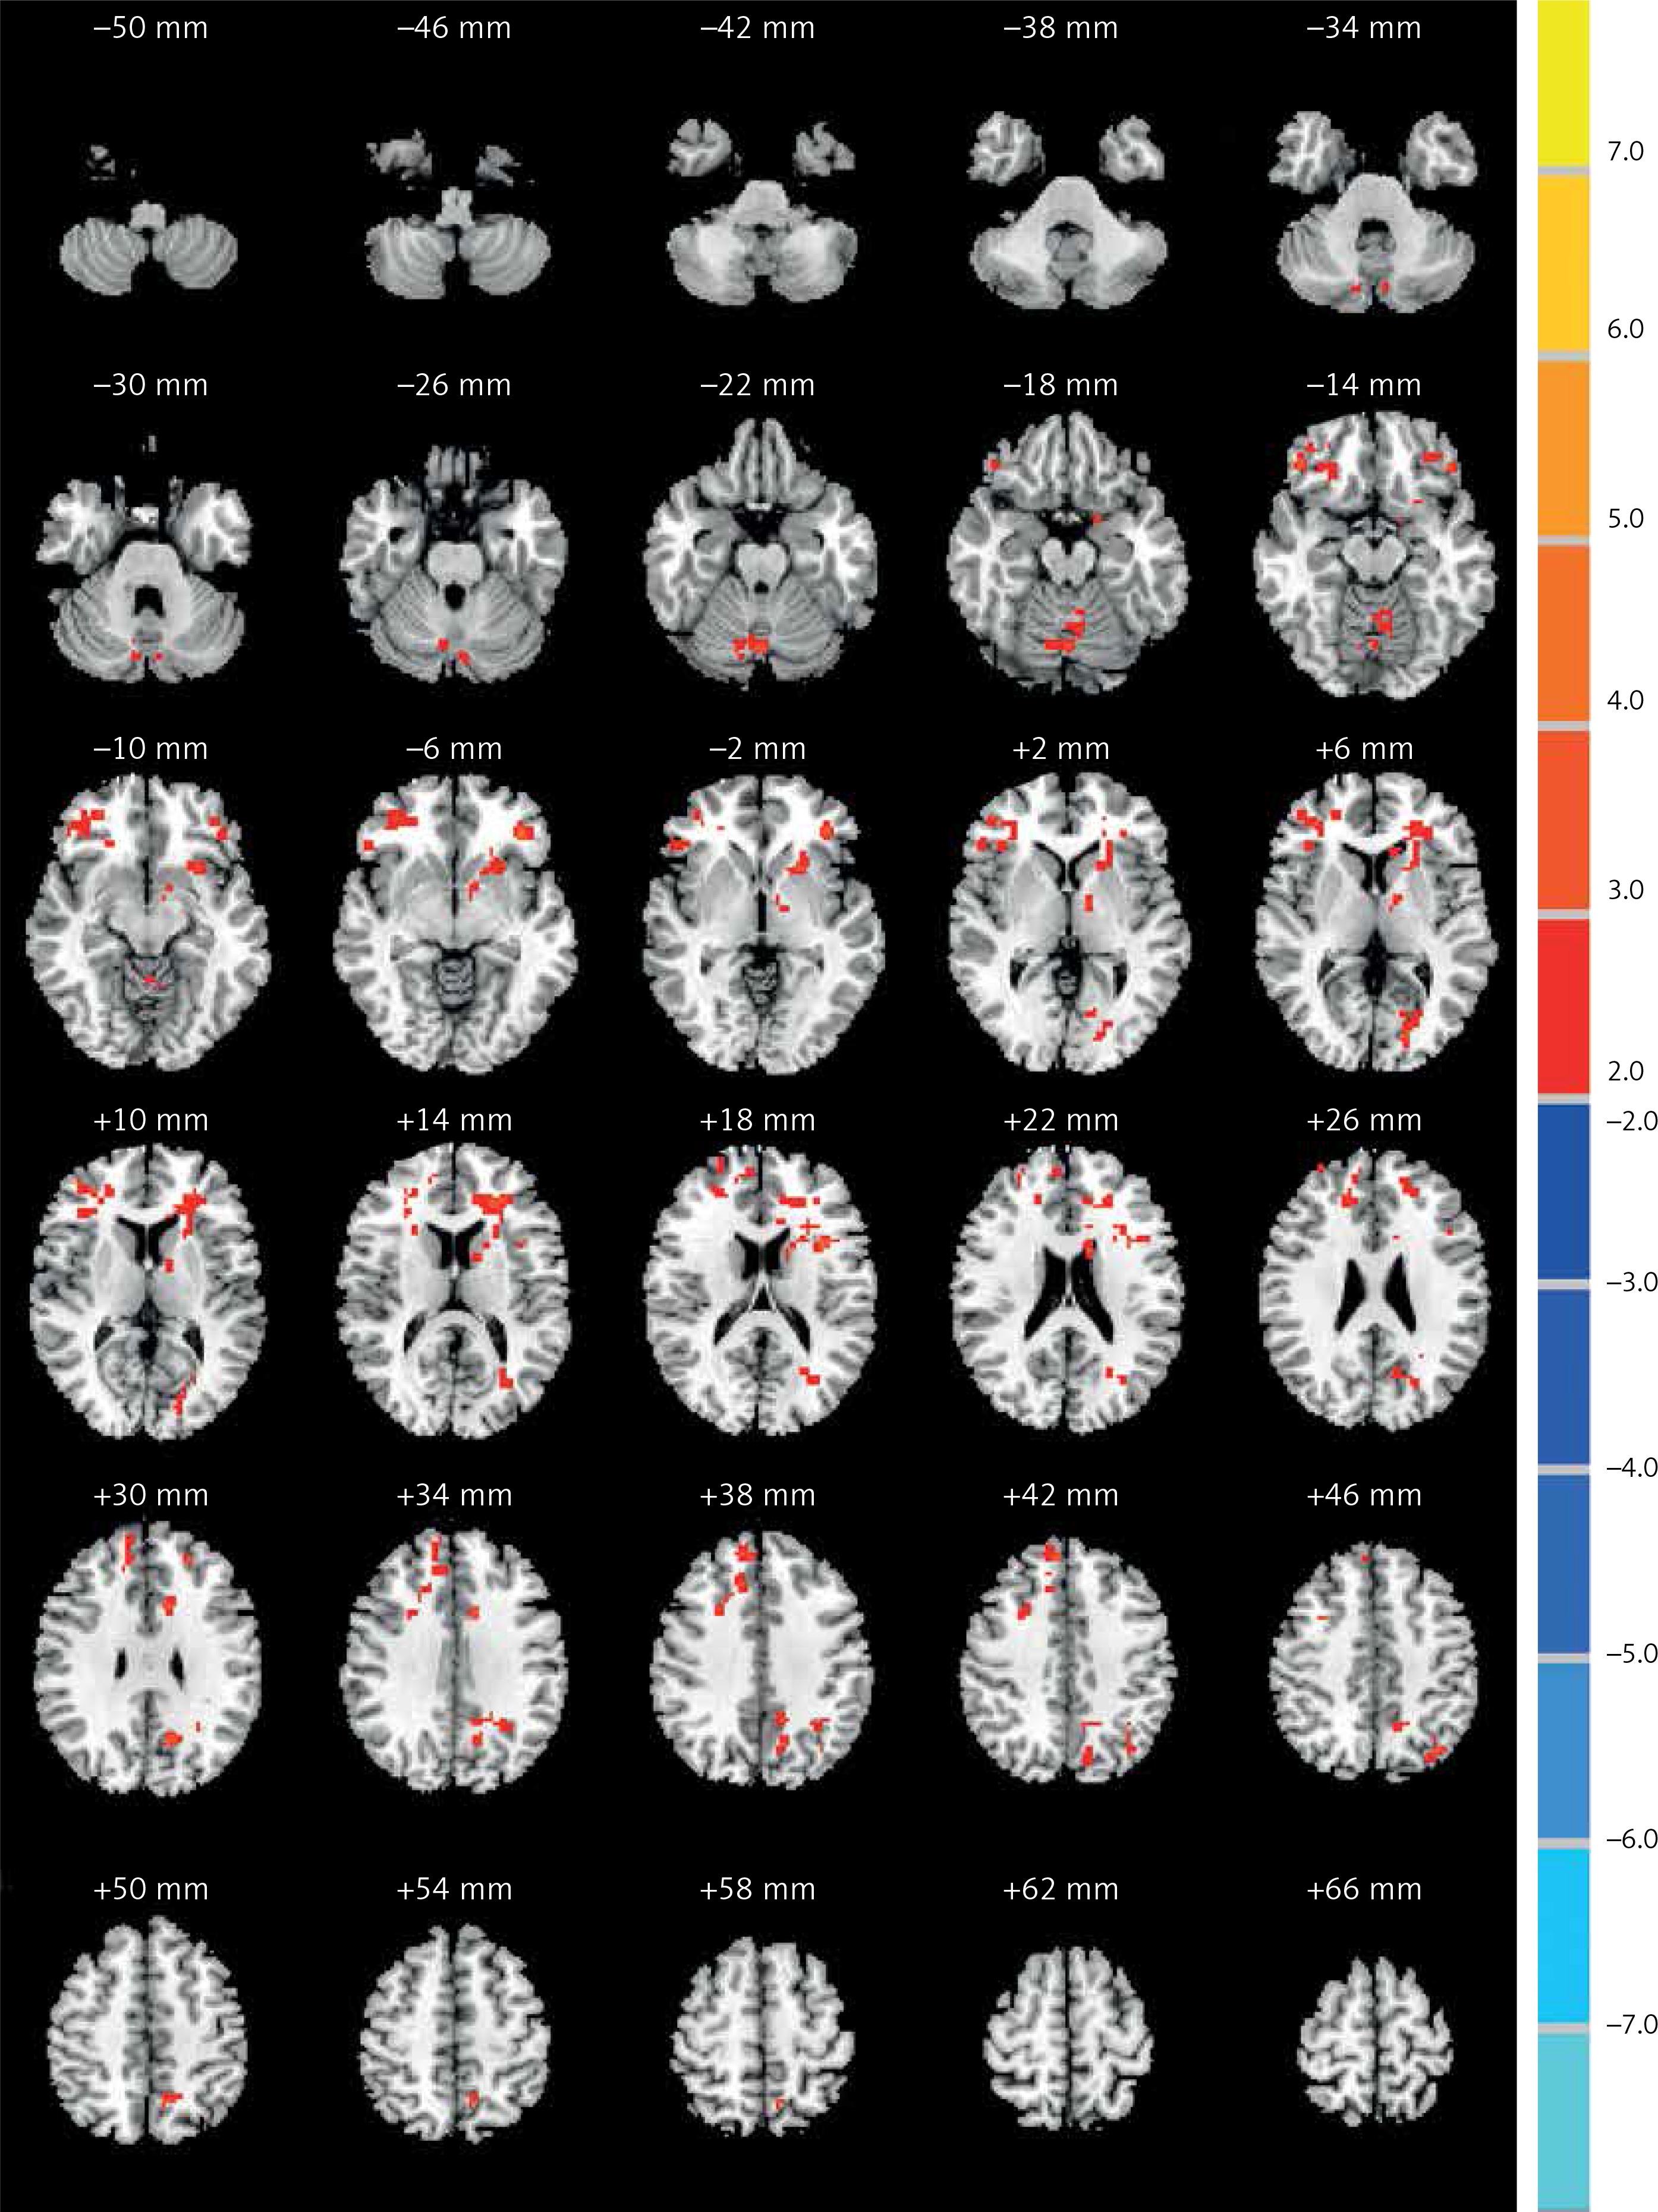
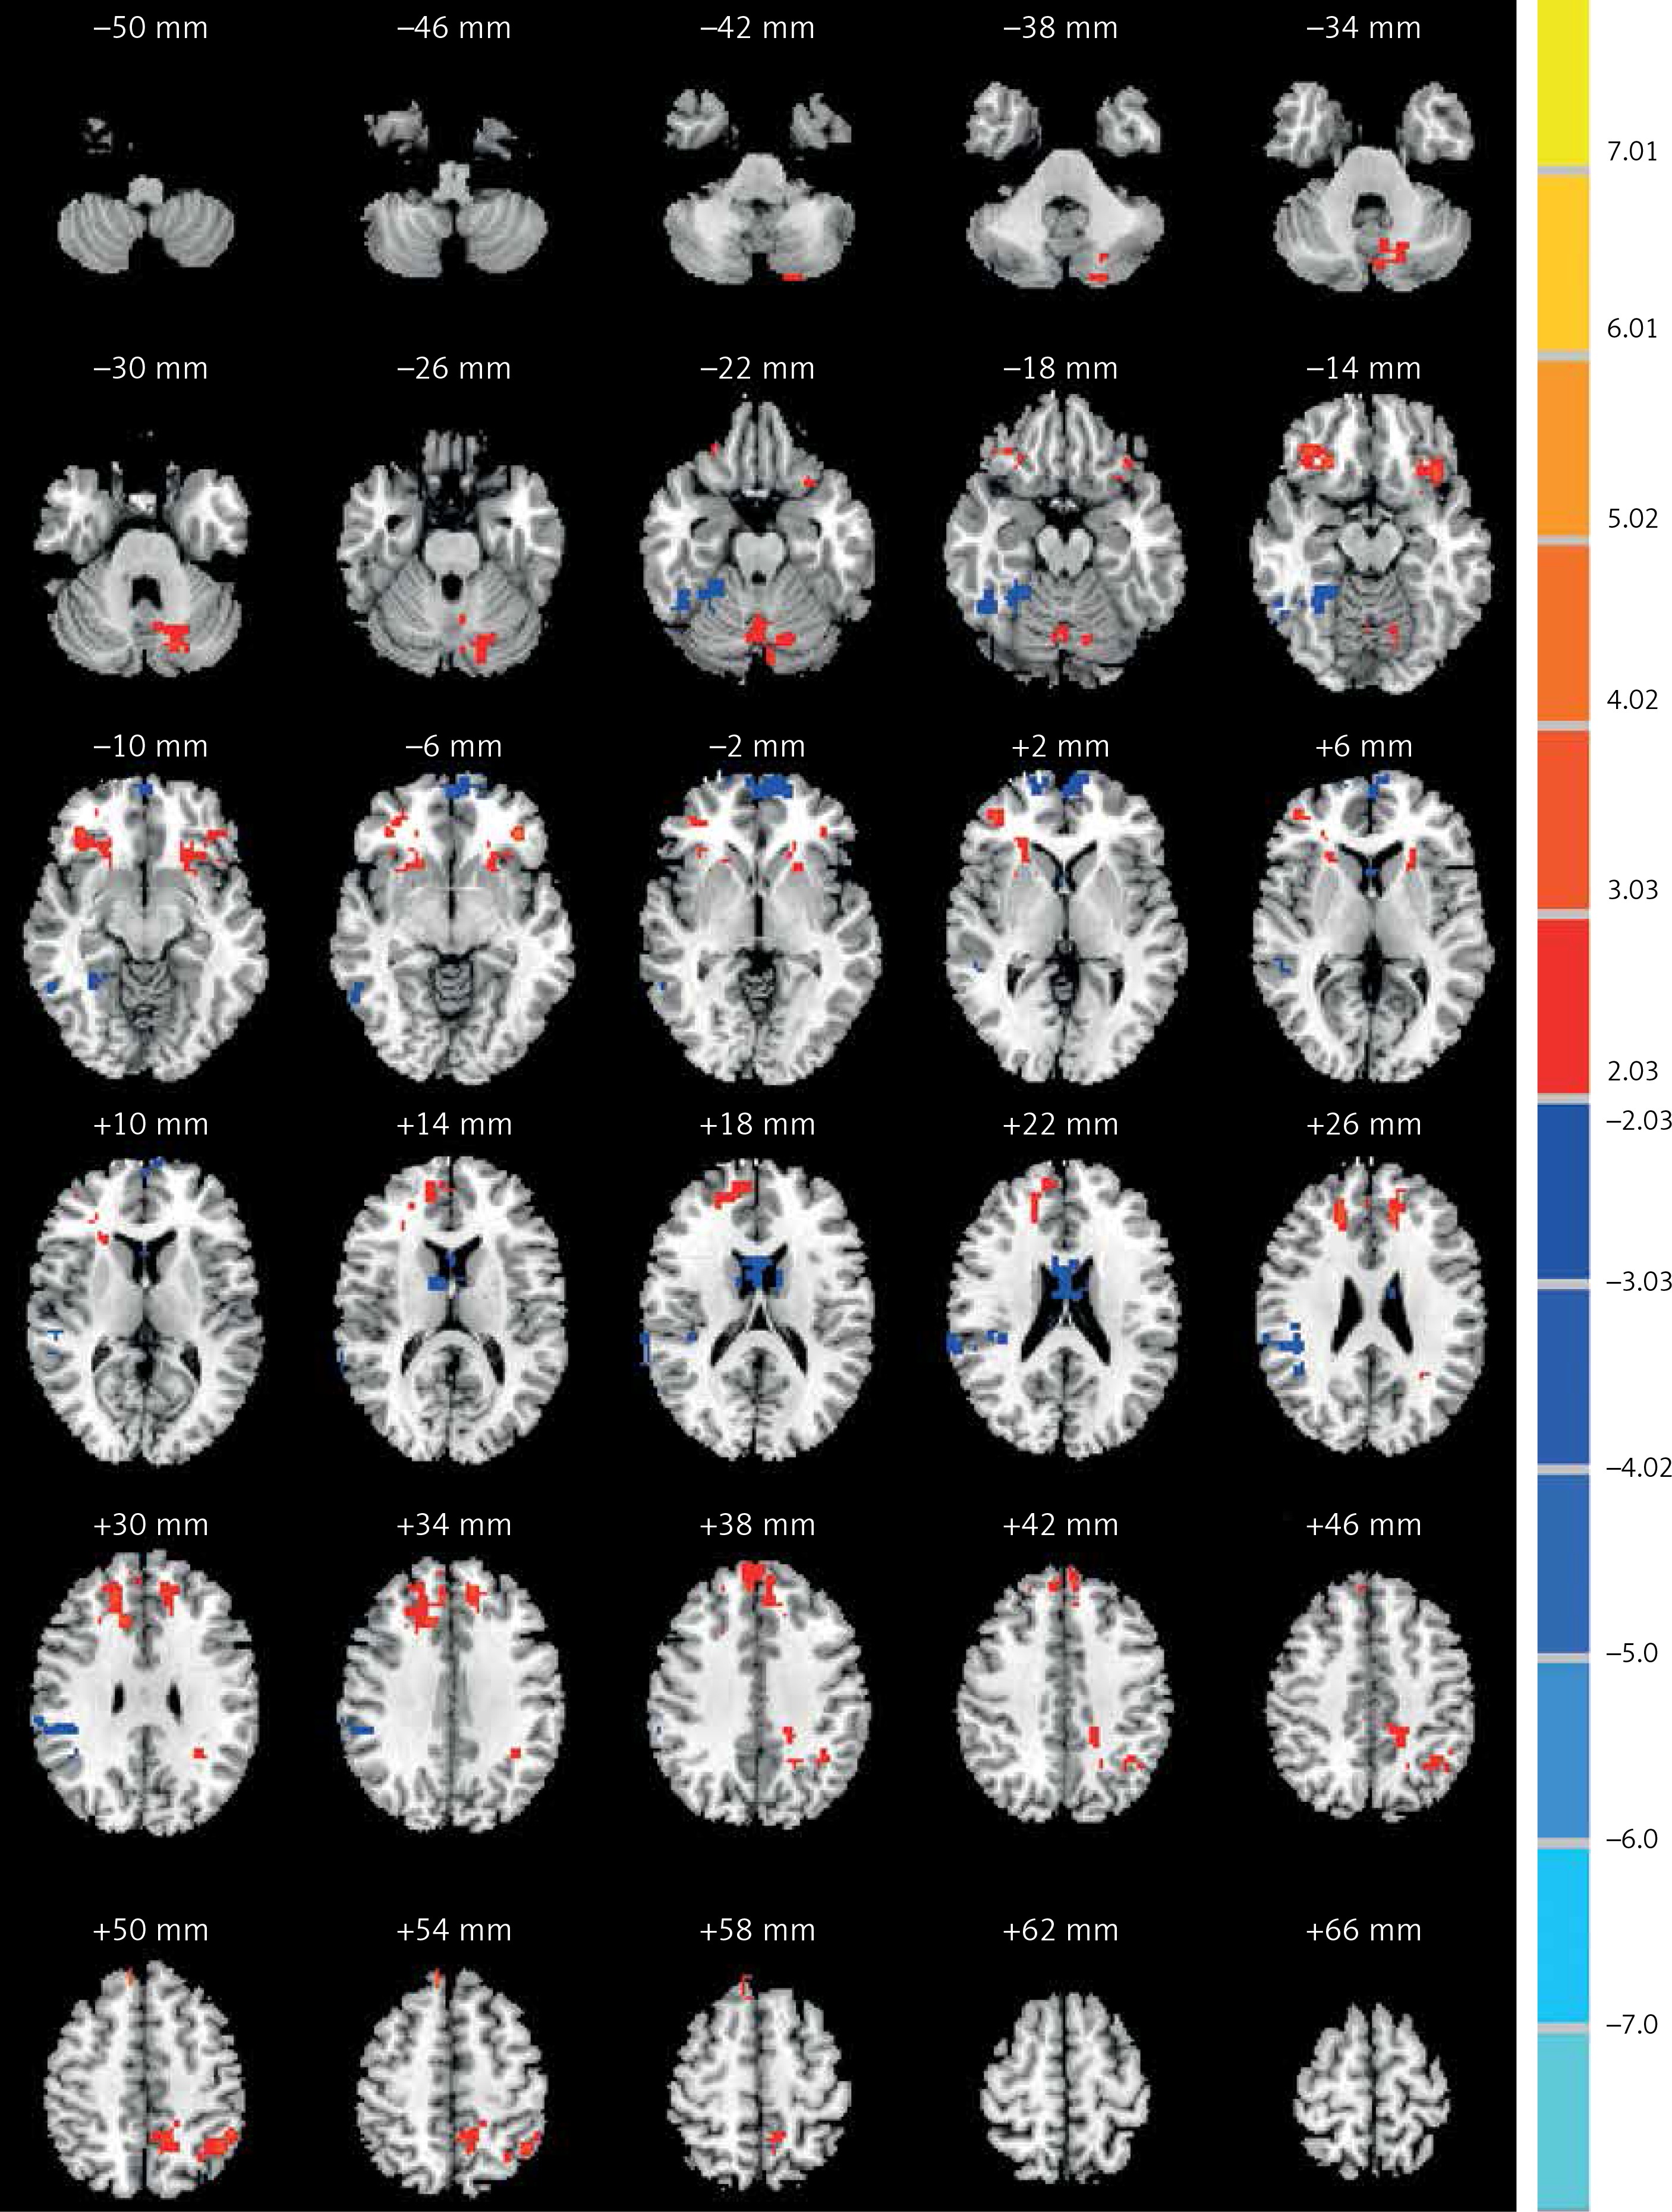
Figure 3
Comparisons of the amplitude of ALFF between COS and COSO (p < 0.05, AlphaSim corrected). The red color represents higher ALFF values in the COSO group, whereas blue color represents lower ALFF values. Compared with COS, the COSO group showed significantly higher ALFF in the left cerebellum posterior lobe, frontal lobe, supramarginal gyrus, precuneus, right inferior frontal gyrus and medial frontal gyrus, while lower ALFF was observed in the areas of the right fusiform gyrus, corpus callosum and inferior parietal lobule
Discussion
In the present study, we examined changes of ALFF in COS and COSO. Compared with normal controls, we found that the COS group showed increased ALFF in several brain regions, including the right caudate body, middle temporal gyrus and inferior parietal lobule, but a decrease in the left cerebellum posterior lobe. Overall, the COSO group only showed increased ALFF in the left and right frontal lobe, cerebellum posterior lobe and precuneus. Moreover, by comparing COSO and COS subjects, we found higher ALFF in COSO subjects in the left cerebellum posterior lobe, frontal lobe, supramarginal gyrus, precuneus, right inferior frontal gyrus and medial frontal gyrus, as well as lower ALFF in the right fusiform gyrus, corpus callosum and inferior parietal lobule. To the best of our knowledge, this is the first study to examine altered ALFF in COS and COSO patients.
Based on investigating children of schizophrenia patients and their unaffected first-degree relatives, researchers have found that increased striatal dopamine neurotransmission may be a prodromal sign of schizophrenia [24, 25]. A recent rs-fMRI study found higher ALFF in the medial frontal gyrus, which was confirmed by another study conducted in first-episode schizophrenic patients [26, 27]. In the present study, we found increased ALFF in the right caudate body. A previous study reported increased ALFF values in this region after treatment with antipsychotic medications [28]. We also found increased ALFF in the middle temporal gyrus. By investigating subjects with a high genetic risk of schizophrenia, researchers found increased ALFF in the left medial temporal region [24]. Recent studies also suggest structural and neurochemical abnormalities in the medial temporal lobe [29, 30]. The results of our study also show increased ALFF in the right inferior parietal lobule and cerebellum posterior lobe. Thus, our data suggest that abnormal ALFF in COS can provide a promising basis to distinguish COS children from healthy children.
Prefrontal cortex abnormalities are among the most commonly reported changes in schizophrenia. Studies have found that prefrontal cortical deficits are present throughout the disease course and represent the neural pathway of working memory deficits in schizophrenia [31, 32]. More studies have reported that the medial prefrontal lobe is assumed to play an important role in emotional processing and behavior regulation [33, 34]. By using fMRI, we found increased ALFF in the frontal lobe of COSO patients. We have found no reports about abnormal ALFF in COSO. However, some researchers found that first-episode schizophrenic patients showed decreased ALFF in the medial frontal lobe, which is consistent with the findings reported by Huang et al. [27]. Previous researchers have generally studied resting-state functional connectivity abnormalities in patients with obsessive-compulsive disorder [35, 36]. In our current study, we found increased ALFF in the left cerebellum posterior lobe, which is inconsistent with the result of the aforementioned study. In addition, our study also found higher ALFF in the precuneus. All previously mentioned findings indicate that obsessive-compulsive symptoms impact the brain function in schizophrenia. All aforementioned results provide a reference method to distinguish COSO from the general population and support the hypothesis that functional cerebral alternations play a role in the pathophysiology of COSO.
After comparing COS and COSO groups, we found some increased and a few decreased cerebral areas in COSO patients. To the best of our knowledge, this is the first study reporting abnormal ALFF values in these particular patients using resting-state fMRI. Compared with controls, COSO showed similarly increased ALFF values in the left cerebellum posterior lobe. In contrast, COS showed opposite results in the left posterior lobe. By comparing our results, the result would most likely be affected by obsessive-compulsive symptoms. The current results may provide new insight into the pathophysiology of this complex disorder and may provide a measure of its diagnostic sensitivity.
In conclusion, COSO or COS showed different abnormal brain changes of ALFF during the resting state. Obsessive-compulsive symptoms may have effects on brain function. Alterations of ALFF in patients suggest that unique regional differences can be found to distinguish COS and COSO from controls. Importantly, this result suggests that frequency-sensitive physiological mechanisms could act as a novel standard of diagnosis for patients with childhood-onset schizophrenia.