Introduction
Ovarian cancer is the leading cause of death from gynecologic cancer in the developed world, with over 220,000 new cases and 140,000 deaths worldwide in 2008 [1–3]. Ovarian cancer is also a multifactorial disease, as is true of most carcinomas. Genetic factors play an important role in ovarian cancer susceptibility [2, 4].
The genetic factors responsible for ovarian carcinogenesis have been investigated in many studies. MLH1, MSH2, BRCA1, BRCA2, LIN28B, CASP8, SMAD6, RAD51C, RAD51D, RB1, MTDH, and GADD45A have all been implicated in ovarian cancer [1, 5–13]. Three genome-wide association studies (GWAS) have revealed a strong association between ovarian cancer risk and several common susceptibility alleles in four loci [2, 14–16]. The examination of genetic polymorphisms may explain individual differences in cancer risk [17]. However, the results of the three GWAS were not unanimous. Thus, further investigation is required to identify the genes that are associated with a predisposition to ovarian cancer [1, 10].
XRCC2 (X-ray repair cross-complementing group 2), located at 7q36.1, is a functional candidate gene in neoplasia [18, 19]. XRCC2/3 interacts with and stabilizes Rad51, and takes part in the HRR (homologous recombination repair) of DNA DBSs (double-strand breaks) and in cross-link repair in mammalian cells [20–22]. XRCC2 polymorphism has been associated with the risk of many cancers, such as breast cancer, prostate cancer, gastric cancer, and thyroid carcinoma [23–27].
Although the association between XRCC2 polymorphism and ovarian cancer has been studied [28–35], the experimental results remain inconclusive. Furthermore, while meta-analyses of XRCC2 polymorphism and ovarian cancer risk have also been performed [8, 19, 25, 36, 37], the results need to be supplemented. To examine the effect of XRCC2 polymorphism on ovarian cancer risk, we performed a meta-analysis.
Material and methods
Search and selection process
We performed the meta-analysis by following the Preferred Reporting Items for Systematic Reviews and Meta-Analyses (PRISMA) criteria [38]. We searched the PubMed database using combinations of the following keywords: “XRCC2”, “X-ray repair cross-complementing group 2”, “rs3218536”, “Arg188His”, “R188H”, “ovarian cancer”, and “polymorphism”. Two authors, Yuan and Yan, independently examined the retrieved references to evaluate their appropriateness for inclusion in this meta-analysis. In addition, we investigated all of the references cited in the articles and the relevant reviews. If an article reported results that included a number of studies, each study was treated as a separate comparison in our meta-analysis.
Included studies required the following 3 criteria:
Data extraction
The data were independently extracted from selected articles according to the pre-specified criteria by the two authors (Yuan and Wang). All of the necessary information, if available, was extracted from each study, including the first author, publication year, country, area of the cases, ethnicity, cases’ source, controls’ source, sample type of the cases, the total number of cases and controls, and the genotype distributions of XRCC2 in both the cases and controls [39]. Disagreements were resolved by joint review and consensus.
Quality score assessment
Eleven studies were independently evaluated by two authors according to a previously established scale for quality assessment (Table I) [2, 40]. The quality score assessment was carried out according to the following criteria: “source of cases”, “source of controls”, “specimens of cases for determining genotypes”, “Hardy-Weinberg equilibrium in controls” and “total sample size”. The total scores ranged from 0 (worst) to 15 (best). Studies scoring ≥ 10 were defined as “high quality”, while those scoring < 10 were defined as “low quality” [2, 40, 41].
Table I
Scale for quality assessment
Statistical analysis
We pooled ORs with 95% CIs, according to the genotype frequencies of the case and control groups, to assess the strength of the association between the XRCC2 polymorphism and ovarian cancer susceptibility [42]. A p-value < 0.05 was considered statistically significant. All of the tests and CIs were two-sided. If the heterogeneity was significant, the pooled ORs were initially measured using the random effects model. Otherwise, the fixed effects model was chosen [41, 43].
XRCC2 polymorphism and ovarian cancer risk analysis was carried out for a homozygote comparison (AA vs. GG), a heterozygote comparison (GA vs. GG), a dominant genetic model (GA + AA vs. GG), and a recessive genetic model (AA vs. GG + GA). In addition, a sensitivity analysis was carried out by omitting each study. Publication bias was examined using a funnel plot. The degree of asymmetry was estimated by Egger’s test (p < 0.05 was considered significant publication bias) [2] [44, 45]. The analysis was completed using Review Manager statistical software (RevMan version 5.0.17.0, The Nordic Cochrane Center, Rigshospitalet, Copenhagen, Denmark) and STATA software (version 11.2, Stata Corporation, College Station, TX, USA). Hardy-Weinberg equilibrium (HWE) was calculated using a web-based statistical tool (http://ihg.gsf.de/cgi-bin/hw/hwa1.pl) [2].
Results
Study characteristics
Through the article search, we found 24 articles. Of these articles, we excluded 16 because the studies were irrelevant. We also excluded one article [32] because the study did not report the relevant genotype frequencies. Although we contacted the study’s authors for the genotype frequencies, we did not obtain the genotype frequencies of rs3218536 from that article. Thus, a total of 7 articles included 11 studies [28, 30, 31, 33–35, 46] of 5,802 ovarian cancer cases and 9,390 controls. The study flowchart is shown in Figure 1. The 7 articles were all published in English. The characteristics of the 11 studies from the 7 articles are summarized in Table II. The subjects in 10 of the studies [28, 30, 31, 33, 35, 46] were Caucasian. In the 1 other study, Caucasians comprised 94% of the mixed subject group [34]. Thus, most of the subjects in these 11 studies were Caucasian. The sample sizes, including cases and controls, ranged from 100 to 1,811, and the total sample sizes ranged from 200 to 3,124. The quality scores for the individual studies ranged from 5 to 12. The quality scores for 8 of the studies (72.7%) were classified as high quality (≥ 10).
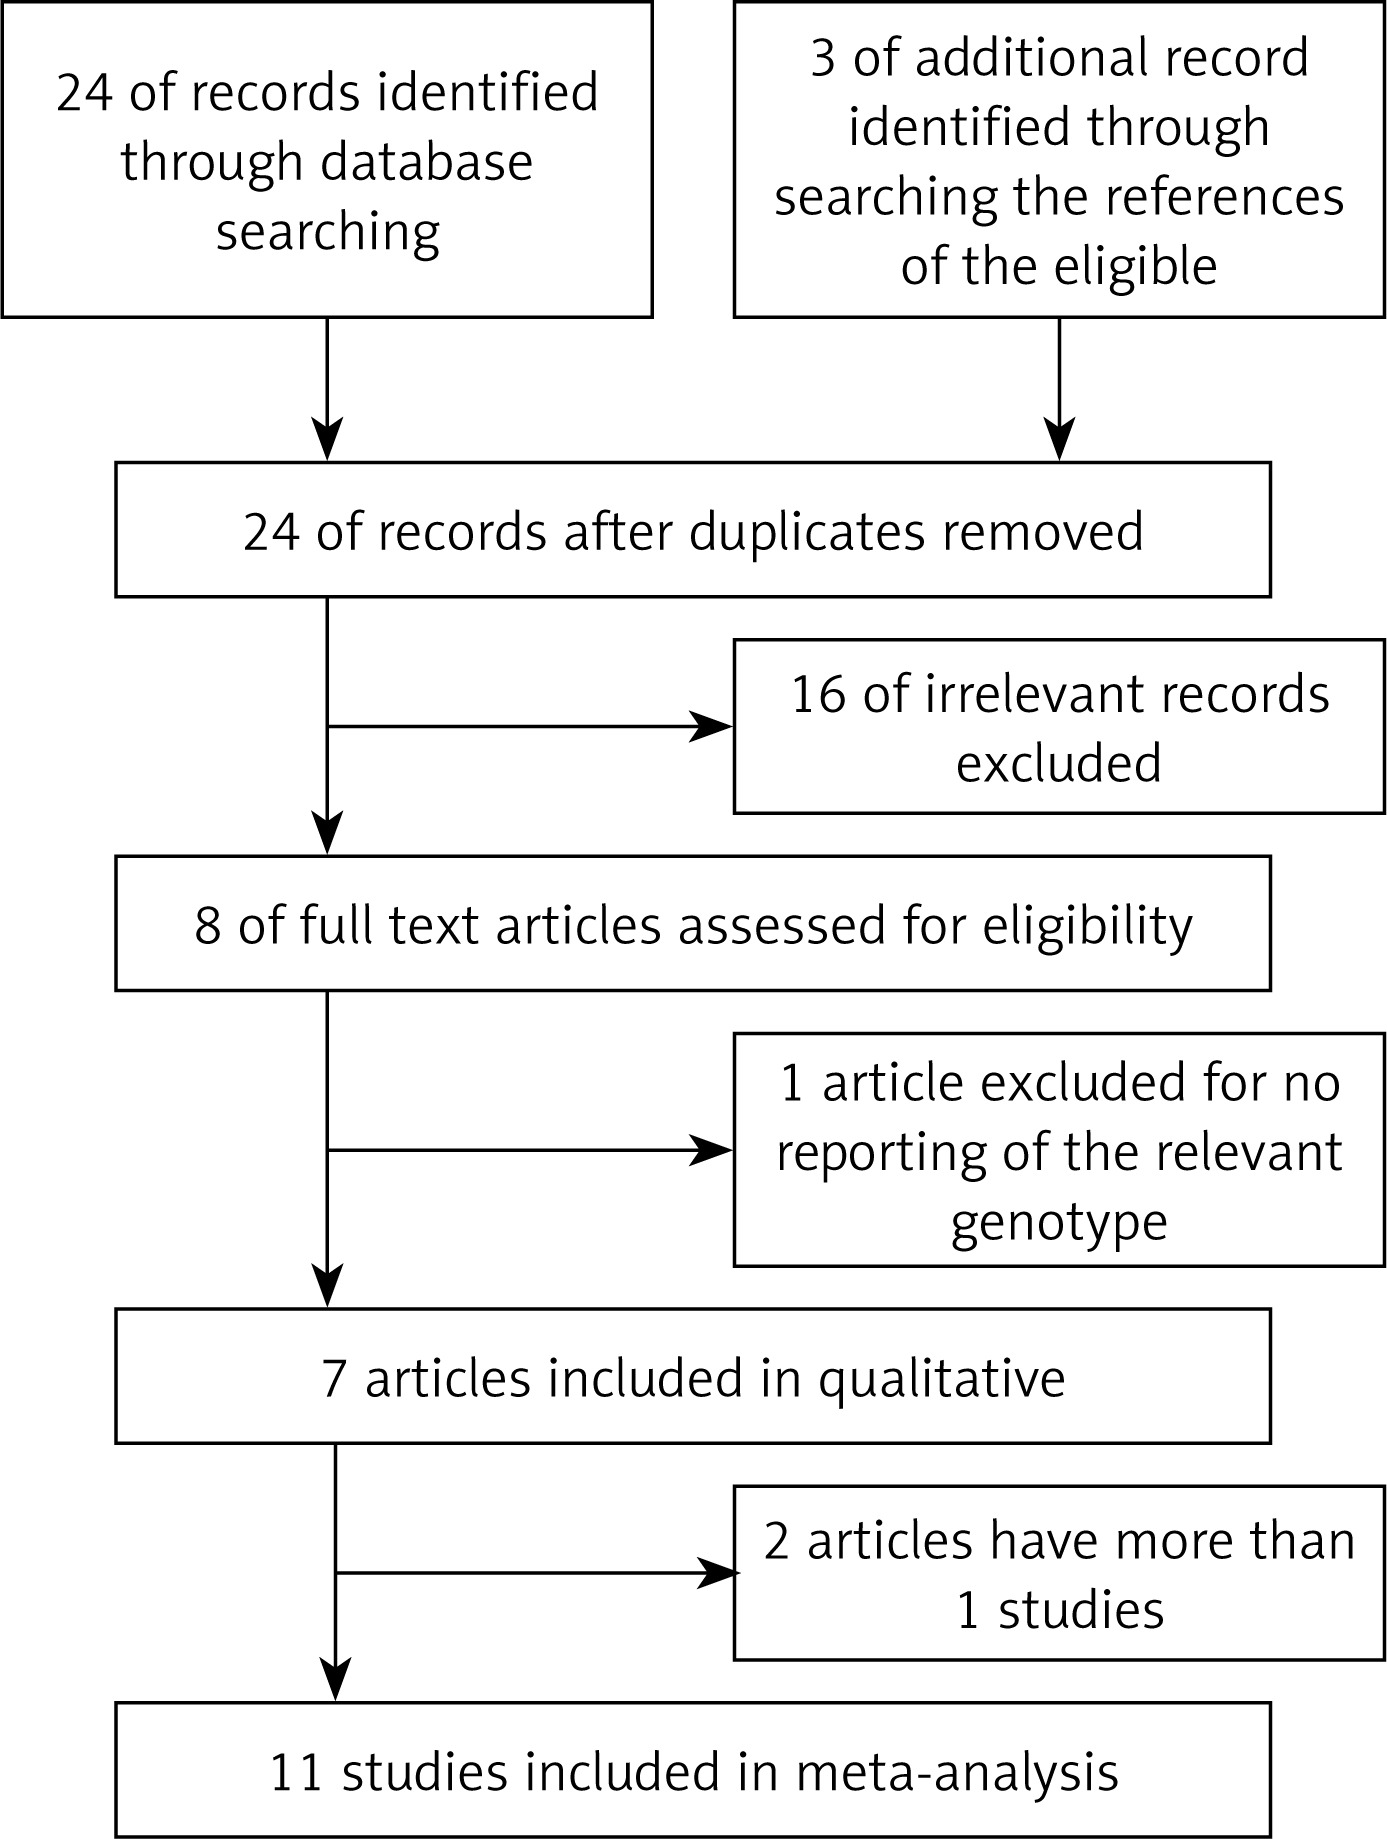
Table II
Main characteristics of the 11 studies included in the meta-analysis
The distribution of the XRCC2 rs3218536 polymorphism genotype frequencies among the ovarian cancer cases and controls from the 11 studies is shown in Table III. A Hardy-Weinberg disequilibrium of genotype frequencies among the controls was calculated in 11 studies [28, 30, 31, 33–35, 46]. In 7 studies [31, 33–35], the genotype distribution among the control groups was in agreement with HWE (p > 0.05). In 3 studies [28, 30, 35], the genotype distribution among the control groups was not in agreement with HWE (p < 0.05). In 1 study [46], the genotype distribution among the control groups was not estimable.
Table III
Distribution of the XRCC2 rs3218536 genotype among ovarian cancer cases and controls included in the meta-analysis
Meta-analysis results
The meta-analysis results of the XRCC2 rs3218536 polymorphism are shown in Tables III and IV, and Figure 2. When all 11 studies were pooled in the meta-analysis, no statistically significant associations between the XRCC2 rs3218536 polymorphism and ovarian cancer risk were found in any of the genetic models (AA vs. GG: OR = 0.96, 95% CI: 0.36–2.53, p = 0.94; GA vs. GG: OR = 0.80, 95% CI: 0.62–1.02, p = 0.07; GA + AA vs. GG: OR = 0.95, 95% CI: 0.79–1.14, p = 0.57; AA vs. GG + GA: OR = 0.90, 95% CI: 0.43–1.89, p = 0.78). However, when the high quality studies were pooled in the meta-analysis, a significant relationship with ovarian cancer risk was discovered (AA vs. GG: OR = 0.59, 95% CI: 0.37–0.94, p = 0.03; GA vs. GG: OR = 0.87, 95% CI: 0.78–0.96, p = 0.009; GA + AA vs. GG: OR = 0.85, 95% CI: 0.77–0.94, p = 0.003; AA vs. GG + GA: OR = 0.60, 95% CI: 0.38–0.95, p = 0.03).
Figure 2
Forest plot summary of ORs and 95% CIs for the association between the XRCC2 rs3218536 polymorphism and ovarian cancer risk in all genetic models
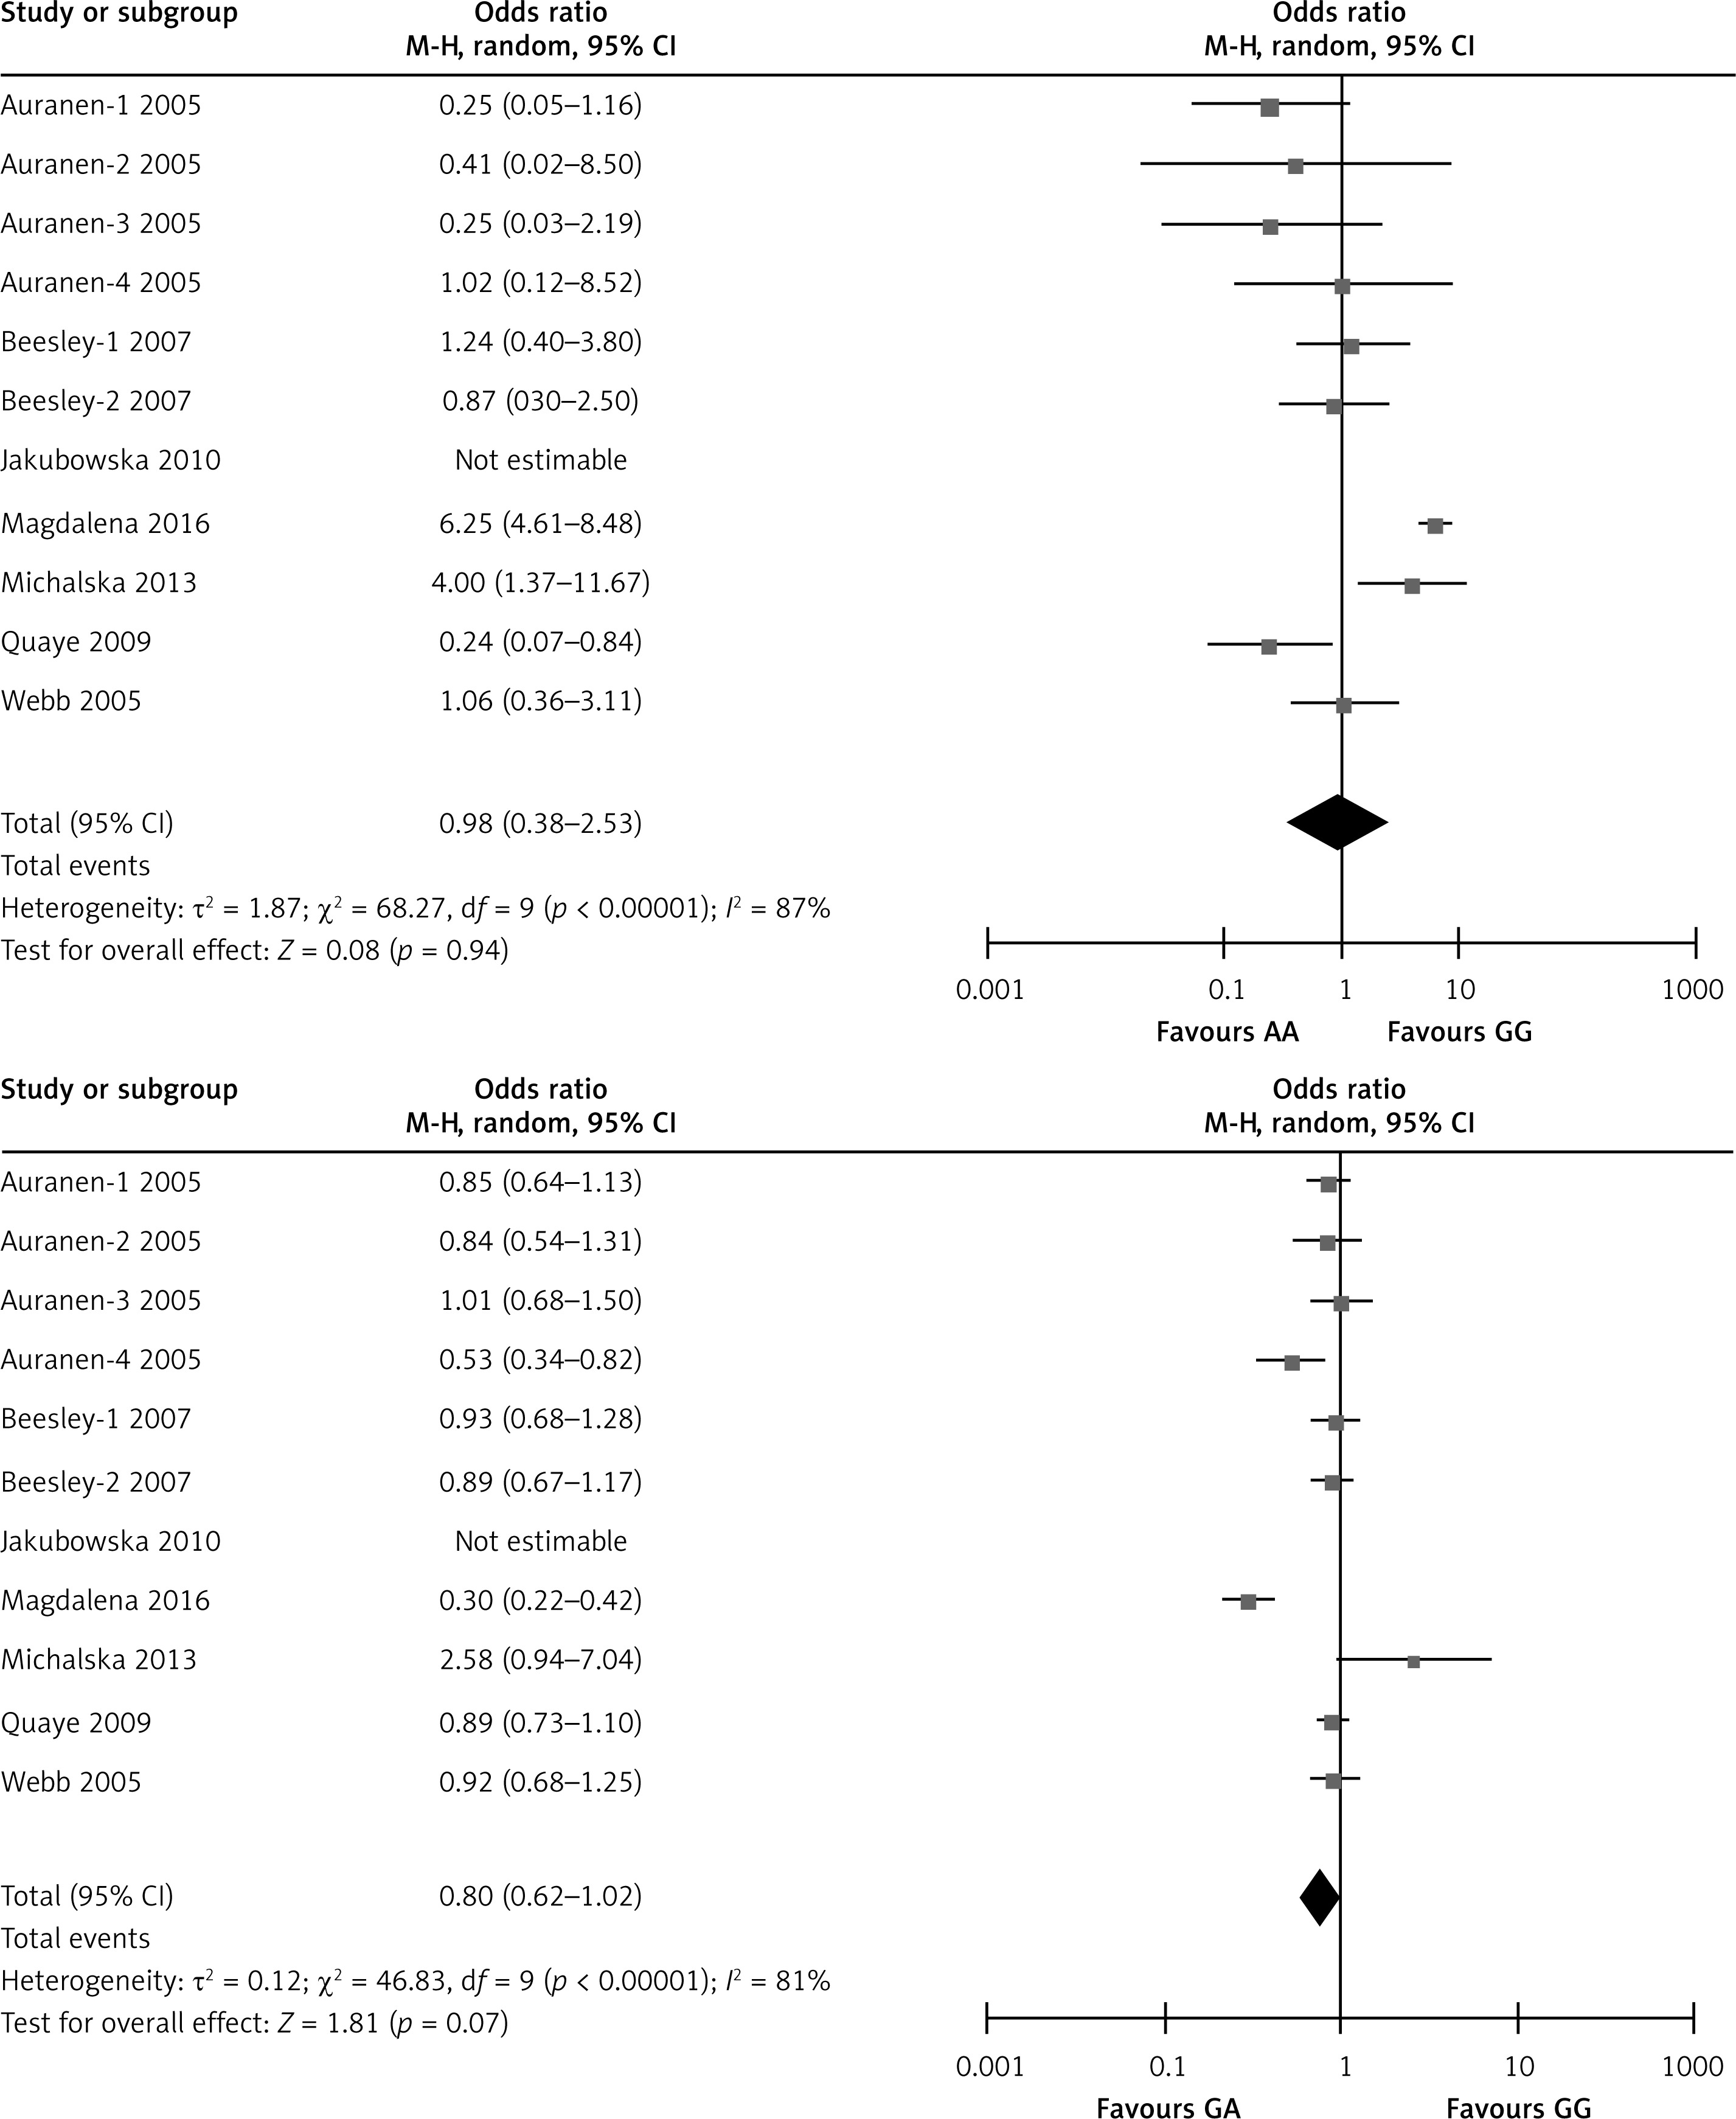
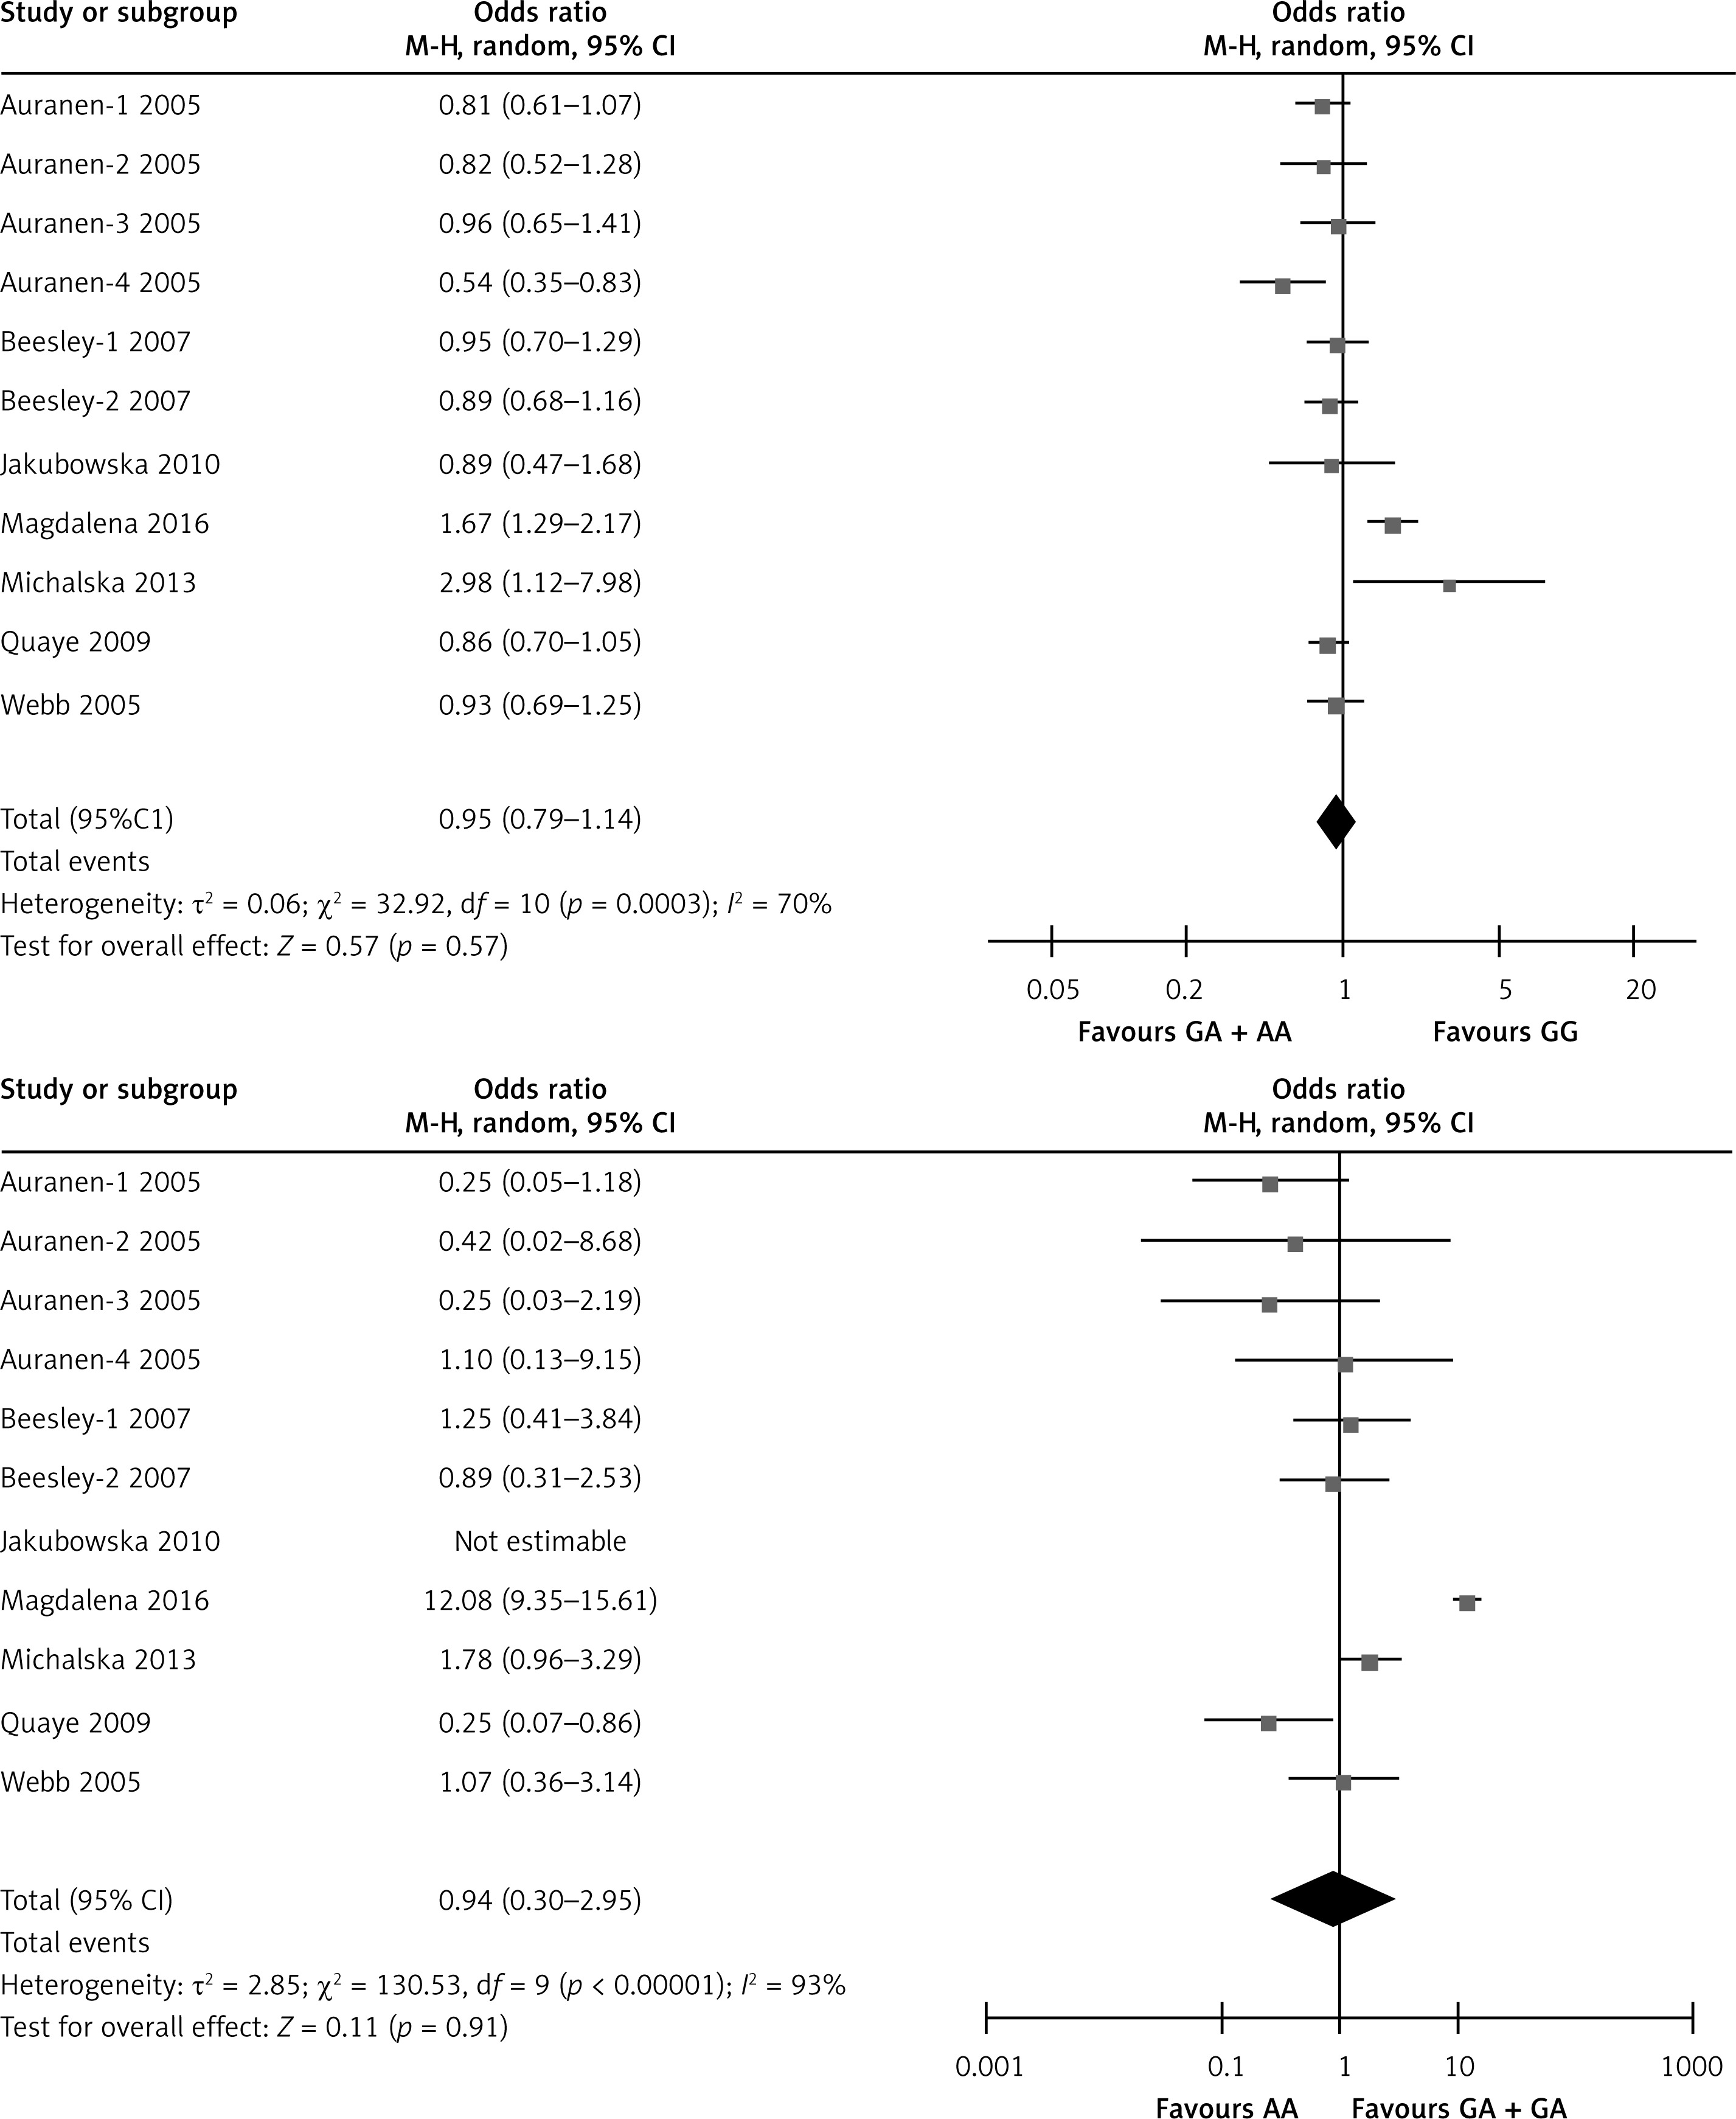
Table IV
Results of the meta-analysis for the XRCC2 rs3218536 polymorphism and ovarian cancer risk
| Study groups | Sample size (case/control) | AA vs. GG | GA vs. GG | GA + AA vs. GG | AA vs. GG + GA | ||||||||
|---|---|---|---|---|---|---|---|---|---|---|---|---|---|
| OR (95% CI) | P-valuea | P-valueb | OR (95% CI) | P-valuea | P-valueb | OR (95% CI) | P-valuea | P-valueb | OR (95% CI) | P-valuea | P-valueb | ||
| Total | 5802/9390 | 0.96 (0.36–2.53) | < 0.0001 | 0.94c | 0.80 (0.62–1.02) | < 0.0001 | 0.07c | 0.95 (0.79–1.14) | 0.0003 | 0.57c | 0.90 (0.43–1.89) | < 0.0001 | 0.78c |
| ≥ 10 (Quality of studies) | 4991/8642 | 0.59 (0.37–0.94) | 0.39 | 0.03d | 0.87 (0.78–0.96) | 0.56 | 0.009d | 0.85 (0.77–0.94) | 0.59 | 0.003d | 0.60 (0.38–0.95) | 0.39 | 0.03d |
Sensitivity analysis and publication bias
In the sensitivity analysis, we omitted a single study from the pooled OR of the meta-analysis each time [41]. The exclusion of the low quality studies significantly modified the heterogeneity and results of the meta-analysis.
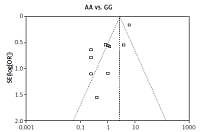
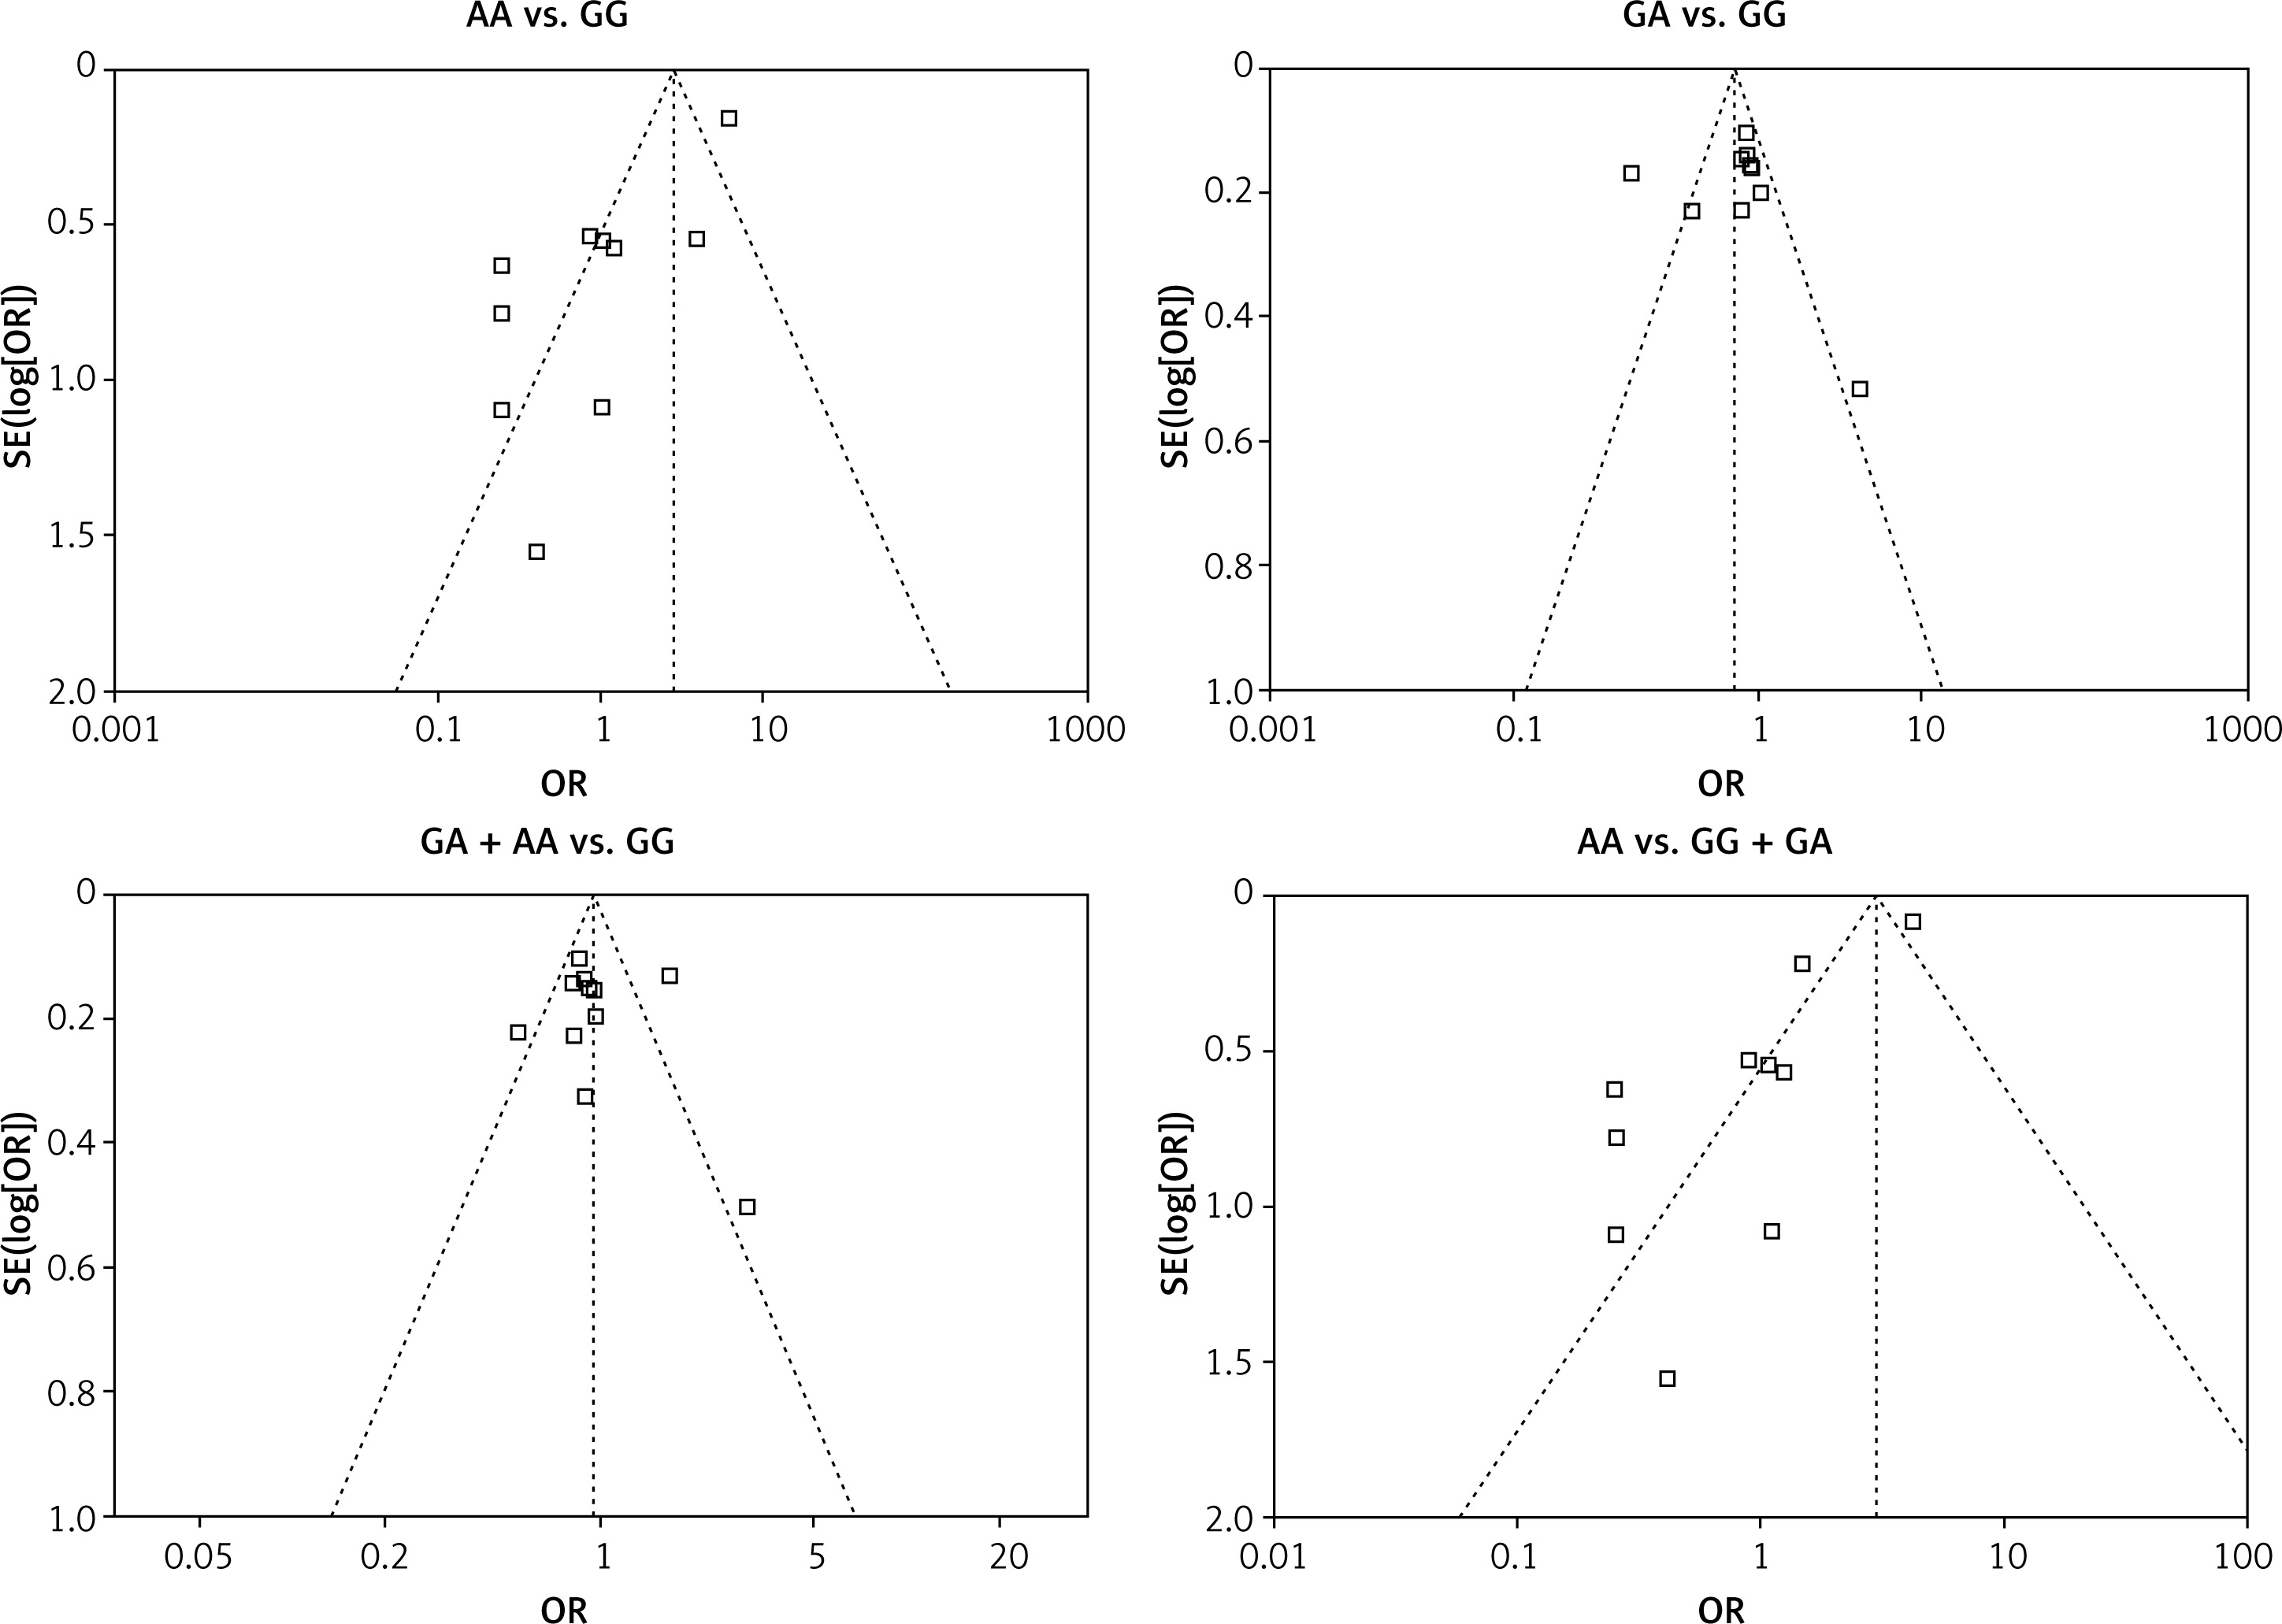
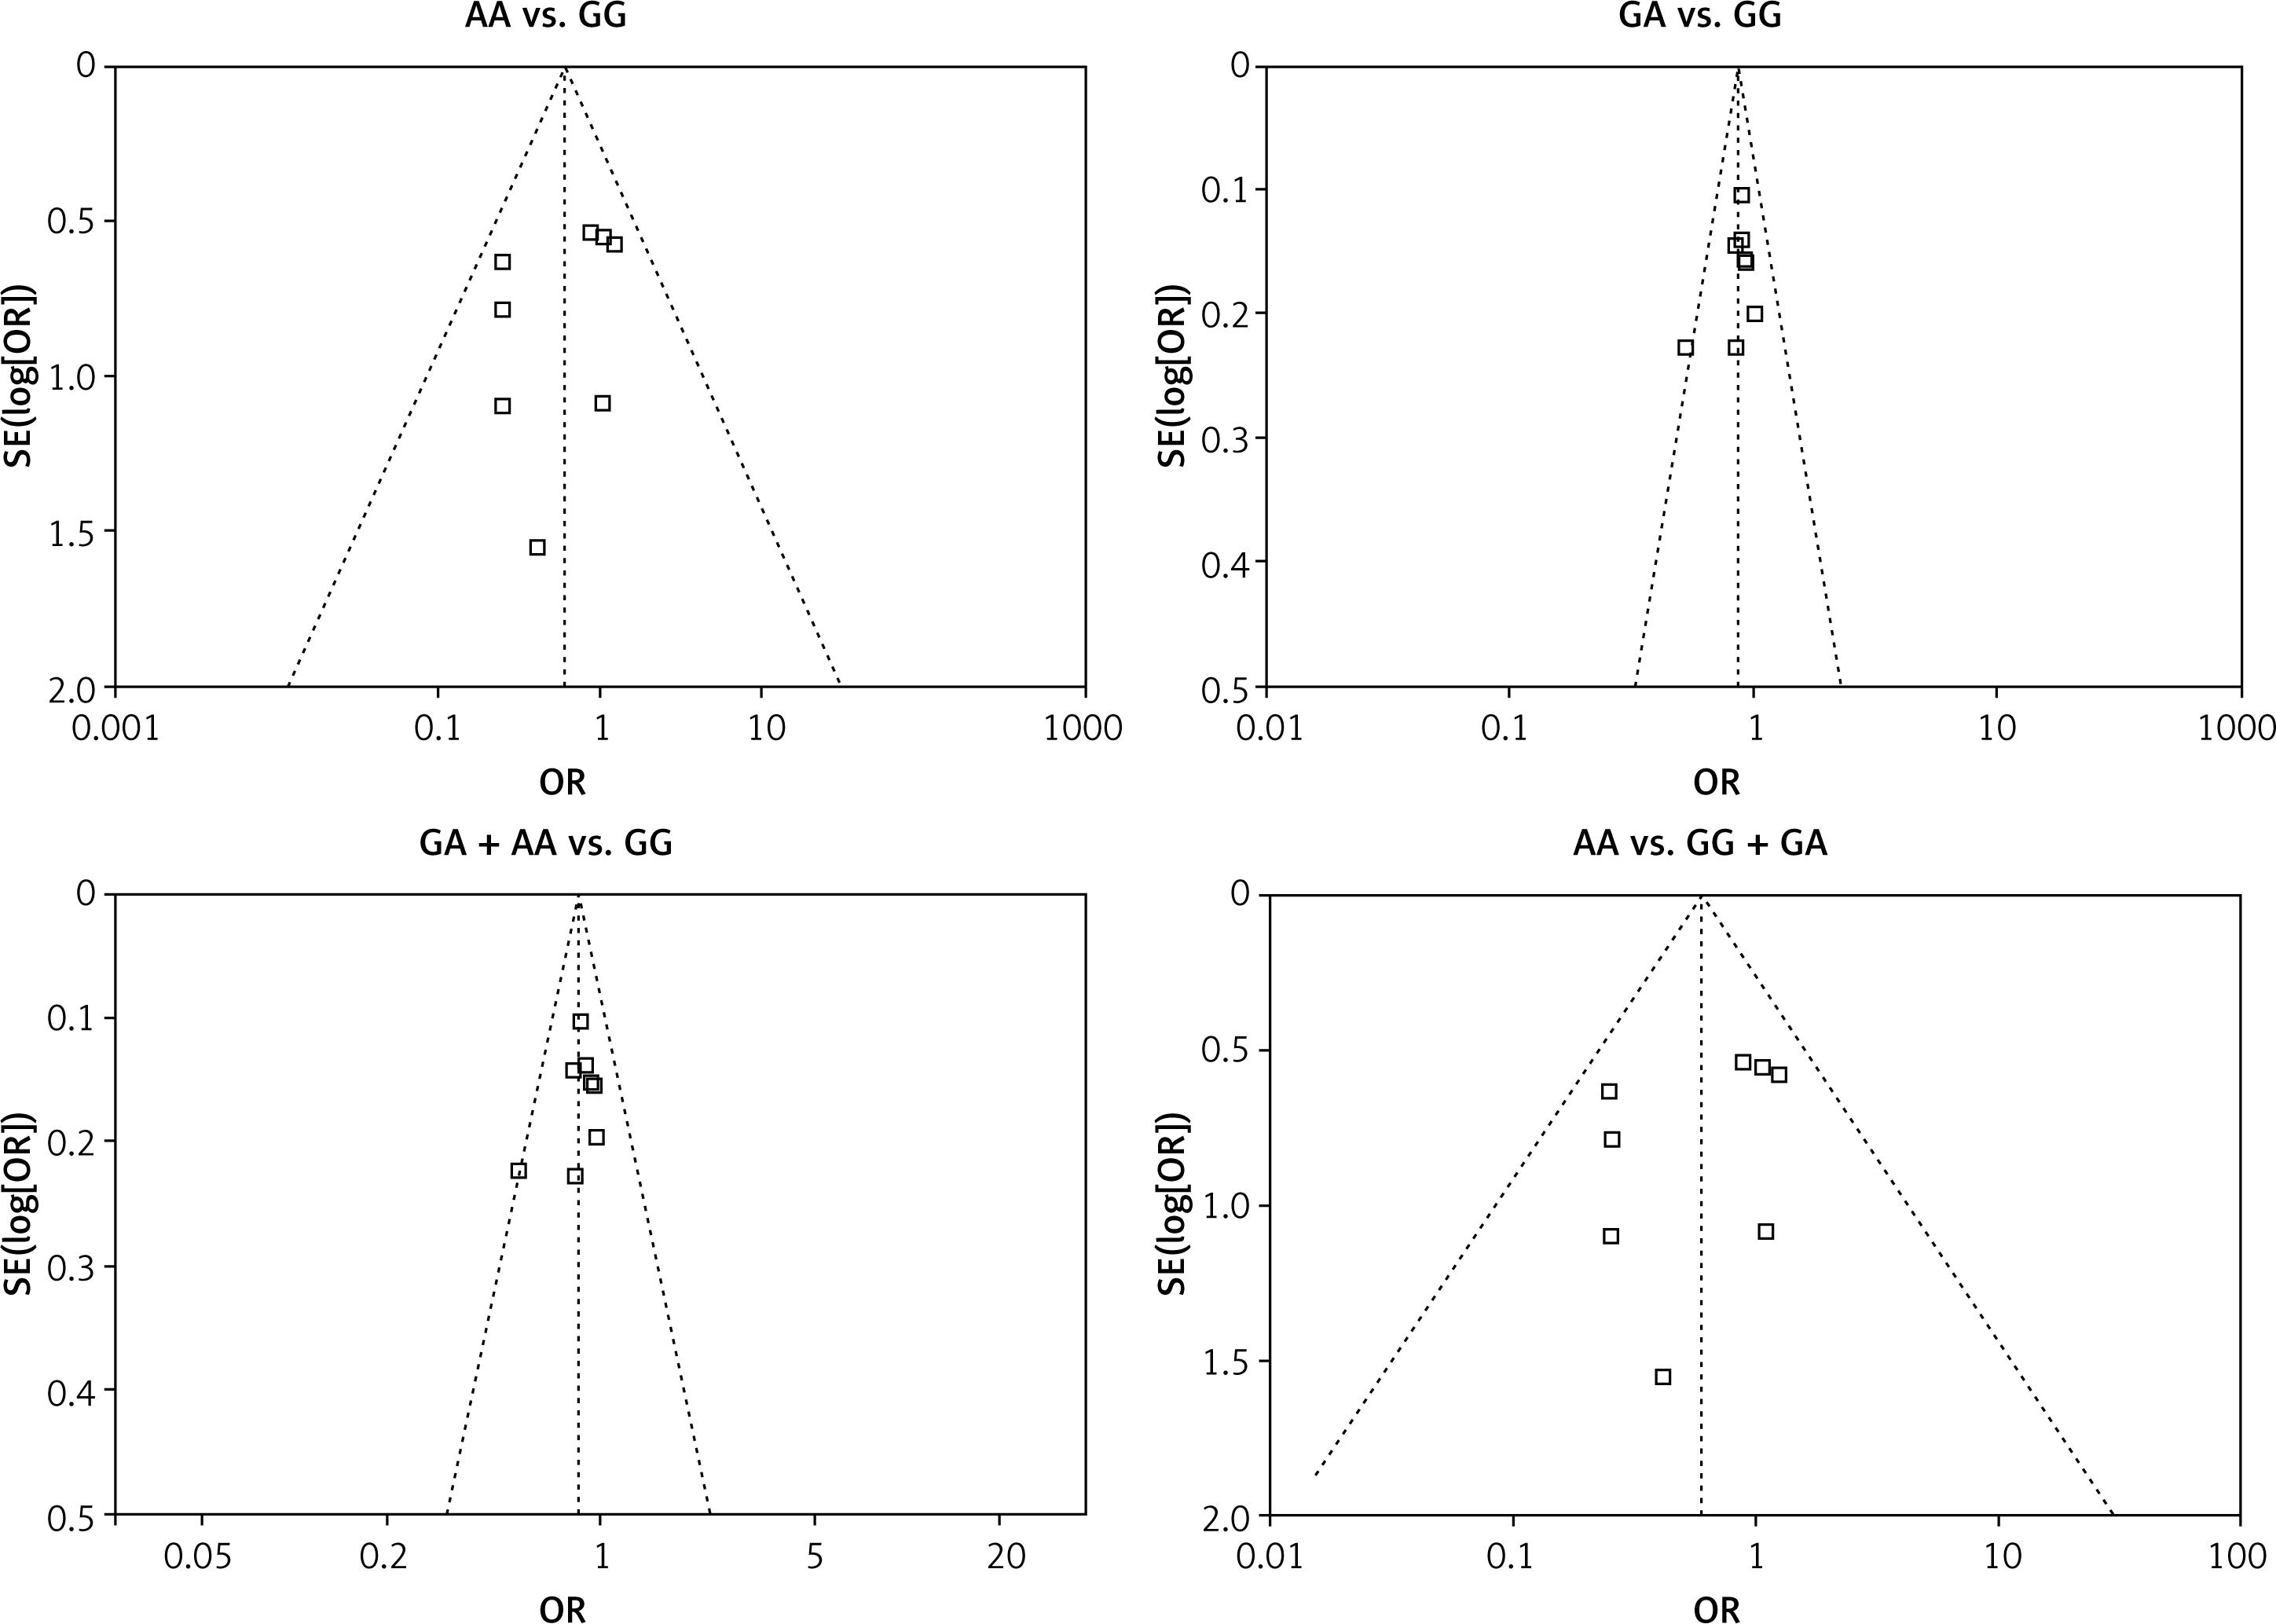
We checked the publication bias by using both Begg’s funnel plot and Egger’s test. The shapes of the four Begg’s funnel plots for all 11 studies showed no obvious asymmetry (Figure 3). The shapes of the four Begg’s funnel plots for the 8 high quality studies also showed no obvious asymmetry (Figure 4). The Egger’s test of the 8 high quality studies showed no significant publication bias for any of the genetic models (data not shown).
Discussion
The XRCC2 gene plays a crucial role in homologous recombination repair and cross-link repair [20–22]. Studies have shown that the XRCC2 rs3218536 polymorphism is associated with the risk of many cancers, including prostate cancer, breast cancer, and gastric cancer [23–27]. The association between the XRCC2 rs3218536 polymorphism and the risk of ovarian cancer has been extensively studied. A 2015 meta-analysis study reported on the association between the rs3218536 polymorphism and ovarian cancer risk [36]. However, that study did not include all of the studies related to the association between the rs3218536 polymorphism and ovarian cancer risk. In 2015, another study also reported on the association between the rs3218536 polymorphism and ovarian cancer risk [28]. However, those results were inconsistent. Therefore, we performed a meta-analysis of 5,802 ovarian cancer cases and 9,390 controls from 7 published articles and 11 case-control studies.
There were no statistically significant associations between the rs3218536 polymorphism and ovarian cancer risk in any of the genetic models that included all 11 studies. However, a significant relationship with ovarian cancer risk was discovered when the 8 high quality studies were pooled. Thus, the low quality studies seriously interfered with the meta-analysis results. The quality of the study was crucial for detecting a significant relationship between ovarian cancer risk and genetic polymorphisms. Furthermore, most of the subjects were Caucasian [28, 30, 31, 33–35, 46], so further studies may be needed to explore the possible relationship between the rs3218536 polymorphism and ovarian cancer risk in other ethnicities, areas, non-Caucasian groups, Africans, and Asians.
In conclusion, to our knowledge, the present meta-analysis on the association between the XRCC2 rs3218536 polymorphism and ovarian cancer risk was performed systematically and comprehensively. In conclusion, this meta-analysis shows that the XRCC2 rs3218536 polymorphism was associated with ovarian cancer risk in high quality studies overall. Non-Caucasian groups and high quality studies should be examined further.