
Introduction
Proteins from the transforming growth factor β (TGF-β) family have a significant role in the physiological and pathological processes. They are engaged in such cell processes as adhesion; proliferation; programmed cell death; and differentiation. They are characterised by multidirectional action (pleiotropism), which is connected with the diversity of proteins included in the TGF-β family (over 30 structurally related polypeptide growth factors) as well as their part in the different signalling pathways [1–3]. In the TGF-β group there are 6 isoforms, of which 3 have been identified in mammals – TGF-β1, TGF-β2, TGF-β3, which are homodimers, and their quaternary structure is constructed from 2 of the same polypeptides [4, 5]. TGF-β1 is produced mainly by leukocytes, dendritic cells and immune system cells. Its deficit is associated with the induction of autoimmune illnesses such as lupus [6, 7]. TGF-β2 is produced in epithelium and nerve cells. A deficiency of this isoform results in hearing, vision, genitourinary and spine disorders [5, 8]. TGF-β3 occurs in mesenchymal cells, and the main place of its occurrence is glial and nerve cells [9]. In relation to the skin, every isoform has the highest concentration in different layers of the skin. For TGF-β1 it is the stratum corneum and granular layer, for TGF-β2 – spinous layer, and TGF-β3 is found in the base layer as well as in the lower layers of the skin. Transformation growth factor β indicates an antiproliferative effect on epidermal keratinocytes [10]. Both in the joint and individual interleukin action of interleukin (IL) 17 (IL-17), IL-21, IL-22 or of tumour necrosis factor α (TNF-α), TGF-β affects the keratinocytes and skin fibroblasts, which changes the way they function, causing them to grow, which is the beginning of the psoriasis scales appearing [11, 12]. In psoriasis, the signal deregulation of TGF-β is observed, in which psoriatic keratinocytes were hyperproliferated due to a reduced expression of the TGF-β gene [13]. In patients with severe active psoriasis vulgaris, changes in the concentration of TGF-β1 in the serum were seen, which is connected with the increased migration of neutrophils, macrophages and T-lymphocytes to the skin, with increased cytokine production and secretion, and hyperkeratosis of the epidermis [3].
In the therapy of moderate to severe psoriasis, biological therapy with the use of anti-cytokine drugs is recommended. One of them is a fully human monoclonal antibody targeted against TNF-α, i.e. adalimumab [14].
Aim
The goal of this study was to analyse the changes in the expression profile of TGF-β1-3 mRNA and coded proteins (TGF-β1 and TGF-β2) in normal human skin fibroblasts exposed to bacteria lipopolysaccharide (induction of inflammation) and adalimumab (anti-TNF drug).
Material and methods
In this work, a commercially available line of normal human skin fibroblasts was used (NHDFs, CC-2511 Lonza, Basel, Switzerland), grown in Fibroblast Basal Medium (FBM; Lonza, Basel, Switzerland), which was enriched with Human Fibroblast Growth Factor-basic 1 (hFGF-B, FGM TM SingleQuots TM; Lonza, Basel, Switzerland), insulin and gentamicin. The cell culture was kept at 5% CO2, 37°C.
At the beginning, normal human skin fibroblasts were induced with bacterial lipopolysaccharide at a concentration of 1 μg/ml for 8 h, and then adalimumab at a concentration of 8 μg/ml was added, which is the average therapeutic concentration of the anti-TNF drug in the serum of the patients treated; the incubation was carried out with the anti-TNF drug for 2, 8 and 24 h. Skin fibroblasts not incubated with LPS and adalimumab made up the control in this experiment.
Molecular analysis included the extraction of whole RNA, carried out using the TRIzol reagent (Invitrogen Life Technologies, California, USA) according to the manufacturer’s protocol. The mRNA expression pattern of TGF-β1–3 was indicated using the HG-U133_A2 oligonucleotide microarray technique (Affymetrix, Santa Clara, CA, USA). For the most important stages in determining the transcriptomes of the control culture of NHDF, the NHDF culture exposed to LPS and also the culture of NHDF exposed to both LPS and adalimumab, it is worth including preparation, then marking ribonucleic acid samples, hybridization of samples with complementary nucleotide sequences (probes), reading of the hybridization signal, interpretation of the obtained data with the use of the Transcriptome Analysis Console program (Thermo Fisher Scientific).
Microarray analysis of the mRNA profile of TGF-β1-3 was confirmed using the real-time quantitative polymerase chain reaction technique (RTqPCR), with the use of the QuantiTect SYBR Green RT-PCR Kit reagent kit (Qiagen, Valencia, CA, USA). The thermal profile of the reaction was the following: reverse transcription (RT) reaction – 50°C for 30 min; amplification – 95°C for 15 min; 42 two-stage cycles – 94°C for 30 s and 60°C for 60 s and final extension – 72°C for 30 s.
For amplification of the assessed mRNA, complementary pairs of primers were used (Sigma Aldrich, Poland): TGF-β1 forward: 5’TGAACCGGCCTTTCCTGCTTCTCATG3’ reverse: 5’ GCGGAAGTCAATGTACAGCTGCCGC3’; TGF-β2 forward: 5’ TACTACGCCAAGGAGGTTTACAAA3’, reverse: 5’TTGTTCAGGCACTCTGGCTTT3’; TGF-β3 forward: 5’ CTGGATTGTGGTTCCATGCA 3’, reverse: 5’ TCCCCGAATGCCTCACAT3’; β-actin (endogenous control) forward: 5’ TCACCCACACTGTGCCCATCTACGA-3’, reverse: 5’ CAGCGGAACCGCTCATTGCCAATGG-3’. The expression of individual isoforms of TGF-β were marked using the relative method and showed as a fold change (FC) of the expression of mRNA in comparison to the control culture.
In this work, the expression of TGF-β1 and TGF-β2 on the protein level was also marked and compared to the Enzyme-linked immunosorbent assay reaction (ELISA) using the Thermo Fisher Scientific Reagent Kit (TGF-β1 – TGF beta-1 Human ELISA Kit Catalog # BMS249-4; TGF-β2 – TGF beta-2 Human ELISA Kit Catalog # BMS254) according to the recommendations of the manufacturer.
Statistical analysis
Statistical analysis of the results obtained using the RTqPCR and ELISA techniques was carried out using the Statistica 13 PL program (Cracow, Poland). The adopted statistical threshold was p < 0.05. The analysis included the assessment of the normality of distribution of the obtained data using the Shapiro-Wilk test, ANOVA variance analysis was used as well as the Tukey post-hoc test was carried out.
Results
The results of changes in the expression profile of mRNA and the individual TGF-β isoform proteins are presented in Table 1. Changes in the expression profile both on the mRNA and on the protein level for TGF-β1 and TGF-β2 are presented in Figures 1–4.
Table 1
Changes in the expression profile of TGF-β1-3 in dermal fibroblasts exposed to LPS and LPS and adalimumab compared to a control
| NHDF | Time [h] | TGF-β1 | TGF-β2 | TGF-β3 | |||||
|---|---|---|---|---|---|---|---|---|---|
| Microarray (FC) | RTqPCR (FC) | ELISA [pg/ml] | Microarray (FC) | RTqPCR (FC) | ELISA [pg/ml] | Microarray (FC) | RTqPCR (FC) | ||
| Control | 0 | – | – | 874.66 | – | – | 148.11 | – | – |
| with LPS | 8 | +1.96* | +1.74* | 1069.11* | –2.16* | –1.98* | 49.06* | +1.14 | +1.17 |
| with LPS and adalimumab | 2 | –1.78* | –2.03* | 969.34* | –2.01* | –1.96* | 42.01* | –1.03 | +1.01 |
| 8 | +1.54* | +1.41* | 1224.51* | –1.11 | –1.14 | 54.11* | +1.21 | +1.14 | |
| 24 | +1.29 | +1.24 | 1188.02 | +1.31 | +1.29 | 52.09* | +1.04 | –1.03 | |
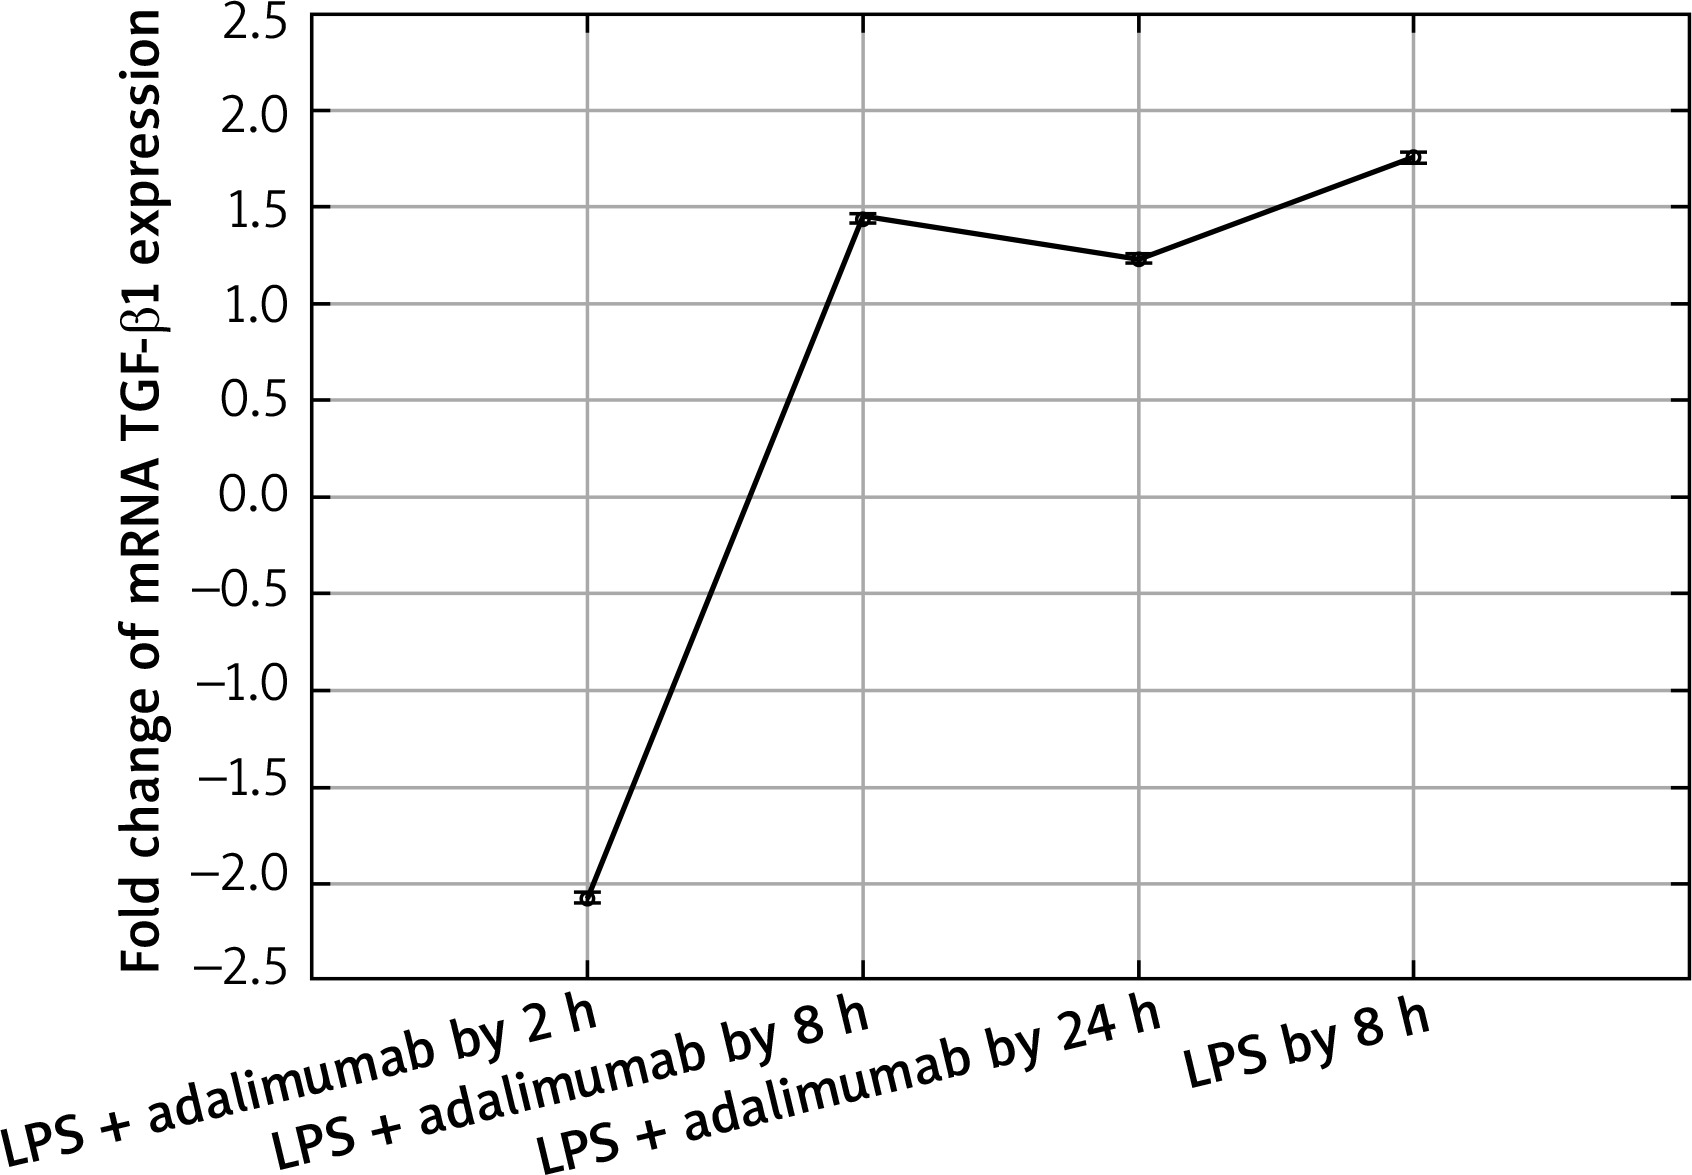
Figure 1
Expression profile of mRNA TGF-β1 in the NHDF culture exposed to LPS or LPS and adalimumab (RTqPCR)
Expression profile of protein TGF-β1 in the NHDF culture exposed to LPS or LPS and adalimumab compared to a control culture (ELISA assay)
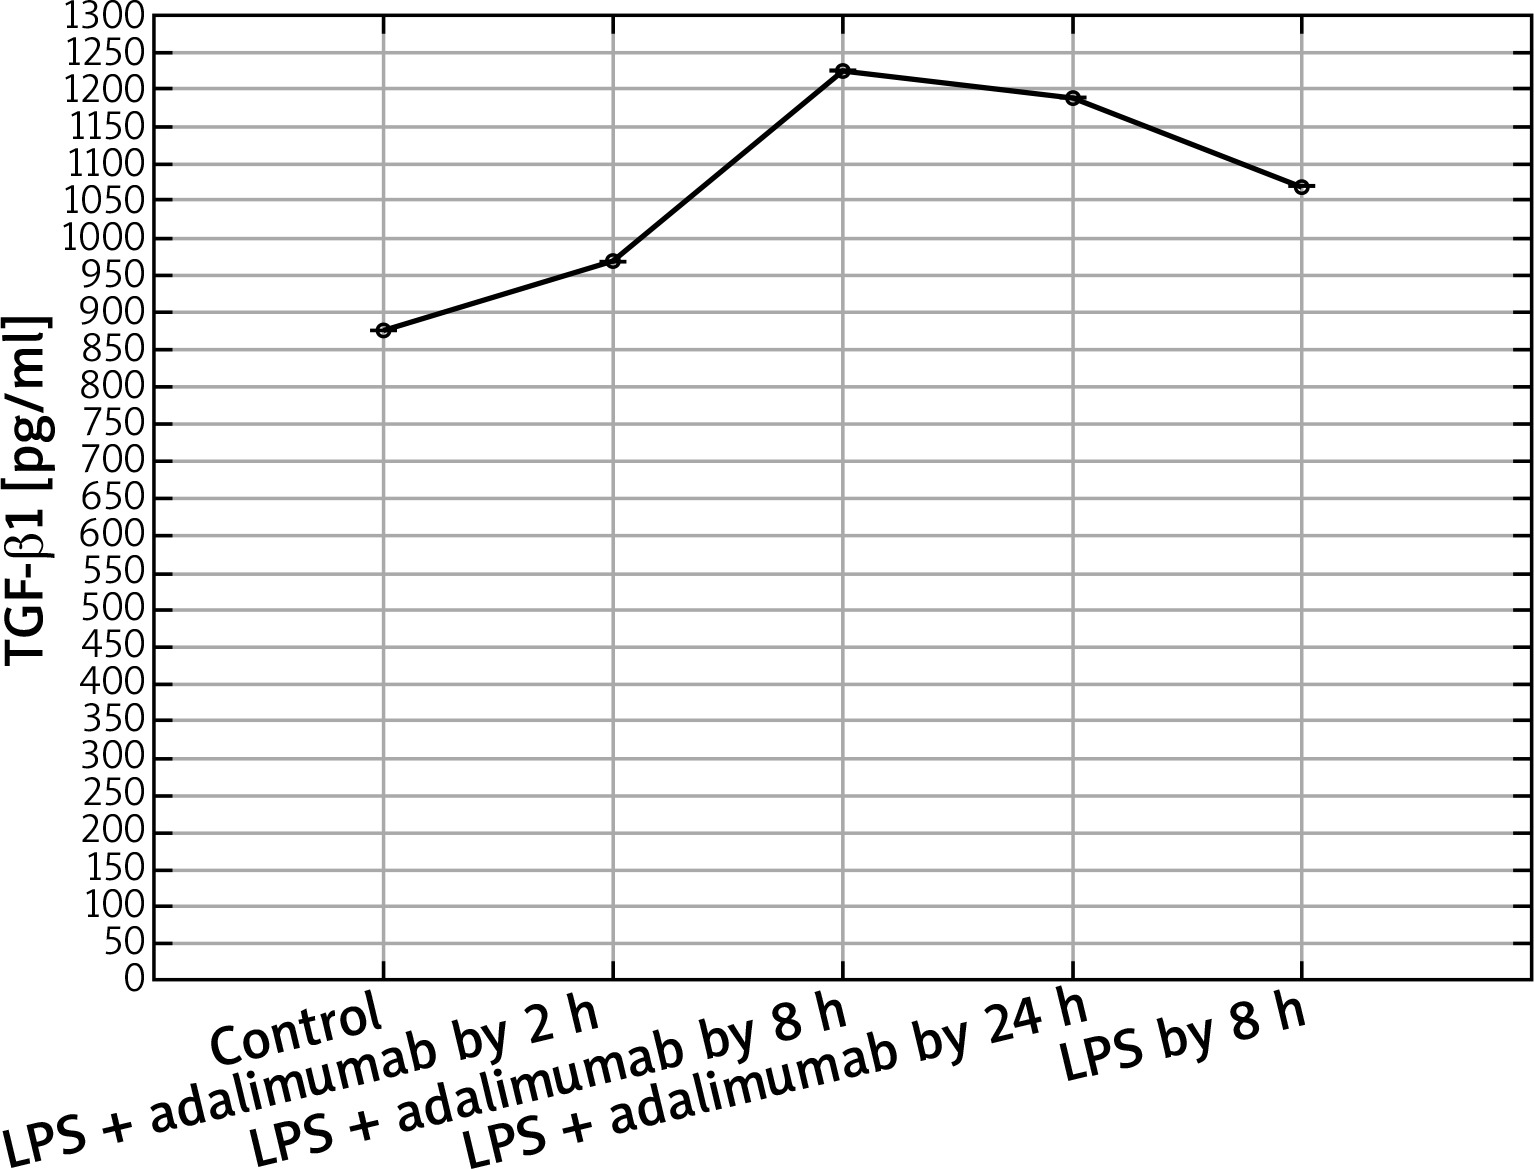
Figure 3
Transcriptional activity of mRNA TGF-β2 in the NHDF culture exposed to LPS or LPS and adalimumab (RTqPCR)
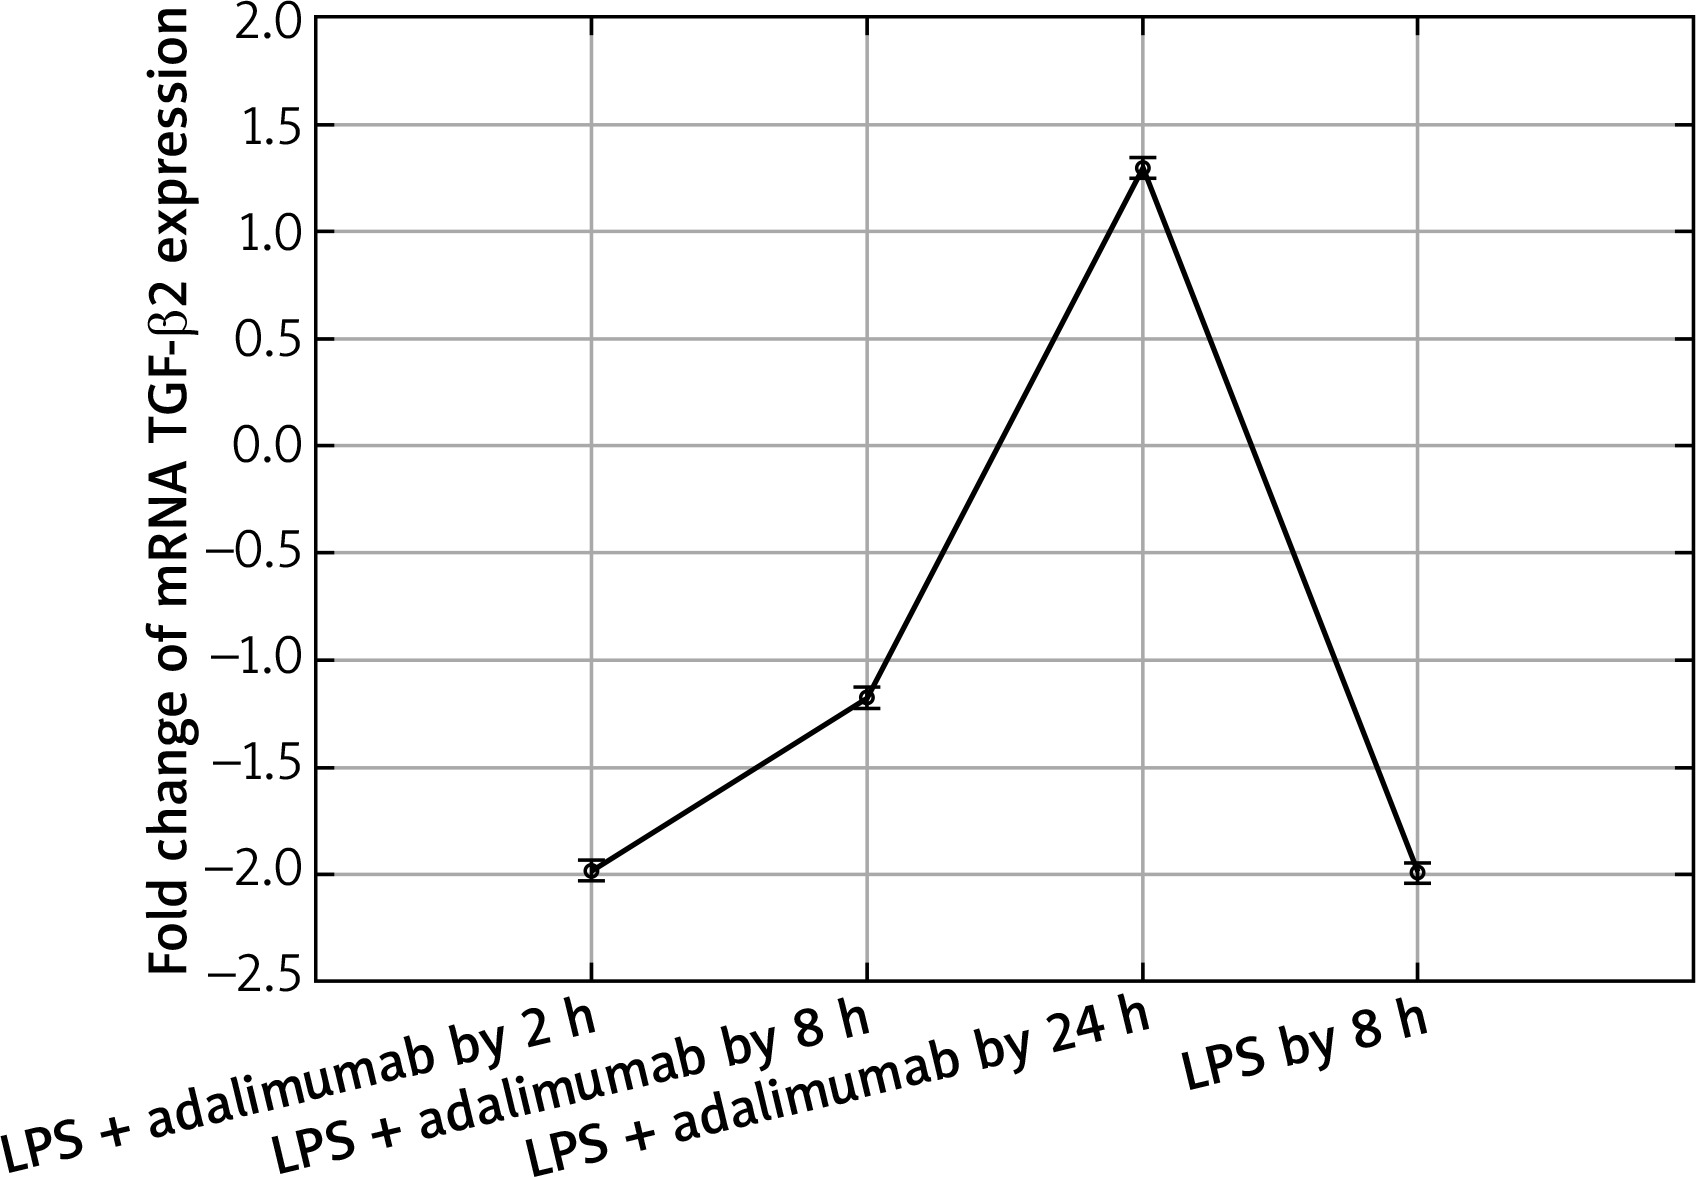
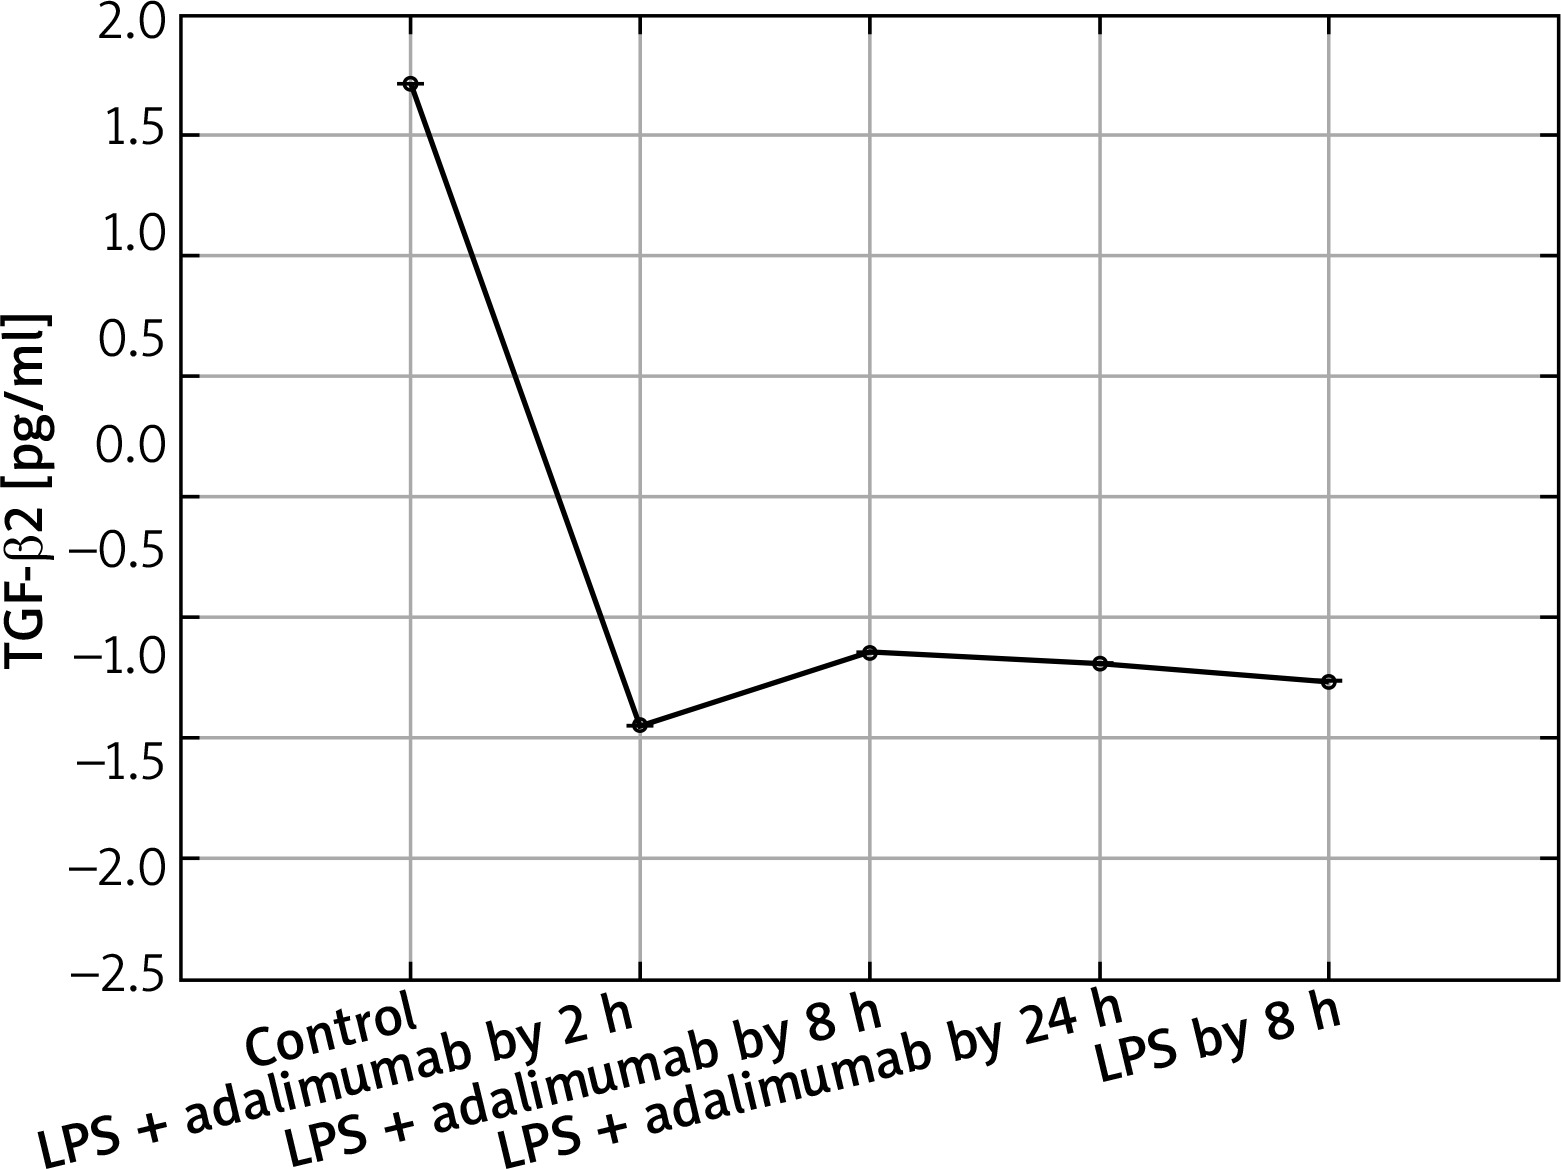
Figure 4
Expression profile of protein TGF-β2 in the NHDF culture exposed to LPS or LPS and adalimumab compared to a control culture (ELISA assay)
The microarray analysis indicated that treating normal human skin fibroblast cells with LPS resulted in statistically significant changes in the expression of TGF-β1(↑) and TGF-β2 (↓) in comparison to the control (p < 0.05). The direction of changes in expression of all three isoforms of TGF-β indicated using the microarray technique was confirmed based on the RTqPCR method.
Also after adding adalimumab to the culture of NHDF treated with LPS before, changes in the expression pattern of TGF-β1-3 were noted in comparison to the control culture (cells not treated with LPS) as well in comparison to the culture previously incubated with LPS for 8 h. However, statistically significant differences were determined only for two of the first TGF-β isoforms (p < 0.05). In reference to the expression of TGF-β1, it can be observed that with the shortest incubation time with adalimumab, there is a nearly two-fold decrease in the expression in comparison to the control culture. Transcriptional activity of this isoform of TGF-β also undergoes a decrease in comparison to the culture treated with LPS. However, a further elongation of the exposure time of the skin fibroblasts to adalimumab was connected with an increase in the transcriptional activity of TGF-β1. Using the RTqPCR reaction, the tendency of the observed changes in the microarray experiment was confirmed. In turn, silencing of the expression was found for TGF-β2 after introducing LPS skin fibroblasts into the culture and after incubation with an anti-TNF drug for 2 h in comparison to the control. The exposure of cells to adalimumab for 8 and 24 h, caused a gradual increase in the transcriptional activity. The direction of expression changes of TGF-β2 indicated using the microarray technique and RTqPCR was identical.
In turn, for TGF-β3, statistical analysis did not indicate that LPS and adalimumab statistically changed the transcriptional activity of this isoform of TGF-β (p > 0.05). For 2 and 24 h, incubation of skin fibroblasts with adalimumab using the RTqPCR did not confirm the direction of changes obtained using the microarray technique.
In turn, on the protein level it can be determined that LPS and adalimumab cause an increase in the concentration of TGF-β1 in comparison to the control culture, wherein as the incubation time of the cells with the anti-TNF drug lengthened, the difference gradually got smaller (p < 0.05). For TGF-β2, a decrease in its concentration in response to LPS and adalimumab was noted in comparison to the culture (p < 0.05). Whereas no statistically significant differences in the concentration profile of TGF-β2 were determined between the culture exposed to LPS and the culture treated with LPS and exposed to adalimumab (p > 0.05).
Discussion
Research connected with assessing the expression pattern of isoforms of TGF-β in the context of psoriasis as well as other illnesses with a pro-inflammatory and/or autoimmune aetiology have been conducted for many years [1]. The consequence of a better knowledge and understanding of the complex immunological and molecular mechanisms connected with the induction and subsequent development of changes caused by underlying psoriasis has caused the introduction of anti-cytokine drugs as one of the available therapeutic strategies for psoriasis [15]. A substantial element of an effective and safe pharmacotherapy is also understanding the interrelationships between cytokines, growth factors and chemokines involved in a given pathological process [16]. This indicates that the activation of signalling pathways dependant on TNF-α causes an increase in the secretion of TGF-β [17], wherein the opposite effect caused by TNF-α and TGF-β on the expression profile of genes is described [18]. Therefore, it also seems reasonable to continue research connected with TGF-β1–3. Above all, according to our knowledge on the basis of the analysed literature, this is the first study, in which the effect of anti-TNF drugs on the expression profile of mRNA and protein of TGF-β1-3 depending on the incubation period of the cells with the drug was assessed in skin fibroblast cells with an induced inflammation. One of the compounds, which contributes to the largest degree to an increase in the secretion of TNF-α is LPS [19] which skin fibroblasts were exposed to in the first stage of the experiment. This stage aimed to induce inflammation in in vitro conditions as observed in psoriasis. After that, cells were treated with the TNF-α inhibitor at a concentration that is the average concentration in the serum of patients treated with it for 2, 8 and 24 h. In this way, an attempt was made at mapping the state of inflammation, in order to assess the therapeutic potential of adalimumab.
Akgun et al. observed that adalimumab is connected with a decreased expression of TGF-β1, which as they indicate is a result of a decrease in the concentration of only TNF-α [20]. In our study we also observed that after exposing the skin fibroblasts to the induced inflammation for 2 h to adalimumab, the expression of TGF-β1 shows a substantial decrease. However, together with the extension of the time of adalimumab working on the fibroblast transcriptome, an increase in the transcriptional activity of this TGF-β isoform was determined. Observing such a sudden decrease in the expression of TGF-β1 indicates that a transcriptome is a dynamic system, which reacts to changes quickly. Secondly, the determined expression pattern indicates that the effect of adalimumab disappears over time, which highlights the essence of regular drug supply to patients. On the other hand, however, it is worth noticing that after 8 h of incubation with adalimumab, the expression of TGF-β1 is higher than that noted after a full 24-hour exposure of the cells of the anti-TNF drug. This could be connected with the activation of compensation mechanisms through cells or an increase in the expression of other cytokines which could intensify the secretion of TNF-α. Also, on the protein level, a decrease in the expression of TGF-β1 was noted in response to adding NHDF adalimumab to the culture. Nockowski et al. also indicates that in patients with psoriasis, the concentration of this cytokine is significantly higher in comparison to healthy volunteers (42.9 ±9.9 vs. 37.7 ±6.0 ng/ml). They indicated also that the level of this cytokine was higher in patients with severe psoriasis in comparison to the group with moderate changes. Ipso facto, they indicated the possibility of using the changes in the expression of TGF-β1 as a supplementary molecular marker of the severity of psoriasis changes [21]. Opposing results regarding the expression of TGF-β1 in our study and in the study of Noc-kowski et al. [21] were described in the study by Cataldi et al. The authors observed a decreased concentration of TGF-β1 in the serum of patients with psoriasis, they based their analysis by comparing a group of 70 patients with diagnosed psoriasis and a group of 70 healthy volunteers [22]. According to them, one probable cause of this finding of a silenced TGF-β1 expression in inflammatory conditions could possibly come from a lowered immunological response in the group of ill patients. It is not out of the question that such an expression pattern of TGF-β1 is a result of individual variability.
In our work we also assessed changes in the mRNA expression profile of TGF-β2 and proteins coded by it. Microarray analysis of the expression pattern was confirmed using the RTqPCR technique and indicated a silencing of the expression of TGF-β2 under the influence of LPS. Whereas adding adalimumab to the medium caused an increase in the transcriptional activity of TGF-β2, with which differences in the expression on the proteome level were not statistically significant in comparisons between individual times of skin fibroblast incubation with the anti-TNF drug. While, on the mRNA level, TGF-β2 between individual times of exposure of the cells to adalimumab it was determined that the drug significantly changes the expression profile of this isoform of the transforming growth factor. This observation indicates that the transcriptome is more sensitive to the changes, it reacts quicker and more clearly compared to the proteome. Takahashi et al. on the basis of their research observed an increase in the expression of TGF-β2 induced through physical activity. Their research shows that the level of this isoform of TGF-β is, at least partly, dependent on the metabolism and tolerance of glucose [23]. Taking into account that the appearance of inflammation is connected with a decrease in the tolerance of glucose [24] as well as the mechanism of adalimumab working, whose phenotypic exponent is body mass gain, a determined decrease of the expression of TGF-β2 in our research is caused by the direct working of LPS and adalimumab on skin fibroblasts. Whereas, in reference to TGF-β3 it can be determined that anti-TNF treatment to a small degree affects the expression profile of this isoform of TGF-β. On the other hand, however, it should be noted that TGF-β3 is described as a factor in equilibrium in signalling along TGF-β dependant pathways, especially in the situation where the isoforms TGF-β1 and TGF-β2 are overexpressed [24]. Our observations of the activity of isoforms TGF-β1 and TGF-β3 are the same as the ones described by Lichtman et al., mainly TGF-β1 > TGF-β3. They indicate that TGF-β3 is expressed well in cases of chronic inflammation caused by bacterial infections [25]. Therefore, it could also be the case that using a higher dose of LPS for the first stimulation of the fibroblast cells allowed us to observe larger differences in the transcriptional activity of TGF-β3, and also the effect of treatment using anti-TNF drugs would be more noticeable.
Conclusions
It was confirmed that induced bacterial lipopolysaccharide inflammation affects the expression profile of three isoforms of the TGF-β1–3. The blocking of the signal dependant on TNF-α using adalimumab resulted in the increase in expression of TGF-β1 and simultaneously a decrease in the expression of TGF-β2. The analysis indicated that transcriptome and proteome are dynamic systems, which quickly react to changes. Finding relatively small changes in the transcriptional activity of TGF-β3 could be a result of the experiment conditions chosen.


