Introduction
Nutritional intake should be appropriate for a person’s physiological developmental stage. It should also improve health and help prevent the development of modern civilisation diseases. Abnormalities caused by an excessive or insufficient supply of energy or particular nutrients can lead to health and development disorders. Deficiencies of energy, proteins, vitamins, or minerals are all serious threats to the developing body of a child. For example, without a sufficient supply of calcium and vitamin D in childhood, optimum bone density cannot be reached in adulthood [1], while iron deficiency negatively affects motor development and increases the risk of infection [2]. On the other hand, excessive consumption of food causes excessive supply of energy and nutrients, which may further cause increased body weight and, later, also the development of civilisation diseases.
Obesity is the result of many factors, of which environmental factors have been receiving the greatest attention for many years. In the last ten years however, increasing significance has also been given to the role of vitamin D3 in the organism’s metabolism, as well as the effect of vitamin D3 deficiency on the development of overweight and obesity in populations of children and adolescents, and adults [3–10]. It has been demonstrated that the active form of vitamin D can affect the expression of over 200 genes [3]. When this vitamin is deficient, glucose metabolism and other metabolic processes in adipose tissue and other tissues can be adversely affected and insulin activity can be impeded [8]. Rodríguez-Rodríguez et al. [7] demonstrated that vitamin D deficiency occurred with visceral obesity and with higher body mass index (BMI) values. Gilbert-Diamond et al. [6] found an inverse relationship between vitamin D concentration in blood and the development of obesity in school-aged children. Foss [9], on the other hand, suggests that simple obesity and metabolic syndrome can result from disturbances in the winter adaptation of the organism’s metabolism, which is mediated by the decrease of blood calcidiol. When metabolism switches physiologically to the winter form, energy reserves are accumulated in the form of adipose tissue and thermogenesis increases. Foss also suggests that the prevalence of obesity is higher in persons in whom the winter form of metabolism appears at higher vitamin D3 levels, which leads to excessive accumulation of adipose tissue. In the population of developing children and adolescents, it is also significant in the development of obesity that the number and size of fat cells increases when the energy balance is positive. The final number of adipocytes stabilises with the completion of adolescence. Excessive increase of the number of these cells in childhood can lead to the development of obesity in adolescence and adulthood, as the process is irreversible [11–14]. Data from recent years [15–18] indicate that the prevalence of overweight and obesity in this social group is becoming a global epidemic. According to the International Obesity Task Force [19], each year around 400,000 children in Europe are overweight and approximately 85,000 suffer from obesity; one in five children has trouble maintaining normal body weight, and of the 74 million young Europeans aged 4–18 who are overweight (16–22%), 4–6% of them are obese. At a national level, the latest data [20] regarding the subject in Poland indicate that overweight is diagnosed in 9.1% of preschool girls and 9.9% of preschool boys, while obesity is diagnosed in 7.2% of girls and 8.4% of boys.
To ensure the basic metabolism, postprandial thermogenesis, meeting physical activity needs, and the maintenance of a normal course of growth processes related to synthesis of new cells and tissues, human nutrition norms were developed in Poland in 2008 and also apply to preschool children [21]. These recommendations were updated in 2012 [22], and in 2017 [23] recommendations on the use nutraceuticals and functional foods were published. Uniform international normal levels were introduced (EAR, RDA, AI, UL) to help not only evaluate intake or plan individual and group levels, but also facilitate the exchange of information about epidemiological phenomena such as overweight and obesity with other European countries. If these recommendations are followed, both overfeeding – leading to overweight and obesity – and malnutrition – leading to worse development – can be avoided, especially since there is an increasing amount of proof that the effects of inadequate nutrition are not only observable in childhood, but also are the cause of potential health deterioration in adulthood. Taking the above into consideration, we decided to determine the dietary intake (energy, macronutrient, vitamin and mineral intakes) in the diet of Polish children. In this study, we conducted a meta-analysis of studies carried out in Poland in the past ten years that analysed the intake of the critical nutrients important for the normal development of preschool children, in order to evaluate them against dietary recommendations and in terms of their significance in prevention of civilisation diseases.
Material and methods
Literature search
We sought studies analysing the dietary and eating habits of preschool children (3–6 years) conducted in Poland over a ten-year period. Two of the researchers independently performed a systematic search of Medline, Embase, Google Scholar, and the Polish Medical Bibliography to find studies published between 2005 and 2015. The search for studies was performed in January 2016. The following search strategy terms were used: ‘nourishment’, ‘diet’, ‘nutrition’, ‘children’, ‘kindergarten’, ‘preschool’, ‘3–6 years’, ‘Poland’, ‘Polish’, ‘eating habits’. The search included combinations of the terms and the literature search included the reference lists of articles.
Study selection
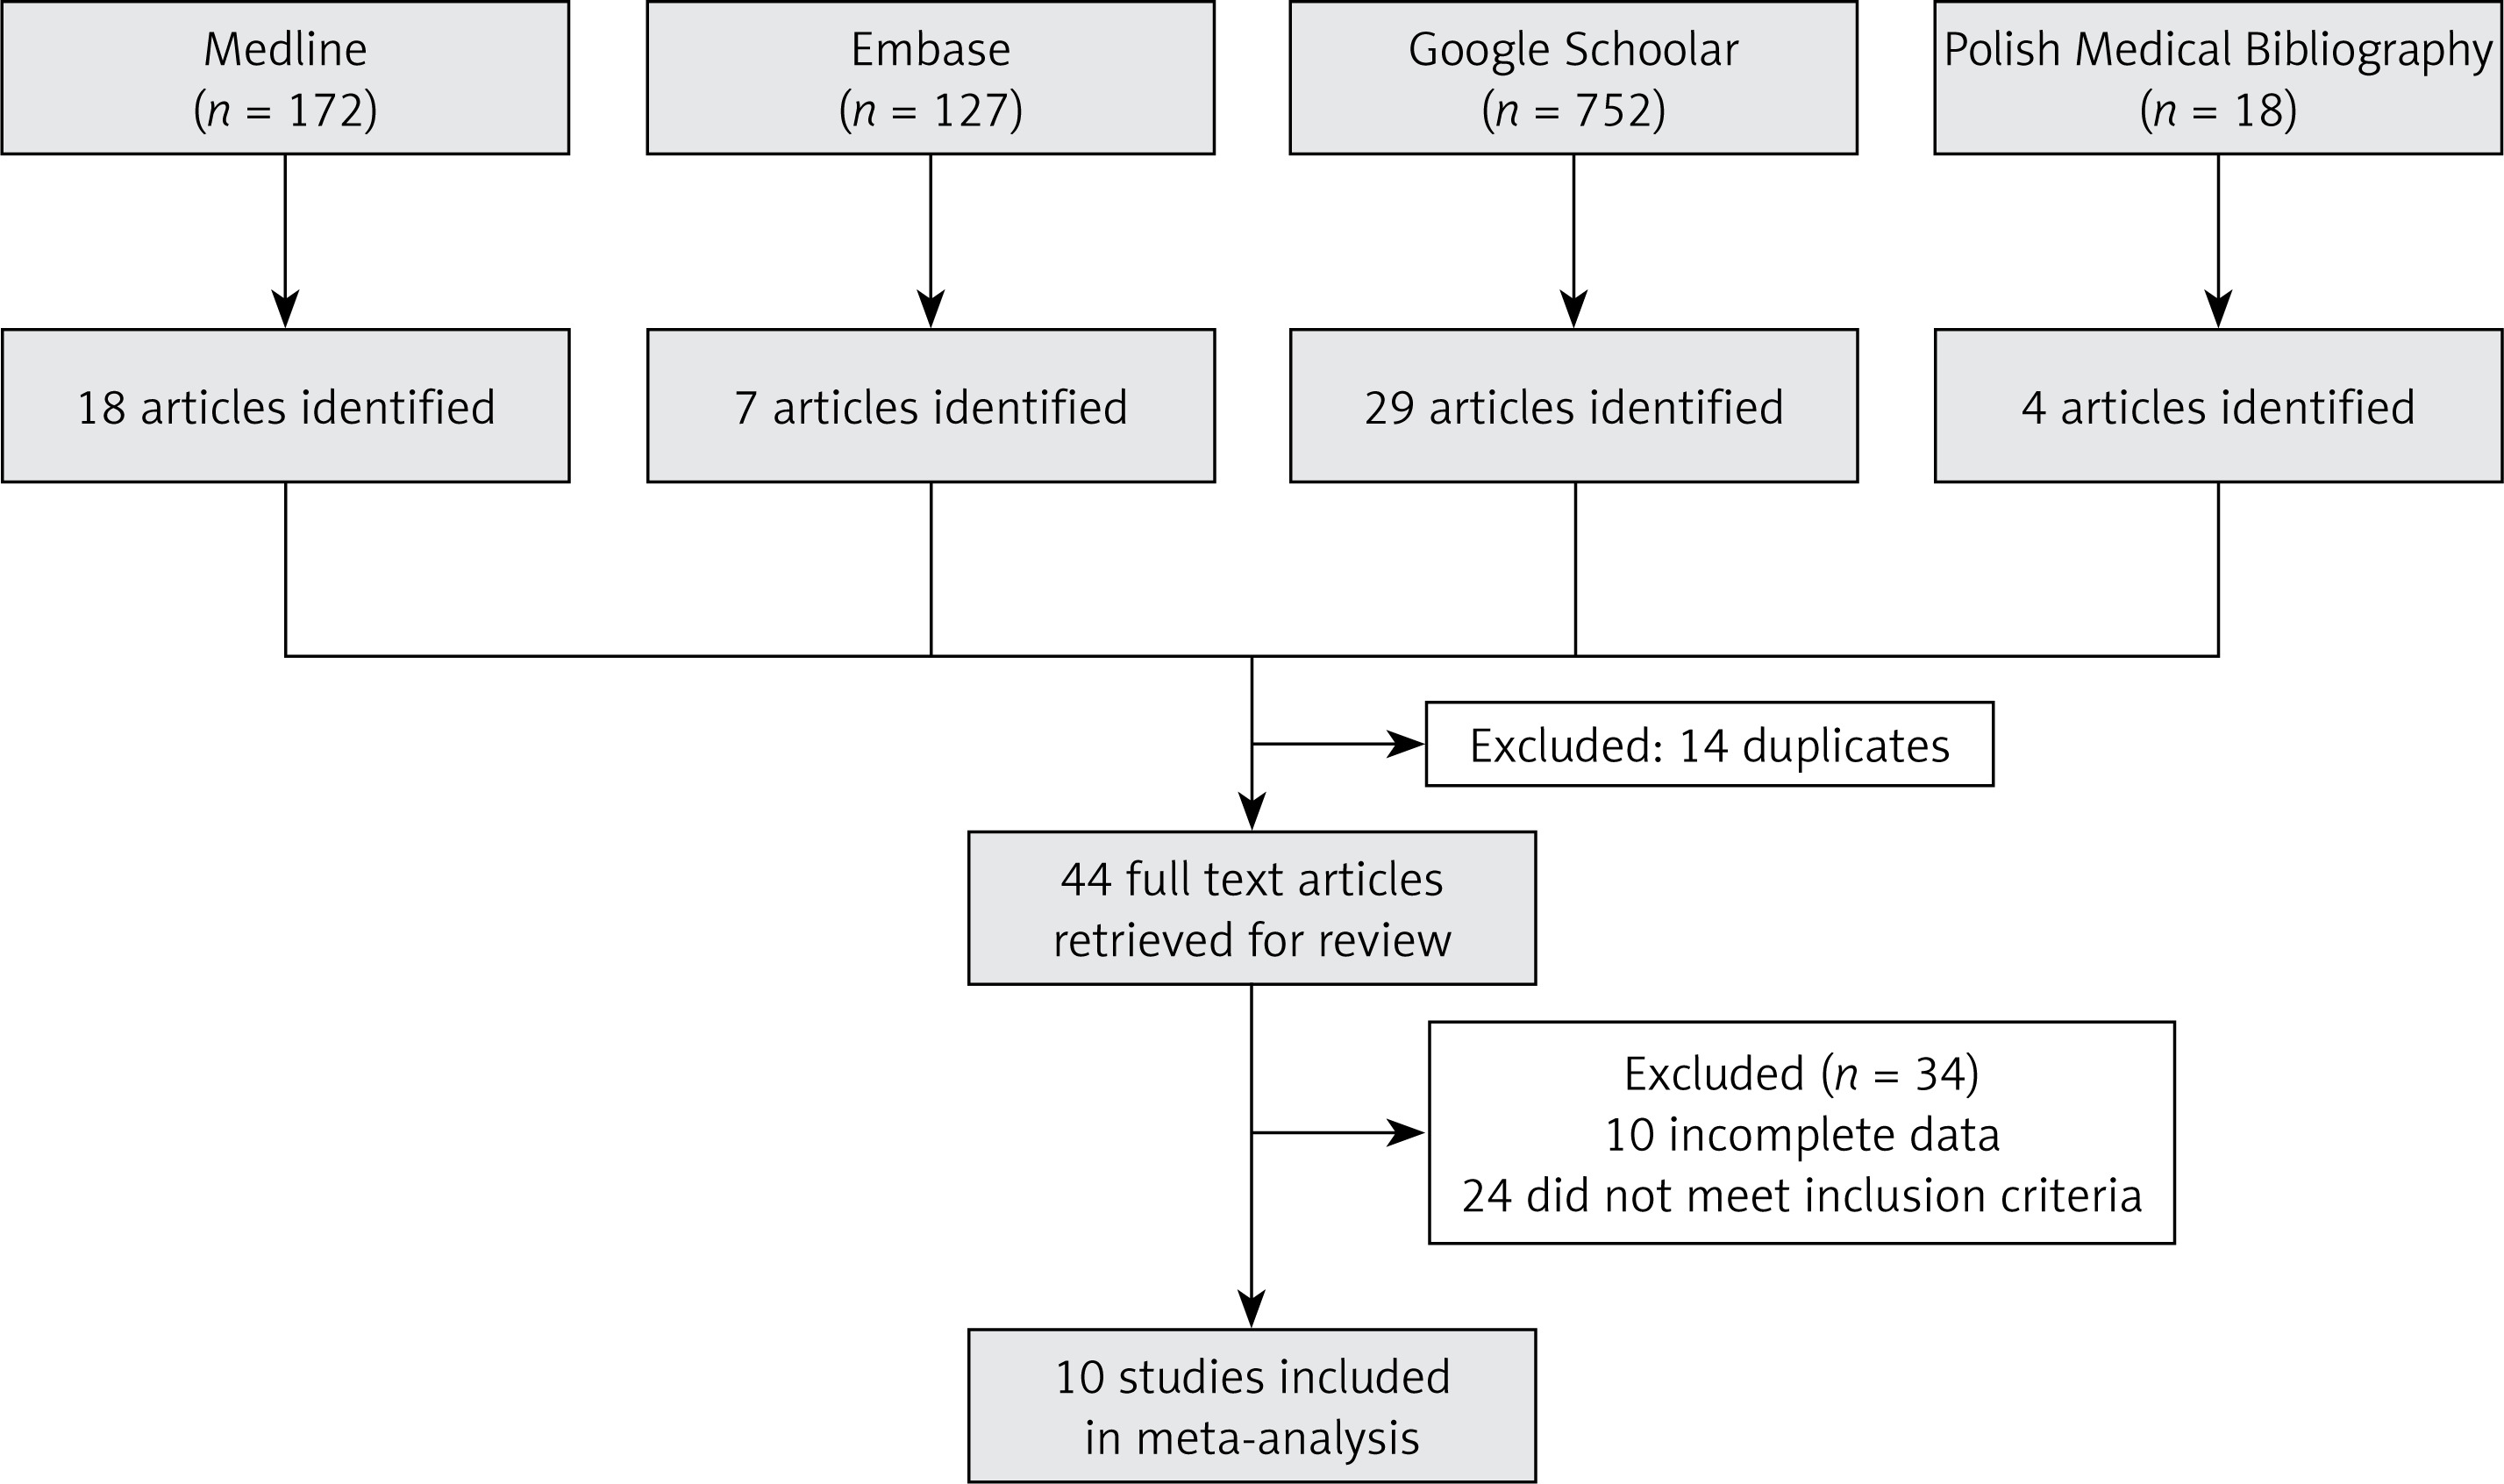
We identified citations in Medline (172), Embase (127), Google Scholar (752), and the Polish Medical Bibliography (18). Potentially relevant studies were selected by two authors; the selection was based on pre-defined inclusion criteria and analysis of titles, abstracts, and/or full texts. The inclusion criteria were: (i) subjects: healthy children (without overweight and obesity) of preschool age; (ii) type of study: original study; (iii) time range of publication: 2005–2015. The exclusion criteria were: (i) subjects: children with overweight or obesity and children aged over 6 years; (ii) type of study: analysis of children’s eating preferences and/or analysis of menus offered to children in kindergartens. The final report (Figure 1) included ten publications [24–33] that met the inclusion criteria.
Data extraction
To obtain information from publications, the authors used standardized forms. The following data were extracted: (i) characteristics of children (number, age, gender); (ii) characteristics of research tools; (iii) the average energy value of the analysed diets, (iv) the average daily intake of selected nutrients in the analysed diets (protein, carbohydrates, total fat, fibre, vitamins: A, E, C, D, B1, B2, B3, B6, B9 and mineral substances: calcium, magnesium, phosphorus, iron, sodium, potassium). Data were also sought on differences in regularity of meals, number of meals per day, and snacking between meals, but the data were too limited for analyses.
Comparison with nutritional guidelines
The energy, macronutrient intakes, vitamin, and mineral intakes of the studied population were compared to dietary reference intakes for the Polish population, including reference intakes for preschool children [34, 35]. The intakes of macronutrients, as well as intakes of vitamins A, B1, B2, B3, B6, B9, C, calcium, phosphorus, magnesium, and iron, were compared to Recommended Dietary Allowances (RDA) [35]. Intakes of vitamin E, sodium, potassium and fibre were compared to Adequate Intake (AI) [35]. Dietary reference intakes for the Polish population do not include EAR/RDA for vitamin D; thus the intake of this vitamin was compared to EAR set by the Food and Nutrition Board of the Institute of Medicine [36]. The assumed recommended daily energy demand (for person/day) in preschool children was 1400 kcal [34].
Data analysis
As the ten research papers included in the present analysis (Table I) were parts of a single study, we analysed them together, giving a total of 10 data points in the meta-analysis. We estimated the variance of the means of differences between selected factors in relation to dietary guidelines and standards for children aged 3–6 years, by summing the individual variances of means. In order to prevent overestimation of the analysed parameter due to the small number of tests, we multiplied Cohen’s d by an additional corrective factor J to obtain the unloaded Hedges’ g. The variance of the mean of a selected factor was estimated by dividing the difference of the selected factor by the number of participants in the group; when the S, standard deviation was unavailable, the square root of the variance gave the standard error (SE) of the mean of this factor. Hedges’ categories were used to evaluate the magnitude of the effect size: (i) small if 0 ≤ | g | ≤ 0.2; (ii) medium if 0.2 < | g | ≤ 0.5; (iii) large if 0.5 < | g | ≤ 0.8; and (iv) extra-large if | g | > 0.8 [37]. We provided pooled estimates along with their 95% CIs. We pooled the means of differences between selected factors across the studies using random-effects model meta-analysis, which makes allowance for inter-study heterogeneity. The heterogeneity of the studies was assessed using Q and I2 statistics applied to the ES means. The Q statistic is the χ2 test for heterogeneity with a degree of freedom equal to one minus the number of studies included in the meta-analysis; this assesses whether the observed differences of results between studies are due to chance alone [38]. The I2 statistic estimates the percentage of total variation across studies due to a true difference rather than chance [39]. In general, I2values greater than 60–70% indicate substantial heterogeneity. We assessed the influence of the year of studies and differences between regions with ANOVA. The impact of both examined variables was not statistically significant. Statistical tests were two-sided and used a significance level of p < 0.05. All calculations were performed using R [40] with the Meta for package [41].
Table I
Characteristics of studies included in the present analysis
| Study | N | Research tool | Age of study population [years] | Survey region | Study days |
|---|---|---|---|---|---|
| Rogalska-Niedźwiedź et al. [24] | 394 | Estimated food record for intake, made by parents. Analyzed using Dieta 2.0 software | 4 | The whole country | 7 |
| Gawęcki et al. [25] | 180 | Food frequency questionnaire. Results estimated using FOOD software | 5–6 | Bydgoszcz, Dąbrowa Górnicza, Gębice | 10 |
| Sadowska and Krzymuska [26] | 78 | Estimated food record for intake, made by parents and another one filled in by kindergarten staff. Total daily food portions per child were compared. Analysis performed using Dietetyk 2006 software | 4–6 | Szczecin | 3 |
| Sochacka-Tatara et al. [27] | 313 | Estimated food record for intake, made by parents, analyzed using Nutri-Day software | 3 | Kraków | 3 |
| Sadowska et al. [28] | 105 | Food frequency questionnaire filled in by parents and another one filled in by kindergarten staff. Total daily food portions per child were compared. Analysis performed using Dietetyk 2006 software | 4–6 | Szczecin | 3 |
| Starbała et al. [29] | 31 | Estimated food records for menus (2 weekdays (70% preschool diet + 30% home diet) and 1 day of the weekend). Diets analysed using Dietetyk software | 4–6 | Warsaw | 3 |
| Kolarzyk et al. [30] | 324 | Food frequency questionnaire filled in by parents | 3.5–7.5 | Kraków | NR |
| Kostecka [31] | 200 | Food frequency questionnairea,b filled in by parents, assessed in Dieta 5.0 software | 3–5 | Lublin | 3 |
| Merkiel [32] | 120 | Food frequency questionnairea,b filled in by parents, assessed in Dieta 4.0 software | 6 | Nowy Sącz | 3 |
| Kostecka [33] | 350 | Food frequency questionnairea,b (including 1 day of the weekend) filled in by parents, assessed in Dieta 5.0 application | 4–6 | South-eastern Poland | 3 |
Results
Participants
The analysis included a total of 2,095 children. Only one study had a slight predominance of girls (11–58%), three studies [27, 28, 30] reported no gender distribution, and the in other studies the two genders were roughly equally distributed. Tables I and II present details of the analysed studies. In one of the studies [28], the results were reported in two subsets (obese children and normosthenic children); in accordance with the assumptions and inclusion criteria, only results for normosthenic children were included in the analyses. In the study of Kolarzyk et al. [30], the age range of children included was larger than initially assumed (3.5–7.5), but the study was still included in the analysis, as the mean age was 5.65. As individual primary studies used different tools to evaluate the effect (various questionnaires), we used the standardized mean difference (SMD). We analysed selected factors separately, which gave a total of 20 comparisons (Table III). Subsets were combined for subsidiary analyses using random-effects model meta-analysis.
Table II
Energy and macronutrient intakes in the analysed studies
Table III
Effect size (ES) and 95% confidence interval (CI) differences between selected factors
| Parameter | Effect size | SE | 95% CI | z | P-value | Heterogeneity, I2 (%) | Total, N | Weighted mean | SD | Nutritional requirement | |
|---|---|---|---|---|---|---|---|---|---|---|---|
| ci.ub | ci.lb | ||||||||||
| Protein | 2.74*** | 0.33 | 2.09 | 3.39 | 8.28 | < 0.001 | 98.27 | 1595 | 56.51*** | 14.06 | 211 g |
| Carbohydrates | 0.34* | 0.15 | 0.04 | 0.64 | 2.22 | 0.027 | 95.44 | 1775 | 240.57* | 69.24 | 2101 g |
| Fat | 0.36 | 0.2 | −0.03 | 0.74 | 1.81 | 0.07 | 96.74 | 1775 | 59.87 | 19.50 | 541 g |
| Fibre | −0.78 | 0.76 | −2.27 | 0.7 | −1.03 | 0.302 | 99.58 | 975 | 11.80 | 4.24 | 142 g |
| Calcium | −1.13*** | 0.26 | −1.63 | −0.63 | −4.41 | < 0.001 | 96.06 | 1077 | 548.81*** | 247.50 | 8001 mg |
| Magnesium | 1.48*** | 0.39 | 0.73 | 2.24 | 3.85 | < 0.001 | 96.64 | 877 | 187.35*** | 64.63 | 1301 mg |
| Phosphorus | 2.05*** | 0.40 | 1.28 | 2.83 | 5.18 | < 0.001 | 96.41 | 1077 | 858.38*** | 231.12 | 5001 mg |
| Iron | −1.27 | 0.38 | −2.02 | −0.51 | −3.29 | 0.001 | 98.48 | 1077 | 6.78*** | 1.99 | 101 mg |
| Sodium | 2.02** | 0.70 | 0.65 | 3.39 | 2.89 | 0.004 | 98.95 | 877 | 1784.92** | 355.61 | 10002 mg |
| Potassium | −2.37 | 1.57 | −5.44 | 0.7 | −1.51 | 0.131 | 99.42 | 877 | 2096.82 | 434.13 | 31002 mg |
| Vitamin A | 0.63 | 0.86 | −1.05 | 2.3 | 0.73 | 0.463 | 99.12 | 877 | 1828.36 | 594.26 | 15001 IU |
| Vitamin B1 | 1.45*** | 0.34 | 0.78 | 2.11 | 4.26 | < 0.001 | 93.68 | 527 | 0.83*** | 0.22 | 0.61 mg |
| Vitamin B2 | 2.36*** | 0.47 | 1.44 | 3.28 | 5.04 | < 0.001 | 92.55 | 422 | 1.38*** | 0.39 | 0.61 mg |
| Vitamin B3 | 1.23* | 0.53 | 0.19 | 2.26 | 2.32 | 0.02 | 97.28 | 527 | 9.65* | 2.61 | 81 mg |
| Vitamin B6 | 2.76* | 1.15 | 0.5 | 5.02 | 2.39 | 0.017 | 98.65 | 422 | 1.39* | 0.40 | 0.61 mg |
| Vitamin B9 | −0.54 | 0.44 | −1.4 | 0.33 | −1.22 | 0.222 | 99.95 | 694 | 0.12 | 0.08 | 0.21 mg |
| Vitamin C | 0.96*** | 0.26 | 0.46 | 1.47 | 3.74 | < 0.001 | 94.52 | 877 | 87.06*** | 47.45 | 501 mg |
| Vitamin D | −4.05*** | 0.83 | −5.68 | −2.42 | −4.88 | < 0.001 | 97.95 | 694 | 176.49*** | 63.47 | 4003 IU |
| Vitamin E | −0.09 | 0.65 | −1.35 | 1.18 | −0.13 | 0.895 | 99.32 | 877 | 5.37 | 1.64 | 62 µg |
| Energy value of the 1400 diet | 0.78*** | 0.15 | 0.47 | 1.07 | 5.08 | < 0.001 | 95.31 | 2057 | 1701.27*** | 388.43 | 1400 kcal |
Outcomes
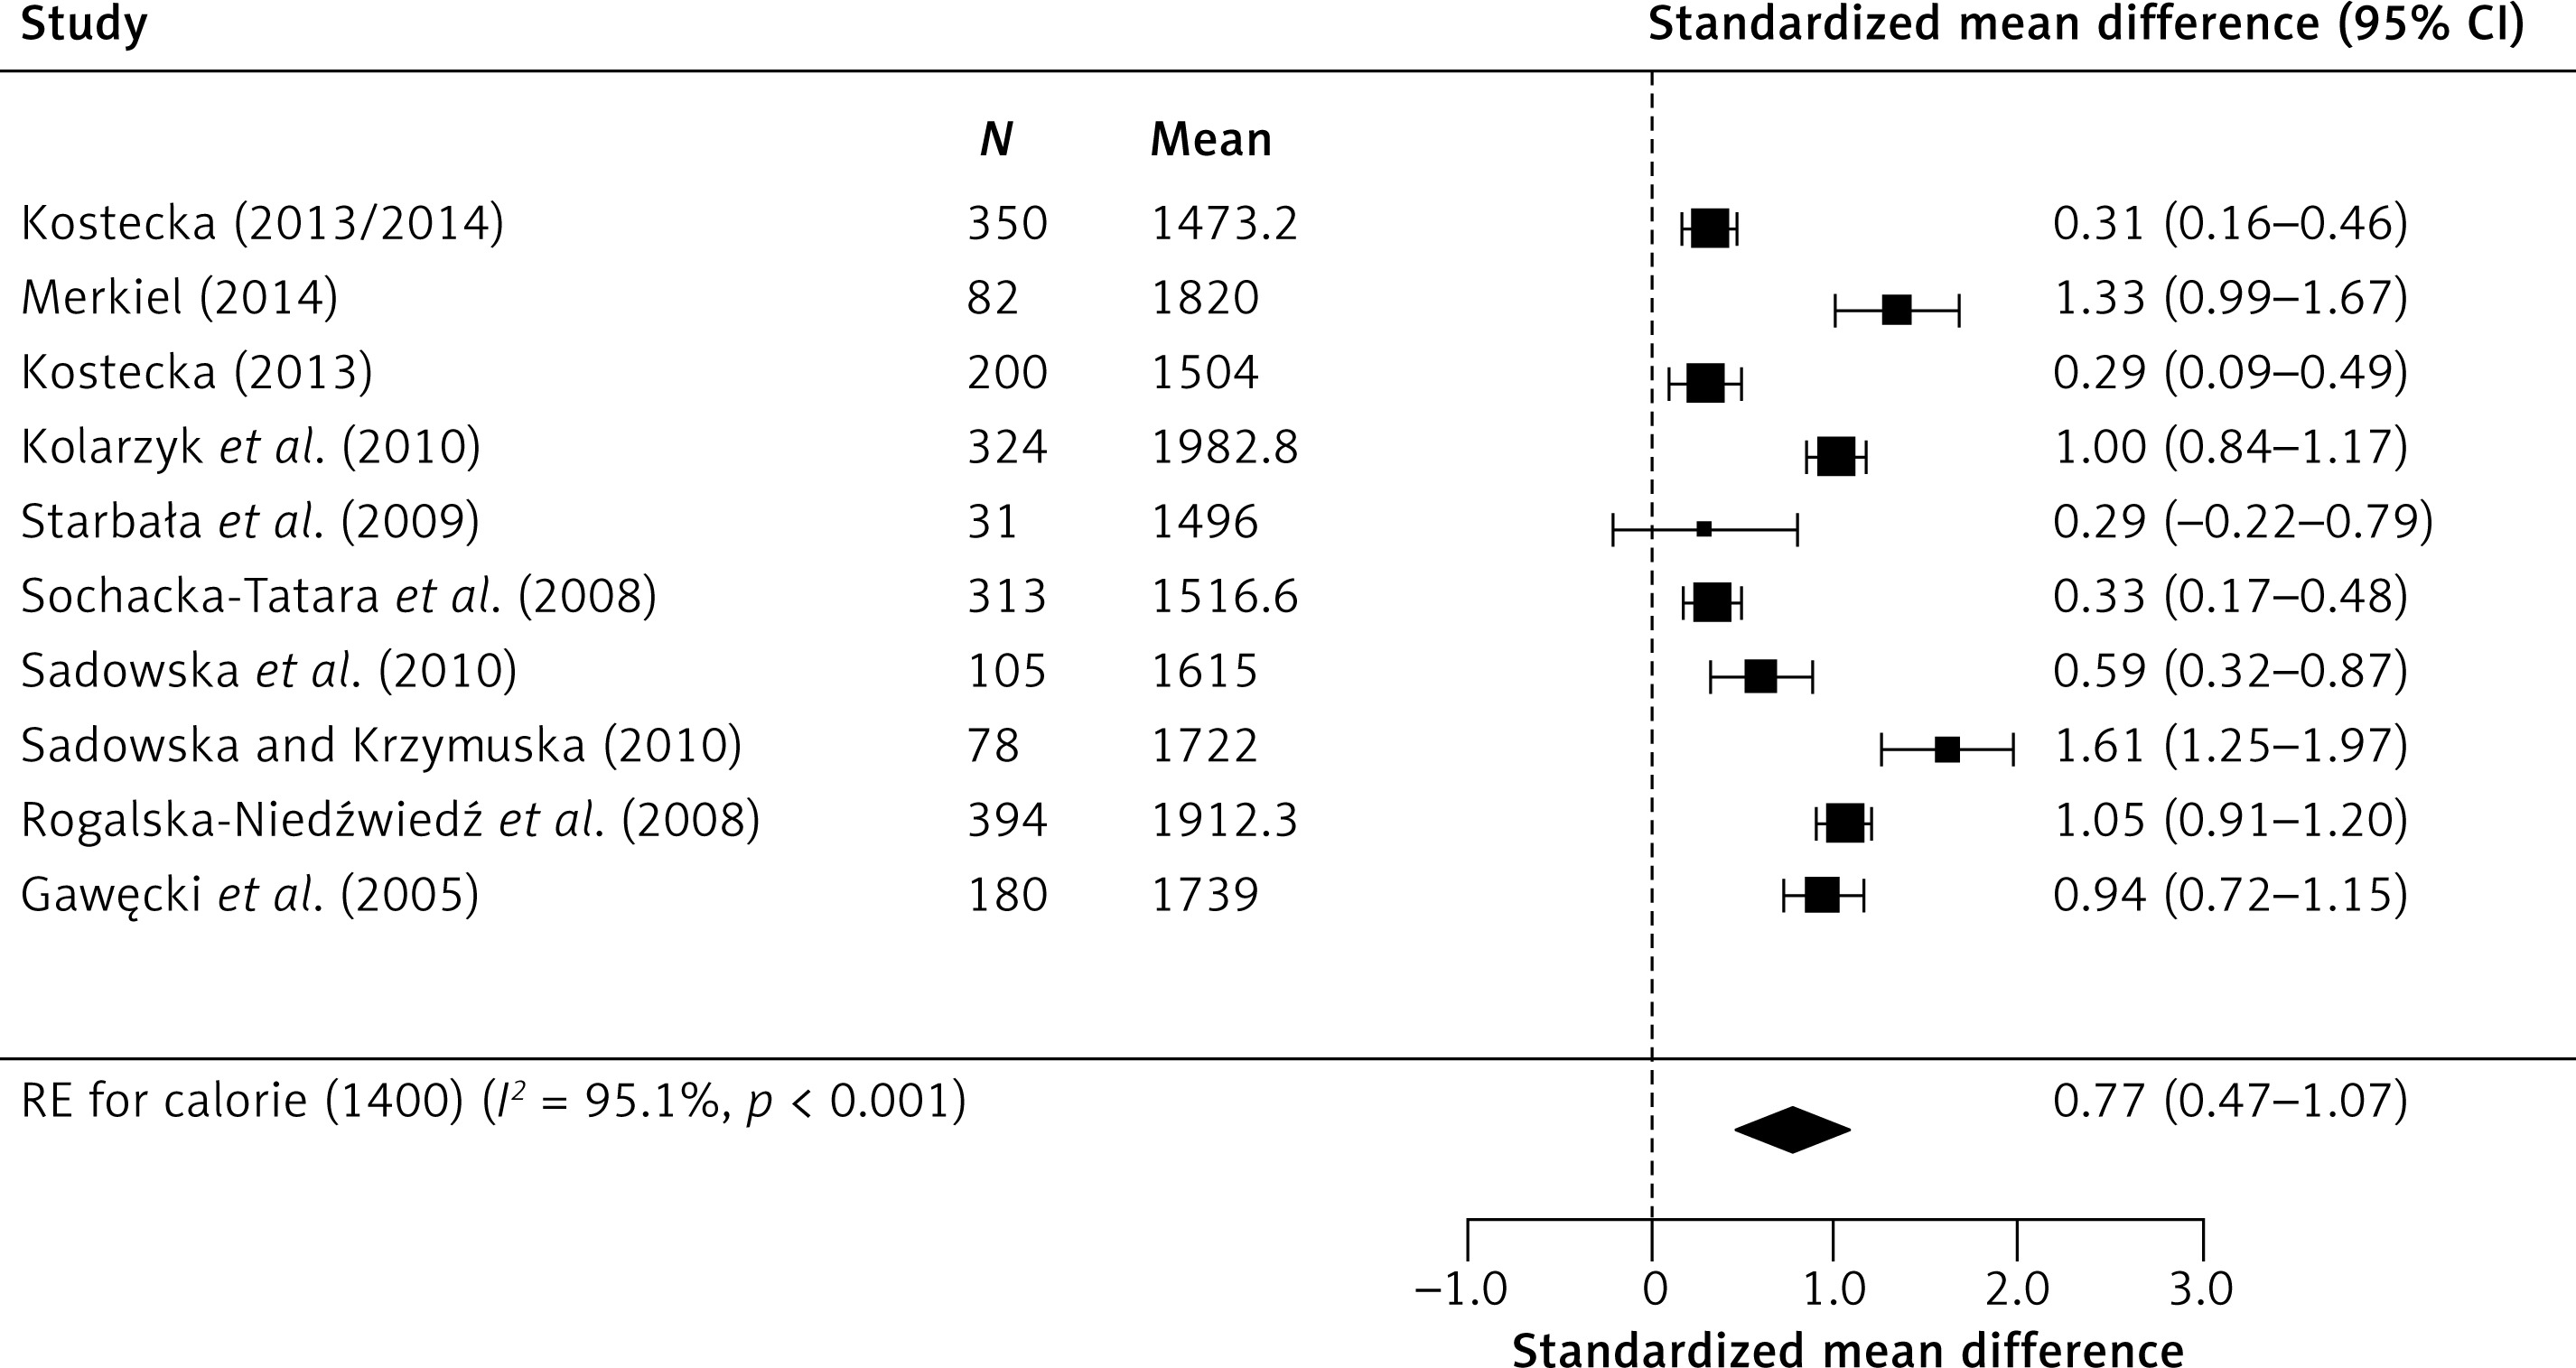
Meta-analysis of combined results from all studies provided a statistically significant cumulative effect (Figure 2). It also improved the reliability of effect assessment. In random-effects model analysis, the obtained cumulative effect (CE) for proteins was statistically significant (p < 0.001) at 2.74 (95% CI: 2.09–3.39), which means that the mean protein content in the diet of children studied was 111% higher [42] than indicated in dietary recommendations for this age group. Similarly, the results for carbohydrates deviate from dietary recommendations, as the CE (p = 0.027) was 0.34 (95% CI: 0.04–0.64), which means that the mean consumption of carbohydrates in the study group was 24% higher than recommended. In moderately high calorie diets, the analysis showed that the recommended norm is exceeded by 47%, CE 0.77, p < 0.001 (95% CI: 0.47–1.07) (Figure 3).
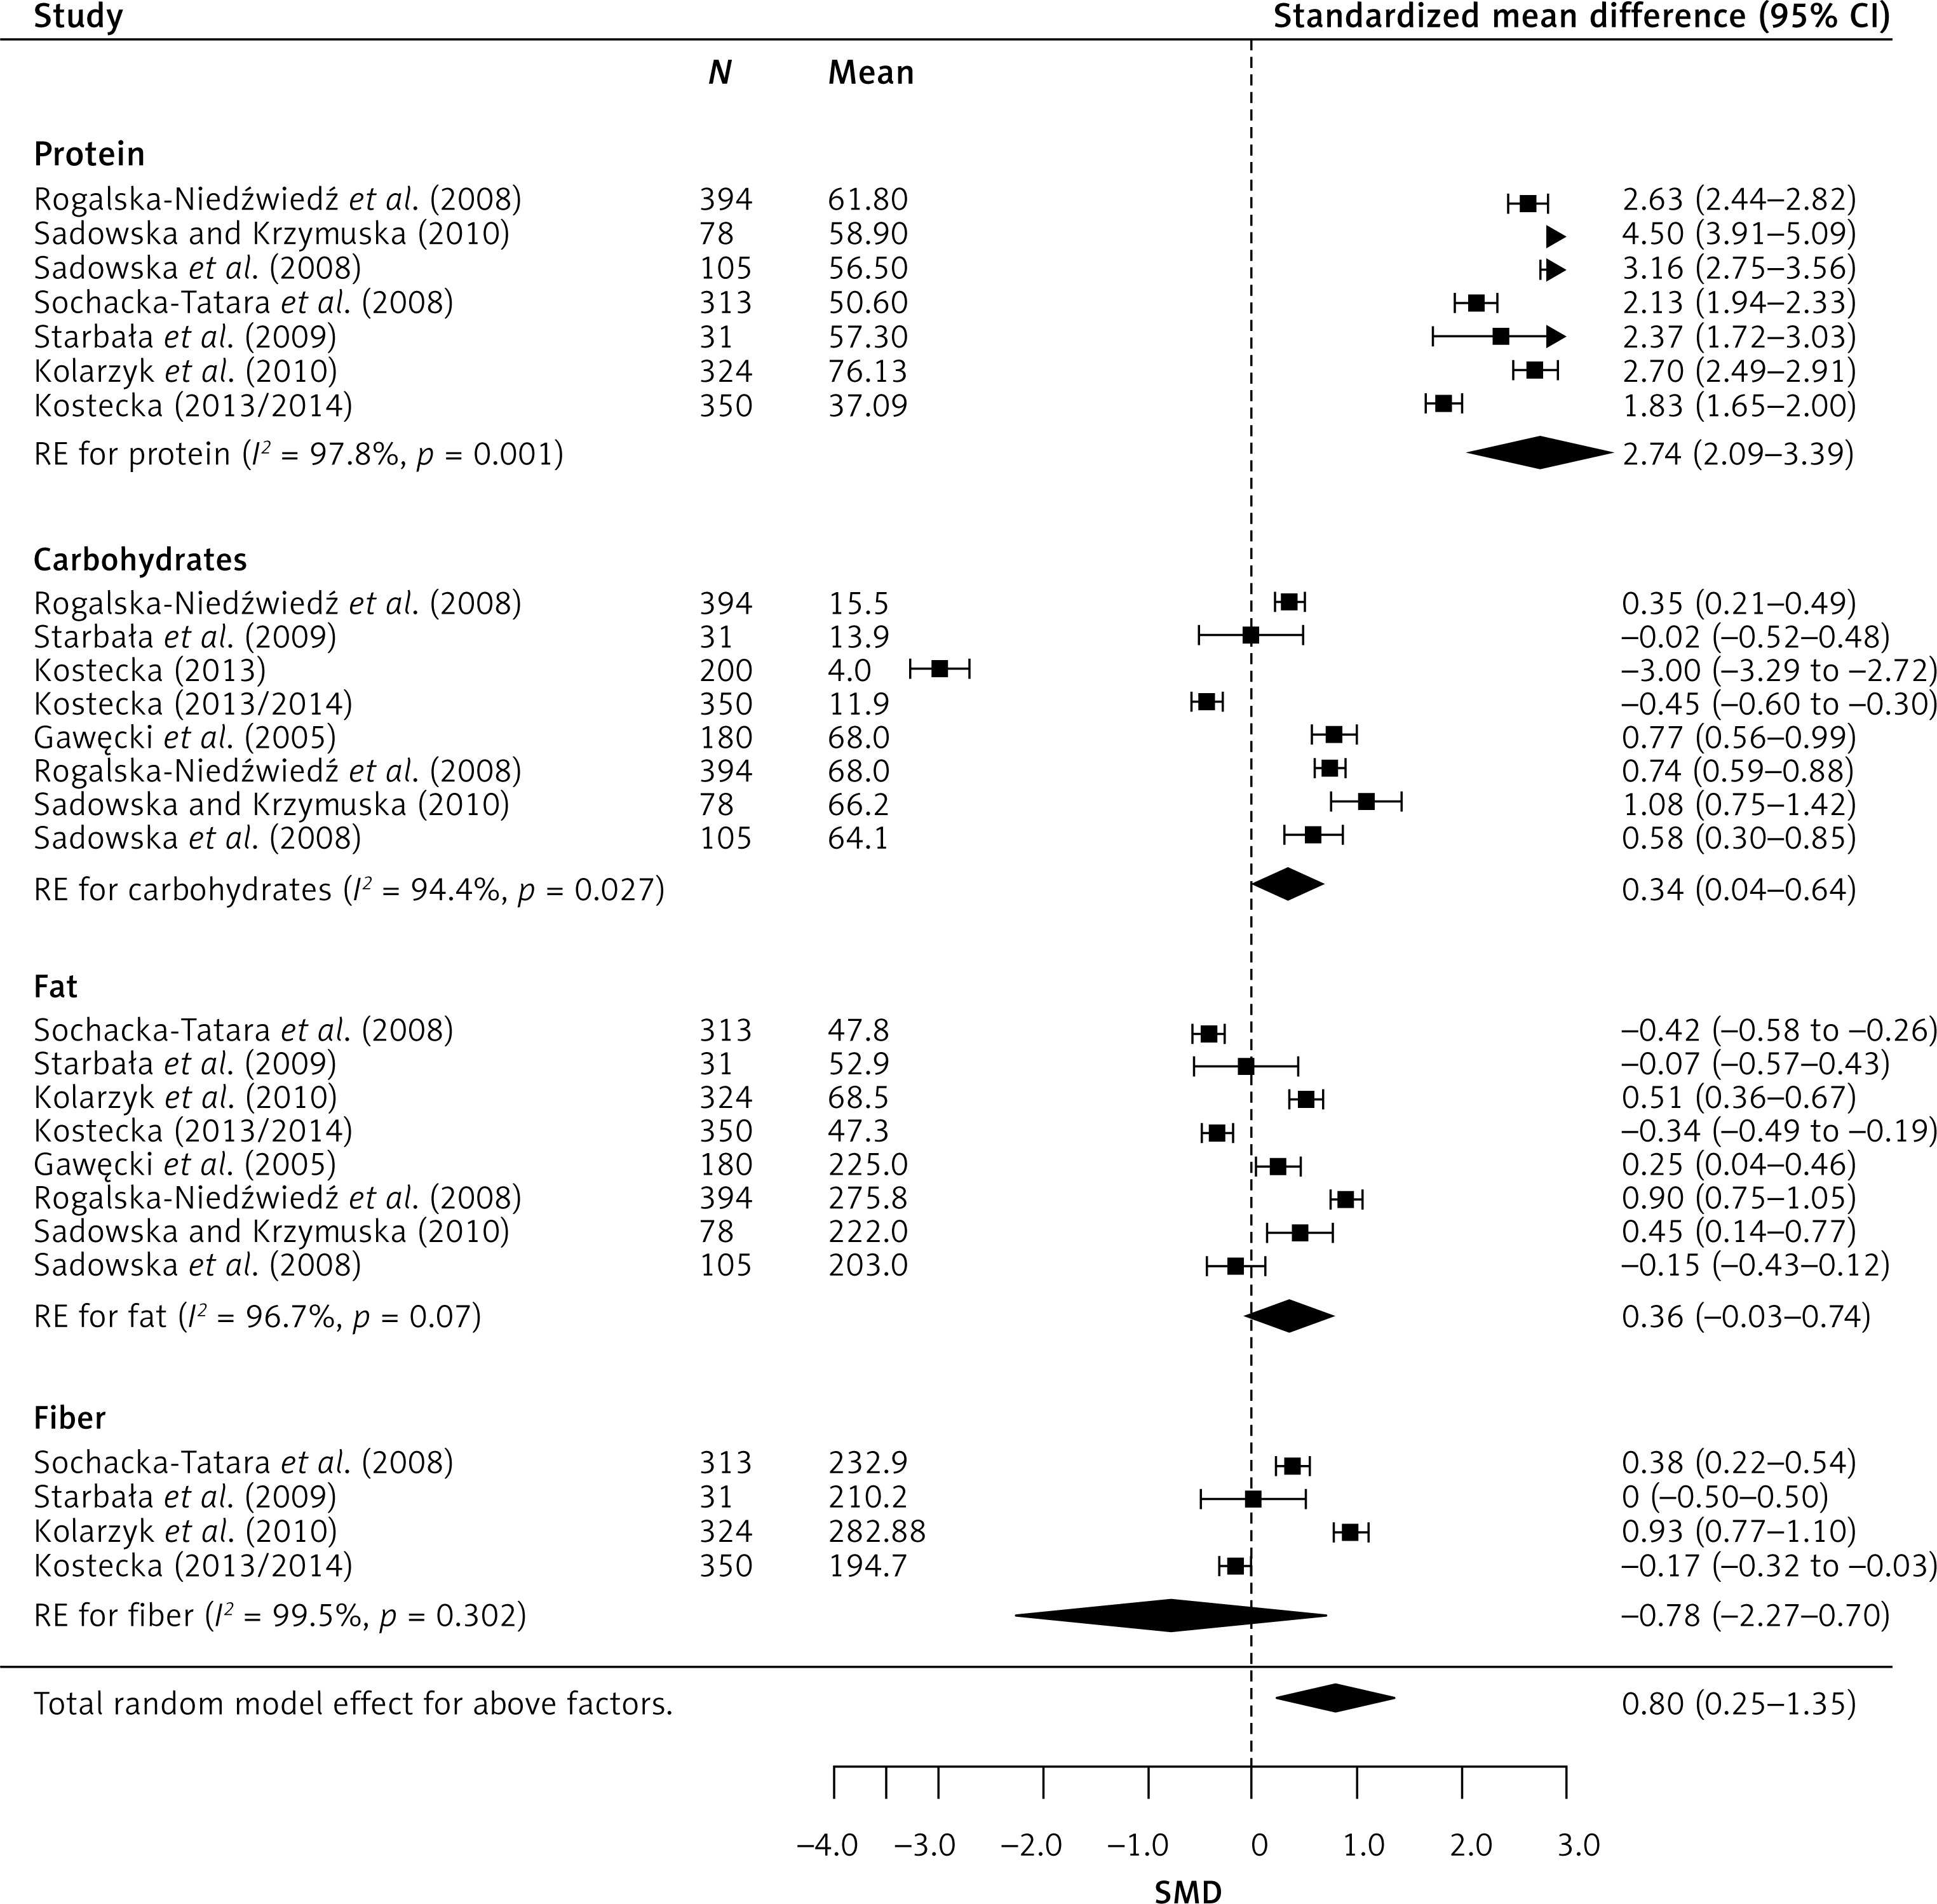
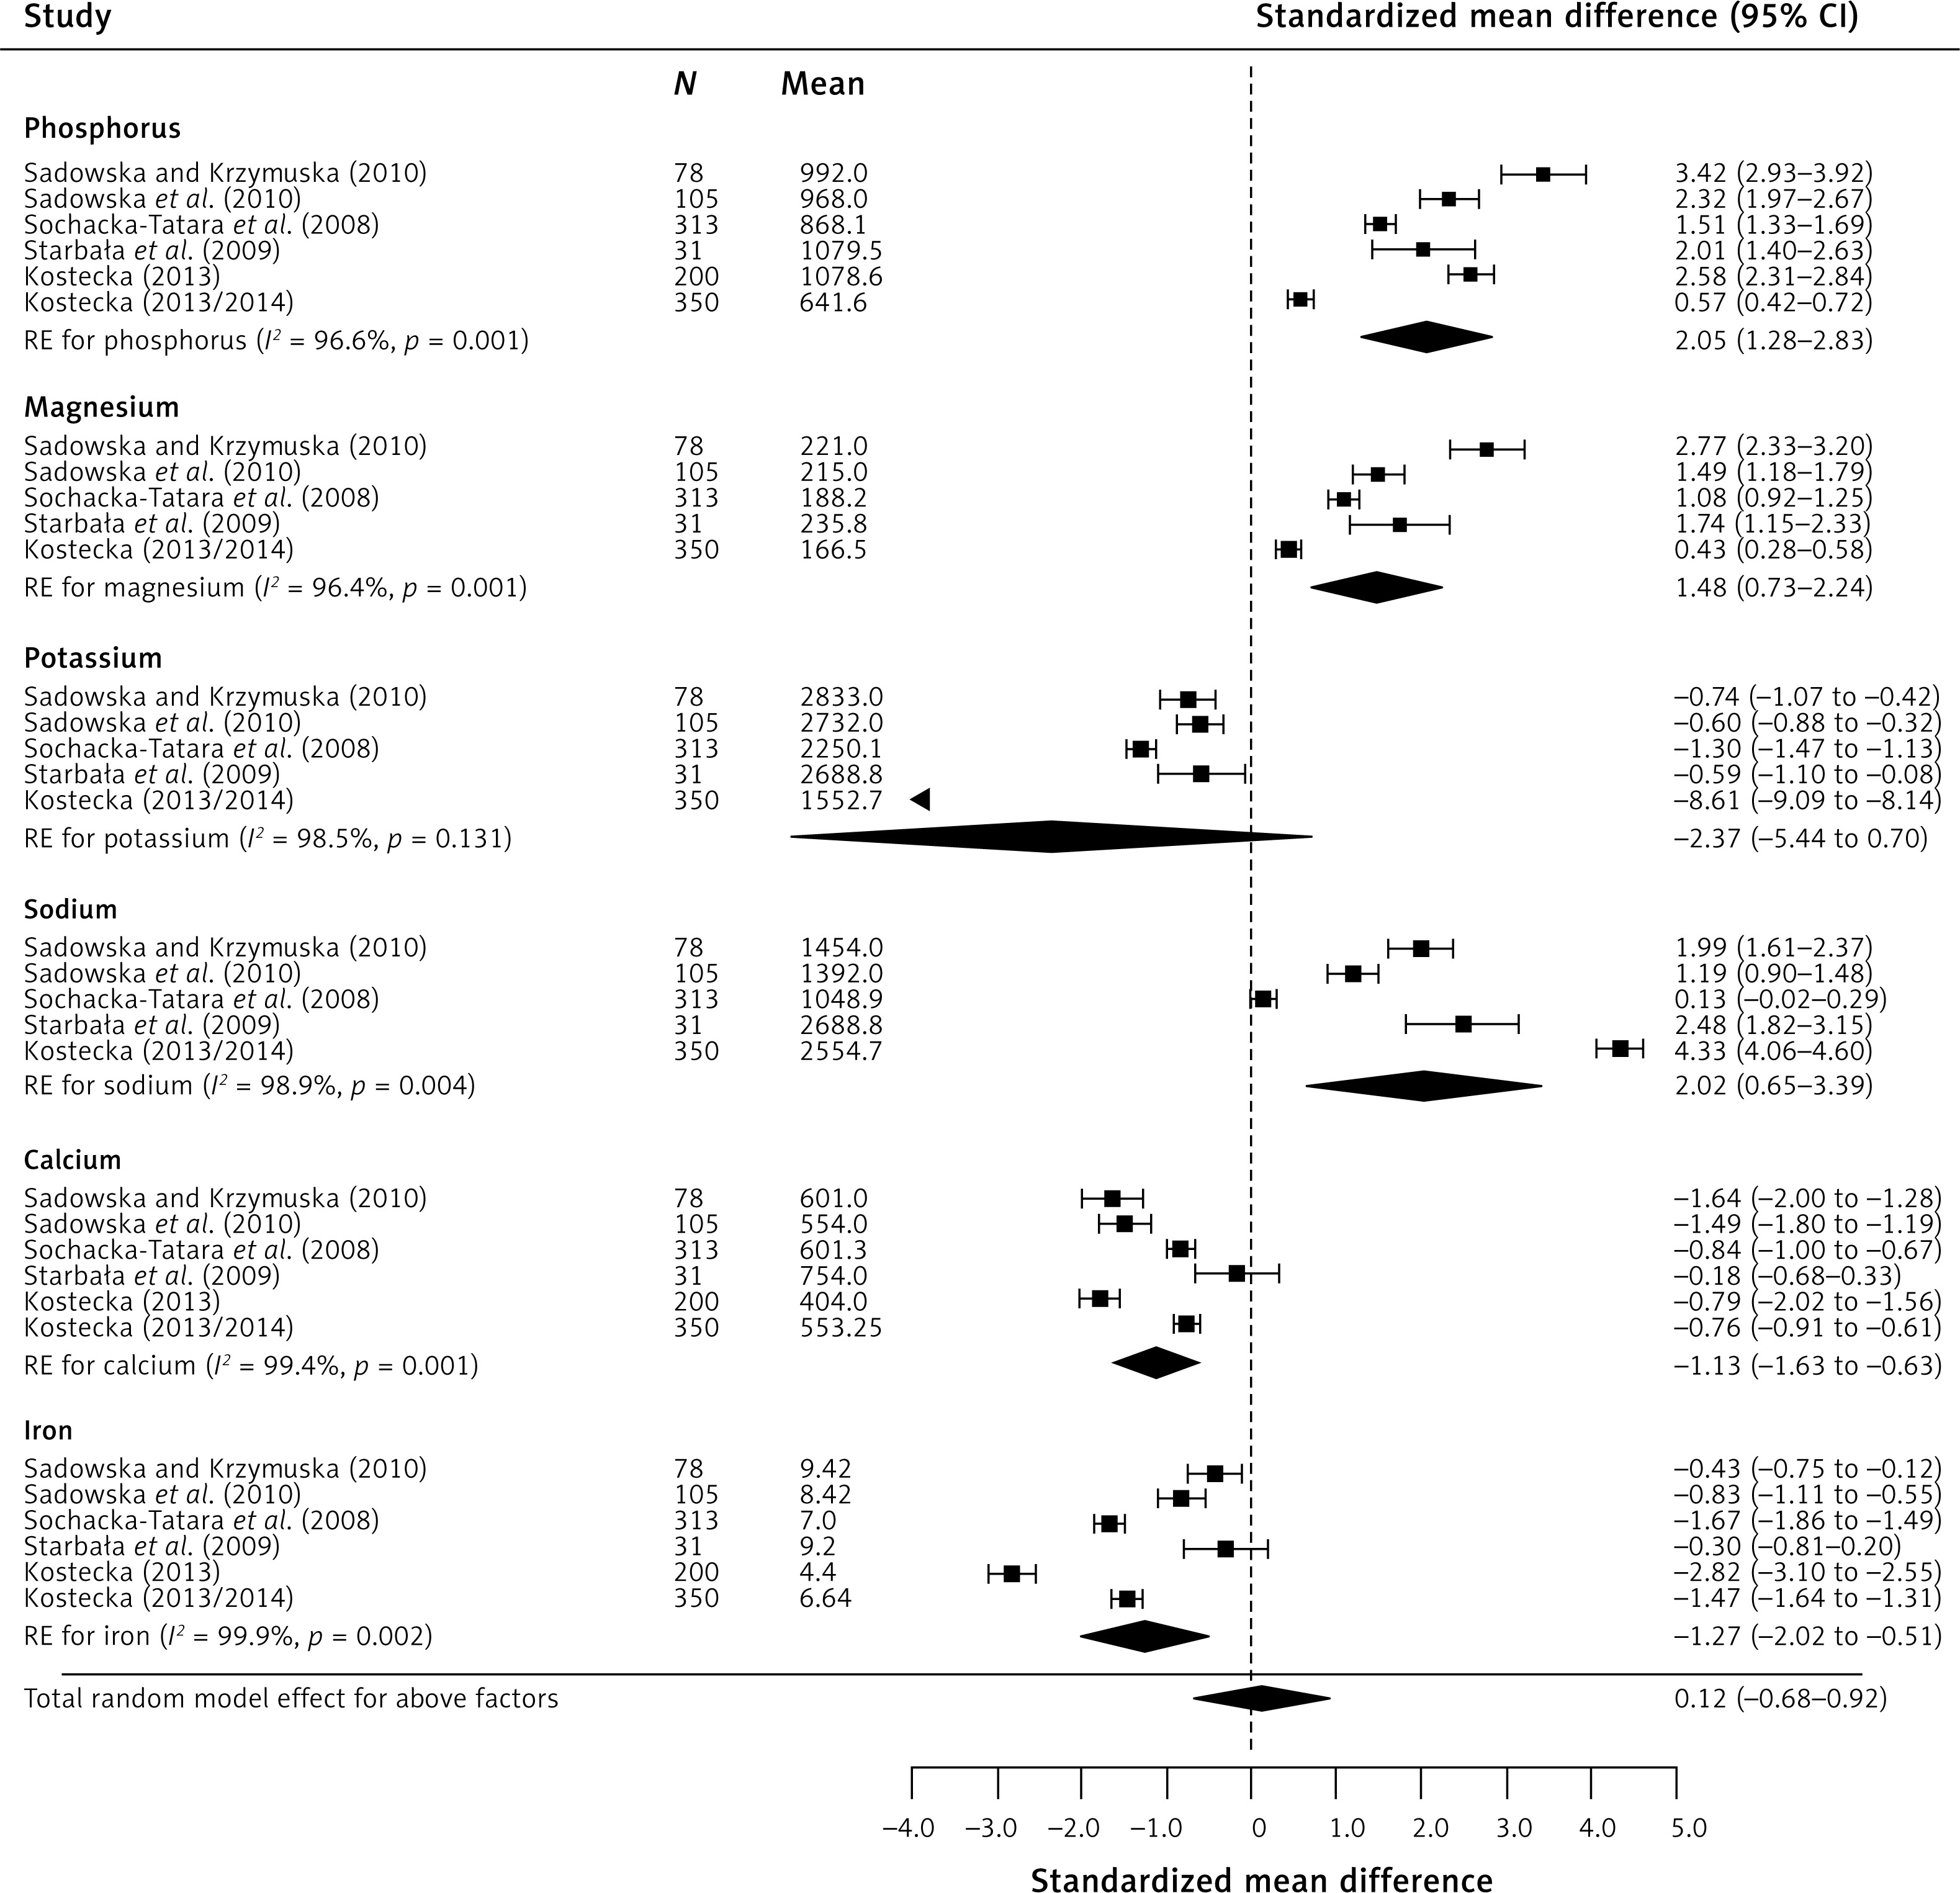
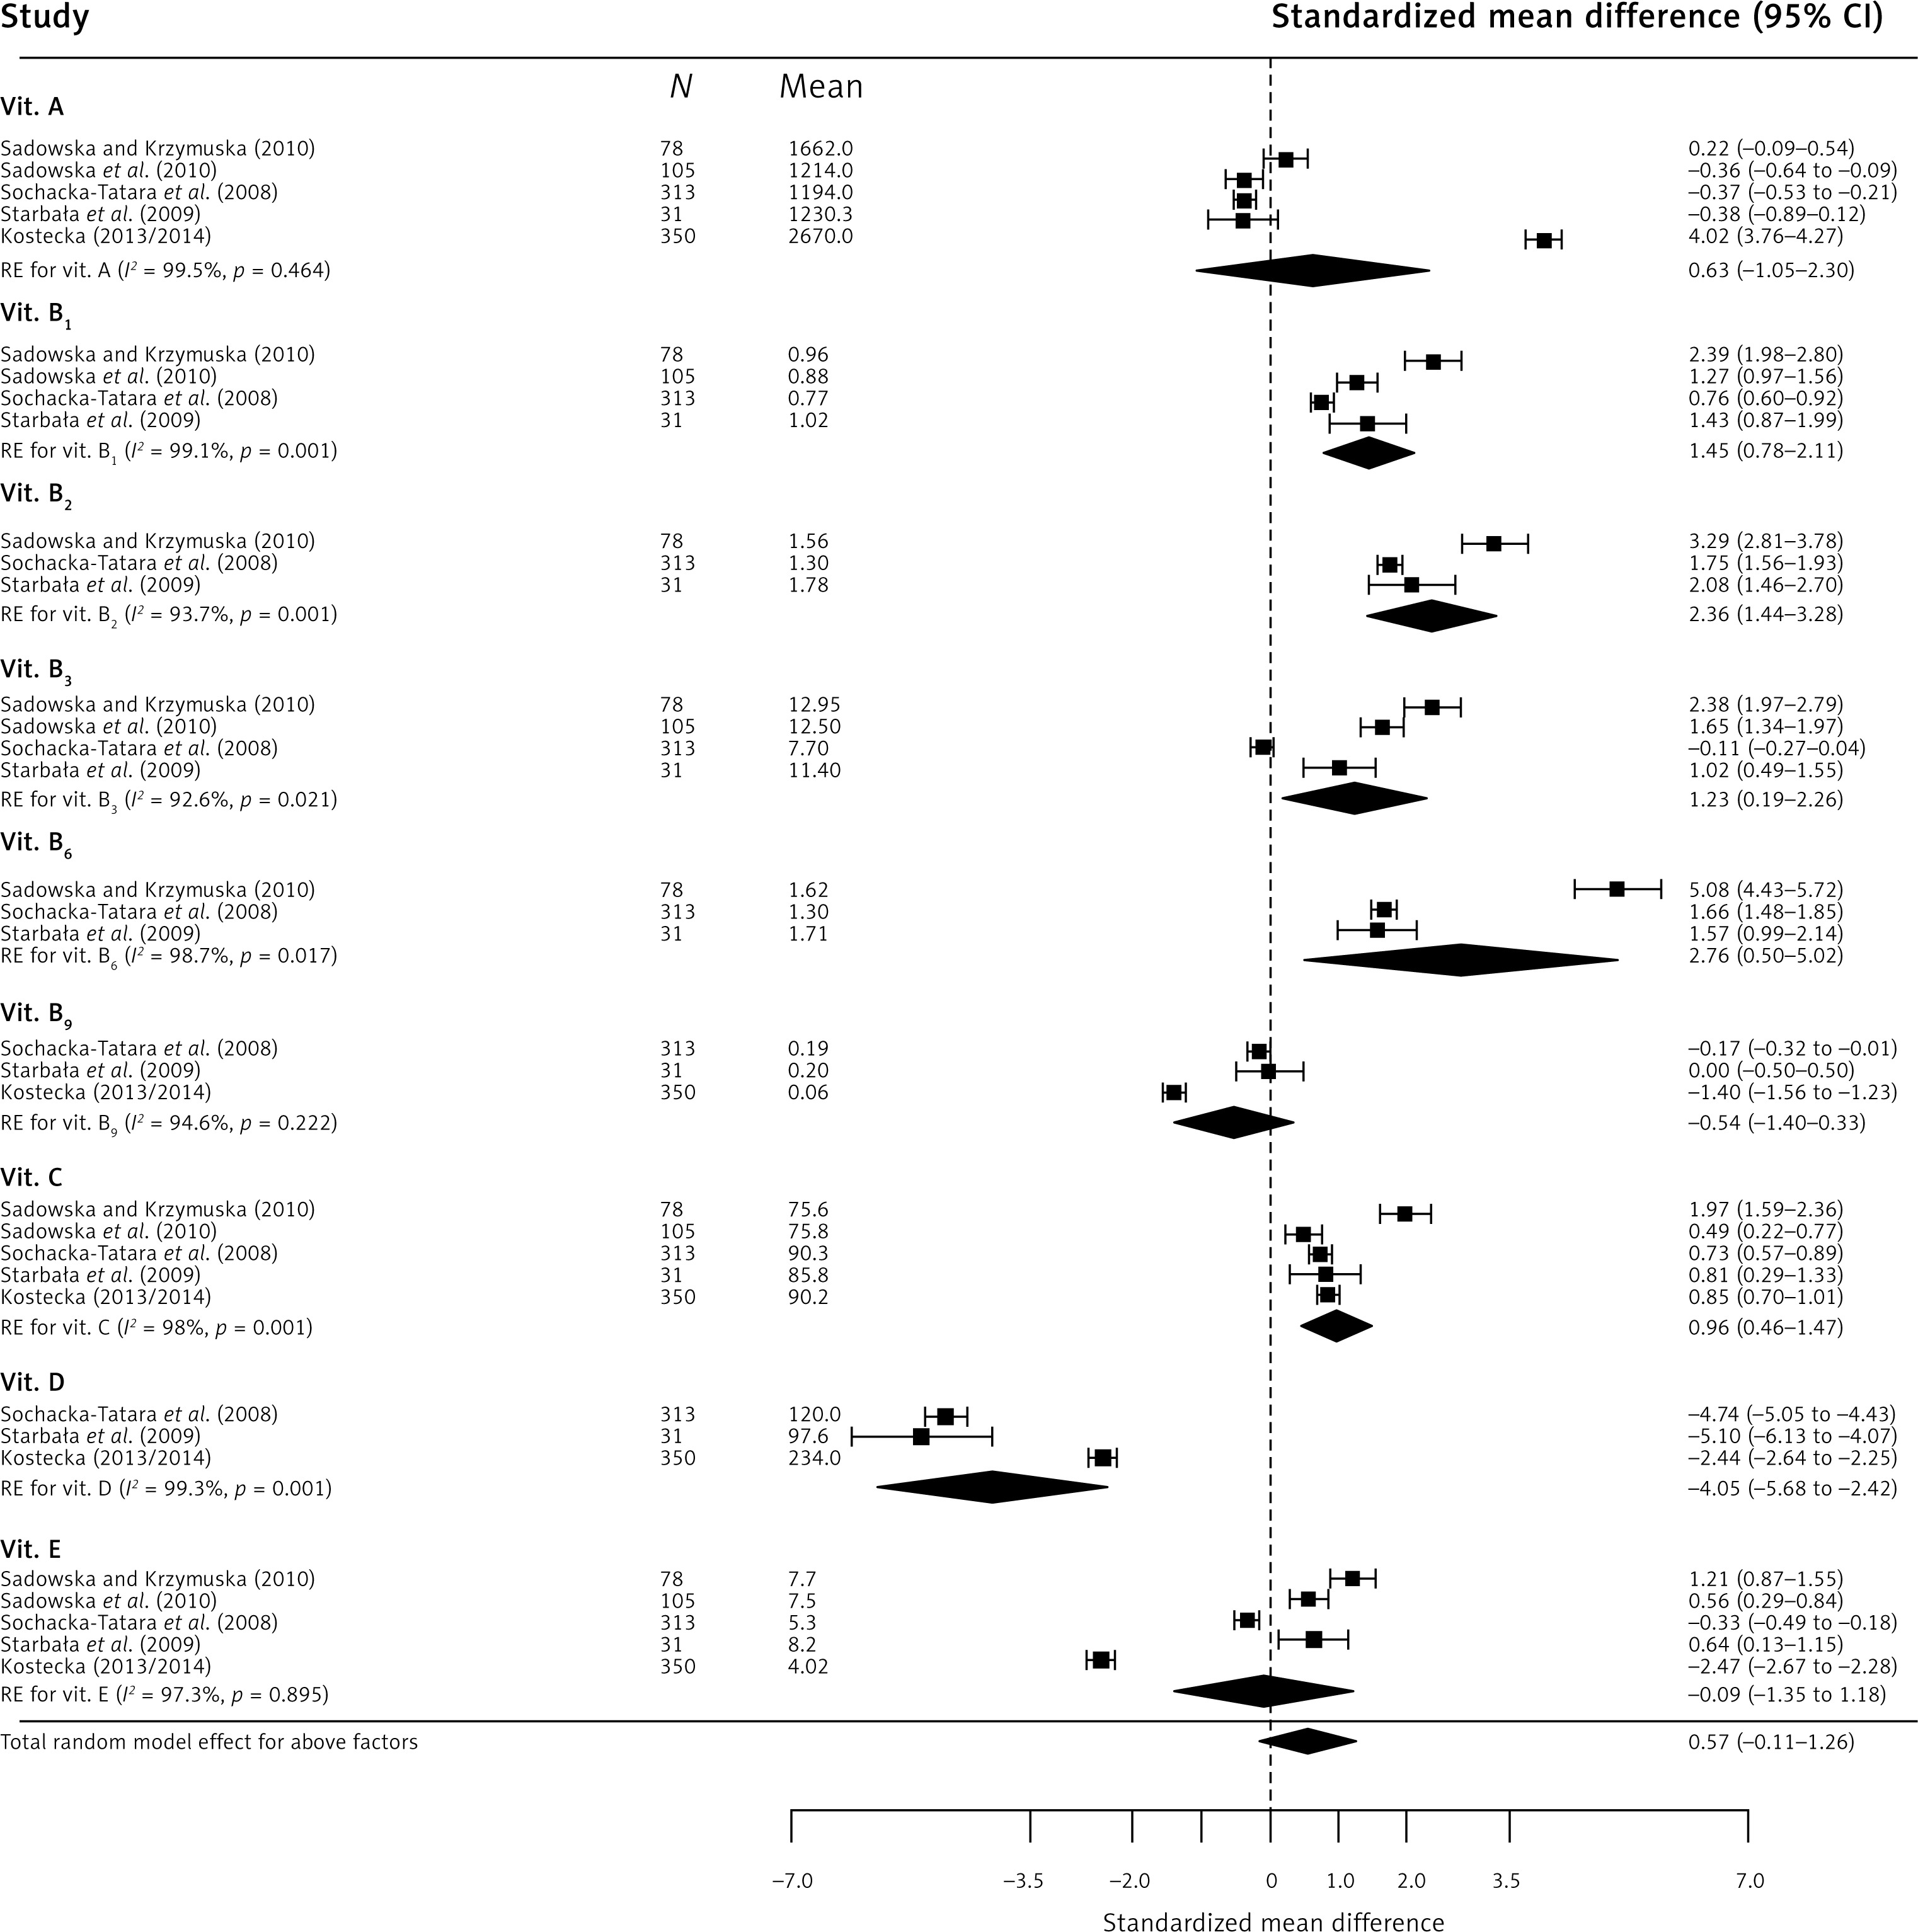
In the case of micronutrients (Figure 4), statistically significant results were obtained for magnesium CE 1.48 (95% CI: 0.73–2.24), phosphorus CE 2.05 (95% CI: 1.28–2.83), calcium CE –1.13 (95% CI: –1.63 to –0.63), and sodium CE 2.02 (95% CI: 0.65–3.39). The obtained results indicate significant exceedance of the recommended consumption norms for magnesium (by 72%), phosphorus (by 83%), and sodium (by 82%), while about 63% insufficiency was observed for calcium. Regarding vitamins (Figure 5), the findings were as follows: severe (about 164%) vitamin D insufficiency CE –4.05 (95% CI: –5.68 to –2.42), severe exceedance of the recommended norm for B vitamins: B1 – 71%, CE 1.45 (95% CI: 0.78–2.11), B2 – 96%, CE 2.36 (95% CI: 1.44–3.28), B3 – 64%, CE 1.23 (95% CI: 0.19–2.26), B6 – 112%, CE 2.76 (95% CI: 0.50–5.02), and exceedance of the recommended daily dose of vitamin C by 55%, CE 0.96 (95% CI: 0.46–1.47).
The calculated Q and I2 values indicate that the studies were highly heterogeneous, which may be due to inter-study variability caused by the use of different measurement tools and different methods to calculate the analysed parameters in individual studies.
Discussion
A properly formulated children’s diet, understood primarily as nutrient intake adequate to the demand and meeting energy needs [43], contributes to normal physical development, ensuring optimum weight and height gain, mental capacity, and general health condition. Moreover, low physical activity is not a significant obesity risk factor in children aged 7 to 9 years [44]. In early childhood, somatic development is especially sensitive even to the slightest nutrition inadequacies; moreover, this is the age at which Polish children receive double nutrition (at the kindergarten and at home). Double nutrition means eating meals twice. Most parents and grandparents in Poland collect their children from preschool facilities in the early afternoon hours, immediately or shortly after lunch. Once at home, the child may often eat a second lunch with their parents or grandparents, and are encouraged and praised for eating the whole two-course meal. Carers collecting their children later give them a large warm supper, with the presumption that the child has not eaten enough at preschool. While they provide the correct number (5–6) of meals, carers give children significantly larger amounts of high-calorie foods, rich in carbohydrates and animal protein, which can promote the development of overweight and obesity. This has been confirmed by the above results. The results revealed a series of irregularities in the eating habits of small children. The notably very high intake of protein with vitamins B2 and B6 can be due to the consumption of large amounts of meat. In preschool years, physical growth is extremely intensive and the consumption of protein is important during that period. However, protein should not be eaten in large amounts as it places a strain on the liver and kidneys due to the fact that nitric compounds are then excreted [45]. Authors from other countries who analyse preschool children’s diet have also noted excessive consumption of protein in their countries. Values for protein slightly lower than in Poland, but exceeding recommendations, were found in 2.5–6.5-year-old [46] and 4–6.5-year-old [47] children in Belgium, in 7-year-old children in the south-west of England [48], and 3–5-year-old children in Greece [49], while values even higher than those found in our meta-analysis were found in 4–5-year-old children in Vietnam [50] and 6–7-year-old children in Spain [51]. A reduction in animal protein intake is recommended as long-term excessive intake of protein entails an increased risk of diabetes [52], as well as premature pubertal onset, which may contribute to a higher risk of breast cancer in women [53].
Positive energy balance is another factor promoting formation of adipose tissue, which was found in the meta-analysis. Considering the fact that the number of overweight children is constantly on the increase [15–19], the results obtained by our meta-analysis and reports from authors in other countries (similarly high exceedance of recommendations was reported in 5–11-year-old children in France [54], in 6–7-year-old children in Spain [41], in 5.7–7.6-year-old children in Crete [55], and in Portugal – where the norm was exceeded by over 80% in 7–9-year-old children) [56] – collectively indicate that it is a serious global problem. In the case of children age 2.5–6.5 years in Belgium [46], 4–5 years in Greece [49] and 7 years in England [56], the norm was exceeded only in boys, by about 10%. In the case of children aged 4–5 years in Vietnam [50] and < 6 years in the United States [57], the norm was exceeded in both sexes.
As Pawlak [58] has reported, adults in Poland also significantly exceed the recommendations of proper nutrition and pass on this habit to their children. According to FAO 2012, energy intake per person in Poland in 2006–2008 was 3410 kcal, which is equivalent to 173% of the minimum daily demand. The consumption of protein was also significantly exceeded (101 g/person/day), which is over two times more than the level indicated in the recommendations for proper nutrition.
An unbalanced diet causes insufficient intake of important nutrients, which in turn has a detrimental effect on the development of young organisms. Recently, the diet of children in highly developed countries has been characterized not only by high-energy foods and high content of protein and fat, but also by low content of vitamins and minerals. This is confirmed in the meta-analysis which demonstrated insufficiency of vitamin D. Vitamin D insufficiency leads to disturbed homeostasis of calcium in the body, which can lead to disturbed development of the skeletal system and can adversely affect teeth [59, 60]. Studies also imply that vitamin D deficiency negatively affects insulin resistance and β-cell function [61, 62]. Although vitamin intakes cannot be compared directly to the results of other studies (because of the age differences among the studied populations of children), it is interesting to note that similar, or even lower intakes of vitamin D were observed in British 7-year-olds [47], as well as in Spanish 6–9-year-olds [63] and Belgian 4–6.5-year-olds [46]. In combination with very low calcium intake (which was also confirmed by our meta-analysis), this effect can be exacerbated and lead to rickets or low final weight of the bone tissue, which in turn may lead to osteopenia or even osteoporosis, as well as an increase in the risk of fractures at an older age [64]. The results obtained for calcium are significantly lower than in other European countries (Belgium [46], Spain [51], Portugal [56] and England [65]). This is very surprising, taking into consideration the very strong promotion of drinking milk in Poland in recent years. Additionally, it is worth noting that the meta-analysis demonstrated that the level of phosphorous intake is significantly excessive. Maintaining the normal proportion of calcium and phosphorous is very important, but immensely difficult at the same time. Improper Ca : P ratio in the consumed food portions significantly deviating from the value accepted as normal can disturb the calcium-phosphorous balance, as well as regulatory processes and the metabolism of many substances in the body. This can result in, for example, a reduction of the peak bone mass in children and adolescents, and subsequently in an increase of bone deformations and fractures as well as osteoporosis [66].
The content of sodium is another index of a healthy diet. Similarly to vitamin intakes, mineral intakes are not directly comparable to other studies. It is important to note that in all the studies analysed by our authors [46, 48, 51, 55, 57, 63, 65], sodium intake in children was between 100% and 250% higher than the recommended value. These results confirm the need to implement a programme limiting the intake of sodium, as it promotes water retention in the body and is one of the causes of arterial hypertension in adult life [67, 68]. It is important to note that lifelong dietary habits are formed during childhood. Therefore, a high prevalence of salty foods in childhood may lead to a preference for salty tastes later in life. Additionally, excessive sodium intake may disturb the absorption of calcium, since sodium enhances excretion of calcium in urine [69].
Moreover, the intake was too high for magnesium and six of the nine analysed vitamins. Similar results were obtained in Belgium [46], Greece [55], and England [65].
There are several strengths of this study. An obvious one is that by combining studies, a meta- analysis increases the sample size and thus the power to study effects of interest. As far as is known, this is the first meta-analysis on nutrition of Polish preschool children in comparison to existing recommendations. Our research allows conclusions to be drawn about increased risk of diet- dependent diseases in the later life of preschool children.
The meta-analysis detailed herein has certain limitations. Firstly, in the systematic review we identified 21 studies analysing the eating habits of children in Poland in the last decade, but only 10 of them could be used in the meta-analysis due to significant differences in the method of results presentation. Secondly, most of them are based on small samples. Thirdly, the greatest problem is the variety of measurement tools, which were not standard international tools, rendering comparison of results with other countries difficult. Often authors of these papers used their own tools for which they provided no information regarding the reliability and precision. This factor was the major cause of study heterogeneity.
In conclusion, the outcomes suggest that: (i) nutrient intake is not compliant with recommendations for this age group; (ii) the observed abnormalities may not only negatively affect the physical development of children, but also increase the risk of diet-related diseases in mature age – numerous studies demonstrate that cardiovascular risk factors and components of the metabolic syndrome with onset in childhood persist into adult life [70, 71], and obese children grow up into obese adults; (iii) the obtained results suggest that educational programmes (maybe even formal interventions) about proper diet need to be implemented for preschool children and their parents (e.g. the 15-week intervention programme “Junior for Seniors” concerning physical activity and nutrition conducted in 2015 [72]) – nutritional education at the earliest age can be a practical element of creating dietary behaviours, especially as the preschool period is a time when children have limited independent access to non-recommended foods, e.g. sweets and much depends on the behaviour of their parents or carers; (iv) no studies using standardized measurement tools have been carried out in Poland.