Introduction
Today, insulin resistance is a popular topic because of its important clinical endpoints. Patient questions about the topic are increasing at the polyclinic due to increased media attention and overall general knowledge. The term insulin resistance refers to a subnormal glucose response to a normal insulin level [1]. Diagnostic methods for measuring insulin resistance include the intravenous glucose tolerance test (IVGTT), the insulin tolerance test (ITT), the euglycemic insulin clamp test, the homeostasis model assessment of insulin resistance (HOMA-IR) score, and the quantitative insulin sensitivity check index (QUICKI). The gold standard test in a research setting is the euglycemic insulin clamp test, but none of these tests is recommended for assessment of insulin resistance in routine clinical practice. The new and easy approach to assess insulin resistance, triglyceride (Tg) to high-density lipoprotein (HDL) cholesterol ratio (Tg/HDL), has become an indicator of insulin resistance [2]. In a recent study, investigators found that high triglyceride to HDL cholesterol ratio (with the cut-off point of ≥ 3) is associated with insulin resistance in normal-weight healthy adults [3]. In addition to the insulin resistance, elevated Tg/HDL ratio predicts long-term mortality in patients with high cardiovascular risk factors [4].
We aimed to investigate associations between Tg/HDL and age, body mass index (BMI), waist circumference (WC), systolic and diastolic blood pressure (SBP, DBP), fasting blood glucose (FBG), and smoking in patients without diabetes mellitus.
Material and methods
Subjects
Our retrospective cross sectional study was conducted with the records of patients admitted to our clinic in 2015. Of these patients, 91 who met inclusion criteria were included in the study. Inclusion criteria were between 18 and 65 years of age, no diagnosis of diabetes mellitus, having a BMI between 18.5 and 40 kg/m2, no diagnosis of cancer, no established diagnosis or ongoing treatment of hypertension or hyperlipidemia and having appropriate laboratory and examination data in our hospital system. Exclusion criteria were 65 years or older age, having a BMI less than 18.5 or more than 40 kg/m2, diagnosis or ongoing treatment of diabetes mellitus, any type of cancer, hypertension and hyperlipidemia. The study was performed with the approval of the scientific board of Fatih Sultan Mehmet Education and Research Hospital in Istanbul, Turkey (approval number: 17073117-050.06, dated August 2, 2018) and it was conducted in accordance with the guidelines of the Declaration of Helsinki.
Methods
Laboratory parameters of Tg, low-density lipoprotein (LDL), HDL cholesterol, FBG, BMI (kg /m2), WC (cm), SBP and DBP (mm Hg), smoking status, and demographic data were collected from patients’ electronic records. Biochemical parameters were measured with an Abbott c16200i ARCHITECT photometric device (Abbott Diagnostics, Lake Forest, IL, USA). Patients whose Tg/HDL was under 3 were grouped as group A; those whose ratio was over 3 were grouped as group B.
Statistical analysis
Stata Version 14.2 was used for statistical analysis. Mean ± standard deviation (SD) was used for descriptive and continuous variables, and frequency and percent were used for categorical variables. A t-test was used to determine means ± SD differences between two groups. For descriptive variables the χ2 test was used. Correlation tables were used for correlation analysis. In addition to the difference of group means ± SD, the relation of Tg/HDL with each parameter was evaluated by multivariate regression analysis. The ordinary least squares test was used for the multivariate regression analysis, and p < 0.05 was considered statistically significant.
Results
A total of 91 patients (68 male, 23 female) who met the study criteria were included in the analysis. The mean age of the patients was 43 ±11.9 years in females and 47.3 ±11.8 years in males. When we looked at the causes of hospital admission, we found that 25 (27.5%) patients had fatigue, 16 (17.6%) patients had difficulty with weight loss, 10 (11%) patients had gastrointestinal complaints, such as abdominal pain or reflux, 7 (7.7%) patients had polyuria or polydipsia, 6 (6.6%) patients had hyperlipidemia, 5 (5.5%) patients had headache, 4 (4.4%) patients had difficulty gaining weight, 4 (4.4%) patients had hypothyroidism, and 14 (15.3%) patients had come to the clinic for other reasons (Table I). None of the patients who underwent initial evaluation in outpatient settings were hospitalized.
Table I
Causes of hospital admission
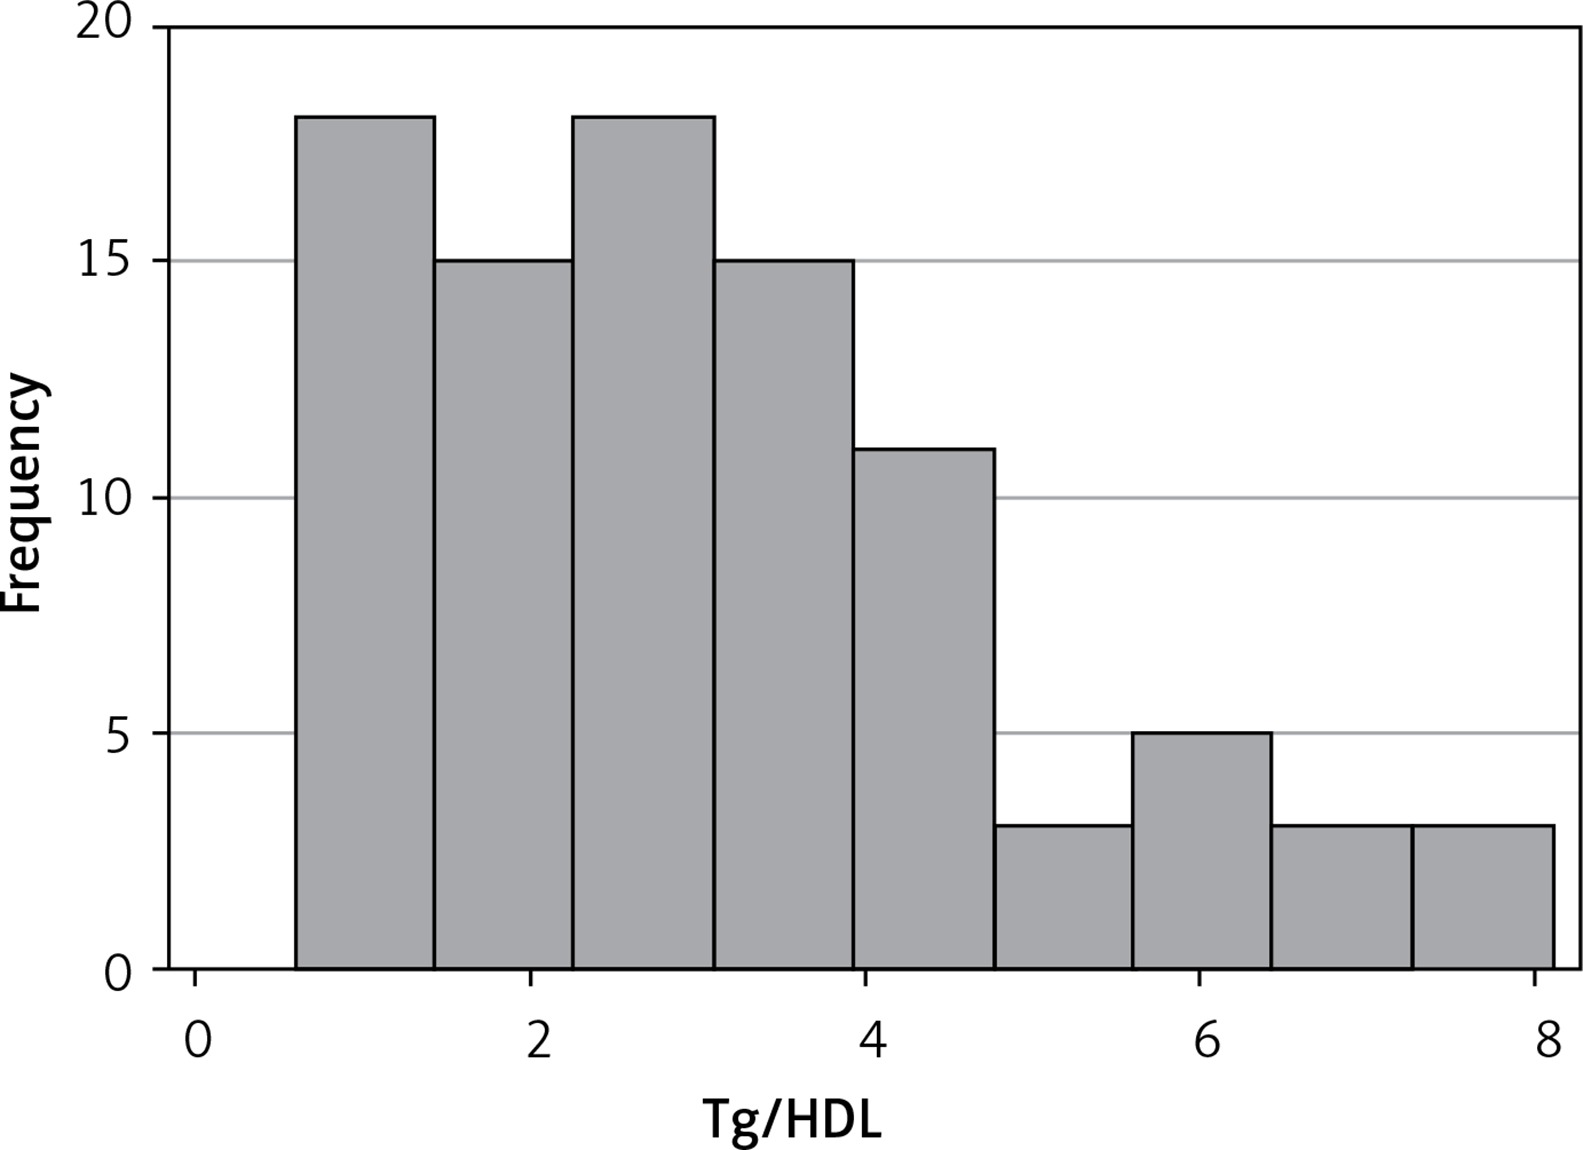
According to the Tg/HDL, 51 of the 91 patients (56%) were in group A with Tg/HDL below 3, and 40 patients (44%) were in group B with Tg/HDL above 3. The mean age was 41.9 ±11.7 in group A and 47.3 ±11.5 in group B (p = 0.01). Mean BMI was 27.8 ±5.3 kg/m2 in group A and 30.7 ±4.1 kg/m2 in group B (p < 0.01). Mean WC in groups A and B among males and females were 90.6 ±4.4 cm, 98.8 ±9 cm (p = 0.02), and 84.5 ±12.4 cm, 95.3 ±9.2 cm (p < 0.01), respectively. Mean SBP was 113.9 ±16.6 mm Hg in group A and 120 ±15 mm Hg in group B (p = 0.037), while mean DBP in the groups were 73 ±10.1 mm Hg and 78 ±8.5 mm Hg (p < 0.01). When we look at the frequency of metabolic syndrome in groups, metabolic syndrome was present in 9 (17%) patients in group A, and 25 (65%) patients in group B (p < 0.01). Although total cigarette exposure and FBG were higher in group B, the difference between the 2 groups was not statistically significant (Table II). A non-linear Tg/HDL distribution was found and is presented as a histogram in Figure 1 (obs: 91, mean: 3.09, Std dev: 1.76, variance: 3.11, skewness: 0.88, kurtosis: 3.23)
Table II
Means of variables in 2 groups and statistical relationship between them using the t-test
Tg/HDL was positively correlated with BMI and positively correlated with WC in correlation analyses. Correlation analysis between BMI, WC, and Tg/HDL in the total population is shown in Table III. It was observed that every 1-point increase in BMI caused a 0.1-point increase in Tg/HDL (coeff: 0.1089, std. er: 0.035, t = 3.05, P > |t|: 0.003, 0.0378–0.1801 (95% conf. interv.)), and smoking caused a 1.09-point increase in Tg/HDL (coeff: 1.0926, std. er: 0.3871, t = 2.82, P > |t|: 0.006, 0.3228–1.862 (95% conf. interv.)) in multivariate regression analysis by calculation of other reasons that may influence the results, such as age, SBP, DBP, and FBG (Table IV).
Table III
Correlation coefficients and p values of correlation analyses between BMI, WC and Tg/HDL
| BMI | Tg/HDL | WC | Tg/HDL | ||
|---|---|---|---|---|---|
| BMI | 1.0000 | WC | 1.0000 | ||
| Tg/HDL | 0.3348 | 1.0000 | Tg/HDL | 0.4727 | 1.0000 |
| p = 0.0012 | p < 0.001 |
Table IV
Multivariate regression analysis between Tg/HDL ratio and other variables that may influence like BMI, age, blood pressure, and smoking
Discussion
Insulin resistance is defined as a subnormal biological response to normal insulin concentrations [1]. It is associated with cardiovascular disease (CVD), obesity, type 2 diabetes, and polycystic ovary syndrome [5]. Euglycemic clamp, IVGTT, ITT, HOMA-IR, and QUICKI methods can be used for diagnosis, but these techniques are more useful in study design and research settings. These techniques are not useful and easy to implement during clinical routine.
An easy and new technique called Tg/HDL has been used to diagnose insulin resistance, and, according to recent research, it has proved to be a reliable method for some special populations [2]. Guo et al. stated that Tg/HDL is a promising biomarker for distinguishing individuals with abnormal glucose tolerance, and can be used to predict prediabetes and type 2 diabetes mellitus in the Chinese population in their study [6]. In another study Tg/HDL ratio was found to be an independent predictor for incident diabetes in male patients in the Chinese population [7].
Researchers identified the reliable cut-off point of the ratio as 3 to determine the resistance in that study, in which the sensitivity was found to be 64% and specificity was found to be 68% for this cut-off point [2]. Another study identified the cut-off point as 2.5 in women and 3.5 in men [8]. In a large analysis of 2,652 non-diabetic adult men and women in the United States, Tg/HDL was a useful indicator of insulin resistance in Whites, Blacks, and Mexican Americans [9]. In another study, the ratio was found to be associated with insulin resistance in white obese boys and girls [10]. In our study, we created 2 groups by using Tg/HDL. To determine the groups, our cut-off point was 3. Patients with Tg/HDL less than 3 were included in group A and those with Tg/HDL greater than 3 were included in group B. These groups may be considered representative of people with and without insulin resistance. In our study, however, we did not want to identify these groups as being with or without insulin resistance. The reason for this is that, despite previous studies, Tg/HDL may not reflect insulin resistance alone. Even if it does, the chosen value may not be accepted and reliable. There is no doubt that Tg/HDL ratio is related to insulin resistance but no consensus on which cut-off ratio to use for diagnosis of insulin resistance. There are studies which preferred the Tg/HDL ratio of 2.5 or 3 for the cut-off point for diagnosis of insulin resistance. Therefore we applied such a definition to the groups. We found a non-linear Tg/HDL distribution and made it into a histogram, as can be seen in Figure 1. Our results are not driven by some outlier observations of Tg/HDL. Kurtosis of this variable is measured to be 3.23, which ensures the reliability of the coefficient estimates. Tg/HDL does not exhibit a uniform distribution, but its dispersion is not heavily skewed to misleadingly distort the estimates.
WC, which is a metabolic syndrome parameter, is generally related to obesity. Obesity caused by a sedentary lifestyle or high calorie intake is a big problem in many countries because it causes CVD and related morbidity and mortality. Du et al. announced that BMI and WC alone or in combination had independent effects on CVD risk factors, and in combination they would be more predictive [11]. Not only CVDs are associated with obesity or high WC, but also metabolic diseases, such as diabetes mellitus, insulin resistance, and dyslipidemia. In a study including 66 non-diabetic adult obese patients, WC and waist-to-hip ratio were found to be significantly associated with Tg/HDL [12]. From another study that included young men, a multivariate linear correlation analysis showed that HOMA-IR was significantly associated with WC and Tg [13]. Erem et al. found that dyslipidemia was significantly associated with the factors of age, BMI, WC, and male gender in Turkish adults [14]. In a Chinese study including 12,018 adults, impaired glucose regulation, dyslipidemia, and insulin resistance were 1.36, 1.92, and 3.44 times greater, respectively, in the overweight group than those in the normal weight group [15].
We found that WC, BMI, and SBP and DBP were higher in group B than group A, and the differences between the groups were statistically significant. It should be noted that even in group A and group B, the mean WC in both males and females was above the acceptable range of WC, which is one of the parameters of metabolic syndrome. In addition, when we evaluate the patients in terms of the metabolic syndrome according to the criteria of the International Diabetic Federation (IDF) [16], the frequency of metabolic syndrome was significantly higher in group B, as expected. Although the patients of the 2 groups are in the same decade or age, it should be kept in mind that the mean age of group B was significantly higher except for in multivariate regression analysis. The effect of age was also calculated, and variables were reevaluated. FBG and total cigarette exposure in group B were higher than group A, but the difference was not statistically significant.
We also found that BMI and WC were positively correlated with Tg/HDL in correlation analysis. Every 1-point increase in BMI caused a 0.1-point increase in Tg/HDL, and smoking caused a 1.09-point increase in Tg/HDL in multivariate regression analysis. This relationship between cigarette use or obesity and Tg/HDL indicates that smoking cessation or lifestyle management could reduce the risk of dyslipidemia and CVD.
This study has some limitations. One is the low number of patients included in the study. If the number of patients were higher, we might obtain more reliable results. The other limitation is the design of the study. Our study is a retrospective cross sectional study. We collected data from patients’ past medical records. This made it difficult for us to find suitable patients, and, as a result, the number of patients we included in the study remained low. In this study, which we planned as a cross-sectional study, we included the current examination and laboratory findings of the patients. We did not conduct any analysis regarding the diagnosis and the treatments performed after the diagnosis. It may be that a prospective design could help us to conduct more powerful analyses. Despite all this, we describe our study as an additional study that supports the literature.
In conclusion, WC, BMI, SBP, and DBP are higher in the group in which Tg/HDL is higher. Further, high BMI and smoking are also related to high Tg/HDL in our study. Prospective studies of higher quality in this area may contribute to additional, valuable research.