Introduction
Breast cancer (BC) is the most common tumor among women. Although the mortality rate is decreasing mainly due to early diagnosis and improved therapeutic management, it remains the most common cause of cancer-related death in women [1, 2]. The carcinogenesis of BC is multi-factorial, with early menarche, late full-term pregnancy, late menopause, and postmenopausal obesity all having been recognized as risk factors for BC [3, 4].
Leptin, as a 167 amino acid polypeptide, was first reported as a regulator of food intake, metabolic rate and reproductive function, but recent studies have demonstrated its multi-functional role in immunity, cell proliferation, inflammation, etc. A growing number of studies have suggested that leptin may be involved in the initiation and progression of human cancers [5, 6]. Leptin is required for normal mammary gland development and lactation. Nevertheless, leptin may also contribute to mammary tumorigenesis. It is expressed in malignant epithelial cells of the breast [7, 8] and seems to be associated with stimulation of the growth of BC cells [9, 10]. There is a positive correlation between serum leptin levels and its mRNA level in the tumor. Moreover, individuals with an elevated serum leptin level might be at a higher risk of BC [11]. Tessitore et al. [11] and Chen et al. [12] reported positive correlations between serum leptin expression and BC risk, whereas other investigators did not find this relationship [13, 14].
Several leptin and leptin-receptor gene polymorphisms have been studied in BC patients among different populations. It was found that subjects carrying the leptin G-2548A (rs7799039) gene polymorphism had an increased risk for breast carcinoma [15, 16]. Nevertheless, some studies reported that leptin G-2548A gene polymorphism was not associated with susceptibility to BC [17–19].
The results regarding leptin concentration and leptin –2548 G/A gene polymorphism association with BC are still inconclusive. Hence, we conducted a comprehensive review and meta-analysis. The main goal of this study was to find correlations between circulating leptin and breast cancer (BC), and between polymorphism G2524A and susceptibility to BC.
Material and methods
Search strategy
We searched for related studies electronically in PubMed, EMBASE and The Cochrane Library databases (from January 1 1995 to Jun 30 2017, no language restrictions). For BC patients and healthy controls, the detection of leptin concentration was performed using serum or plasma blood samples. The keywords were searched in all fields: “breast cancer”, “breast carcinoma”, “breast neoplasm”, “breast tumor”, “leptin”, “adipokines”, “leptin G-2548A”, “rs7799039”, “gene polymorphism”. Variants of keywords were also used for the literature search. In addition, reference lists from full texts also were checked to identify other potentially missing eligible articles. No method restrictions were applied; the articles from all countries were accessible.
Inclusion criteria and exclusion criteria
Studies were retained in this meta-analysis if they met the following inclusion criteria: (1) consisted of original research (including case-control, cohort or cross-sectional studies) published in a peer-reviewed journal; (2) had information about leptin concentration for both BC patients and age- and sex-matched normal controls; (3) studied leptin G-2548A (rs7799039) gene polymorphisms in case and control groups; (4) publications in English. If more than one article was reported from the same study, only the most eligible one was included in the present study, considering data integrity and availability.
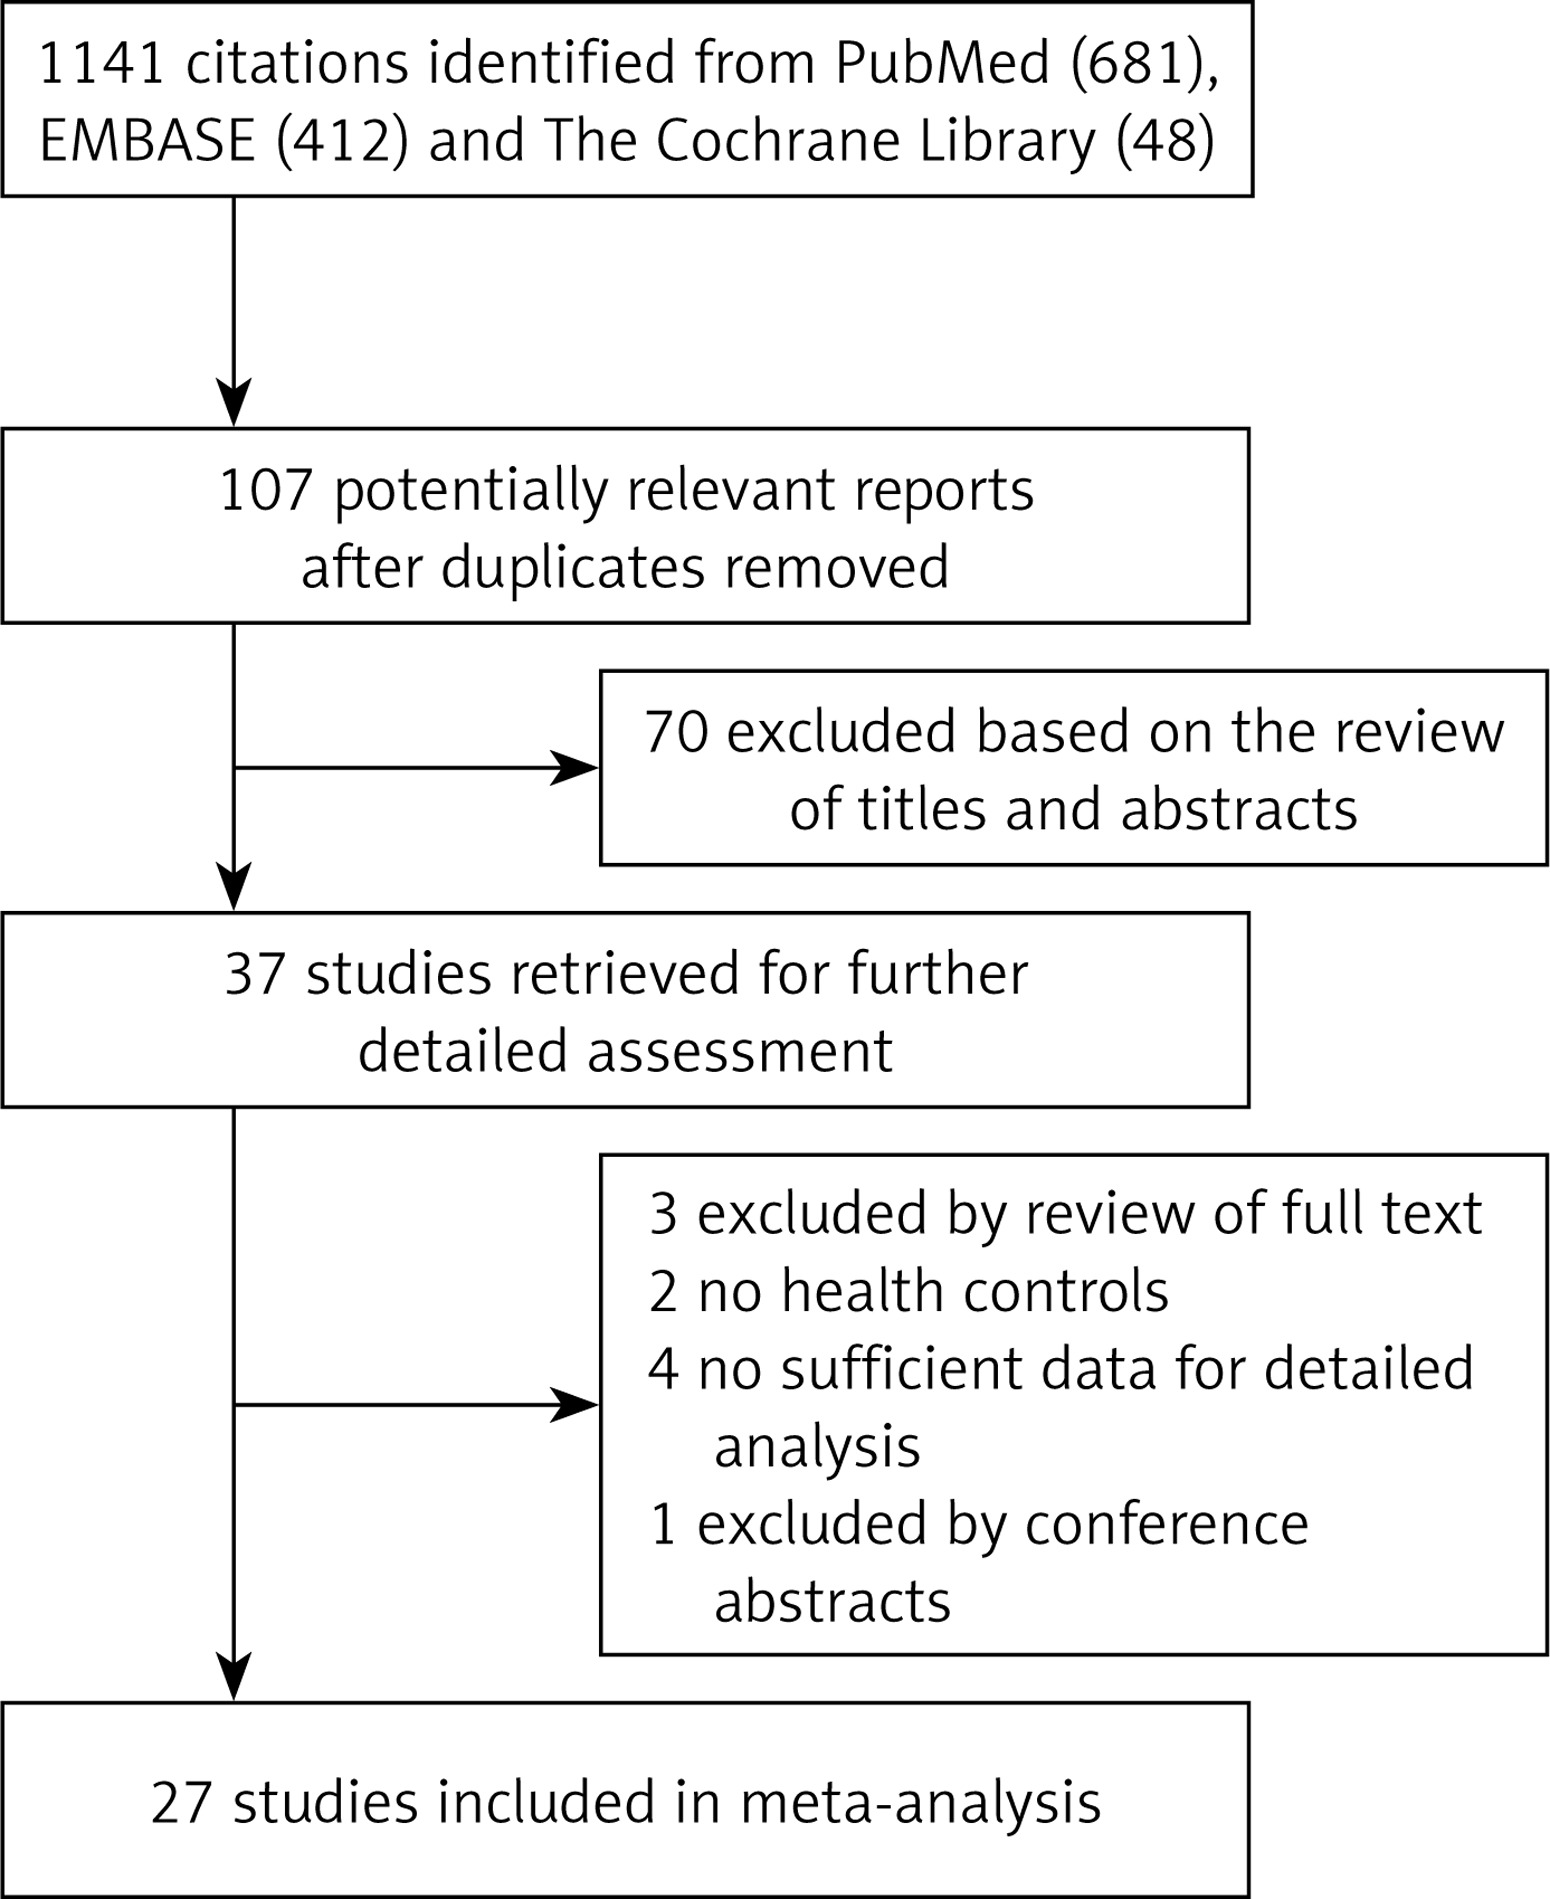
Studies were excluded if they reported ambiguous eligibility criteria, patients with other carcinomas, as well as patients who were pregnant, nursing, or taking any drug known to elevate or inhibit circulating leptin levels. The study selection process is presented in Figure 1.
Data extraction
We used standardized forms to extract data from each selected study, including the following variables: primary author name, year of publication, country, study sample size, mean and standardized difference (SD) of leptin levels and the genotype and allele frequencies of the leptin G-2548A gene polymorphisms. If original data of articles were not available, we contacted the corresponding authors for additional information.
Quality evaluation of the literature
The quality of each included study was evaluated by two independent investigators (Ji-Qing Hao, Qian-Kun Zhang) using a modified Newcastle-Ottawa Scale (NOS). In case of disagreement during the process of quality evaluation, a third investigator (Yi-Xin Zhou) was consulted.
Statistical analysis
Related data were synthesized with the standardized mean difference (SMD) and its 95% confidence interval (CI) to calculate the pooled estimation of leptin levels between BC patients and control subjects. Odds ratios (ORs) and their 95% CI were calculated for the evaluation of leptin G-2548A gene polymorphisms between two groups by using: 1) allelic contrast, 2) recessive models, 3) dominant models, and 4) homozygote contrast of the G-2548A gene polymorphisms [15]. Cochran Q statistics was conducted to evaluate the heterogeneity between studies, then quantified with I2 (I2 = ((Q – df)/Q) ×100%) [20], which were used to estimate the effect of heterogeneity among studies [21]. The I2 takes values from 0 and 100% (I2 = 0–50%, no or moderate heterogeneity; I2 > 50%, significant heterogeneity). Given the considerable heterogeneity, we completed the analyses with a random-effect model. Otherwise, a fixed-effect model was applied for further analyses. Publication bias was evaluated by a funnel plot and Egger’s linear regression test. Forest plots were used to depict the results graphically, and Egger’s linear regression test was used to statistically detect publication bias [22]. If bias was found, additional tests were applied. To explore the between-study heterogeneity, subgroup analysis was conducted according to the stratification of region, race, body mass index (BMI), waist circumference (WC) and measurement type. All statistical analysis was performed using Stata 12.0 software (Stata Corporation, College Station, Texas, USA).
Results
Basic characteristics of included studies
Our search yielded 1141 relevant articles by the initial search strategy, and 27 articles were ultimately included in this meta-analysis according to the rigid inclusion and exclusion criteria. The final 27 studies included 9516 subjects (4542 BC patients/4974 controls). The baseline characteristics of the 21 incorporated studies regarding circulating leptin concentration in this meta-analysis are displayed in Table I [11, 12, 14, 17, 23–39], and the basic characteristics of the 7 included studies for G-2548A gene polymorphism are shown in Table II [15–19, 40, 41]. All the included studies had a case-control design and a clear diagnostic method for BC. The measurement types for leptin concentrations were as follows: 14 studies measured by enzyme-linked immunosorbent assay (ELISA); 7 studies measured by radioimmunoassay (RIA). The mean frequency of the A allele was 46.6% among all controls, and 49.3% in all the patients with BC. The age and sex distribution between BC patients and control groups were comparable in each included study. Study quality assessments for all included studies were appraised using the NOS, and the NOS scores are displayed in Tables I and II, of which most of the studies had high quality scores of 5 to 8 stars.
Table 1
Basic characteristics of abstracted studies for circulating leptin concentration
Table II
Basic characteristics of the individual studies of G-2548A gene polymorphism included in meta-analysis
Meta-analysis results
Meta-analysis of circulating leptin level in BC patients compared to controls
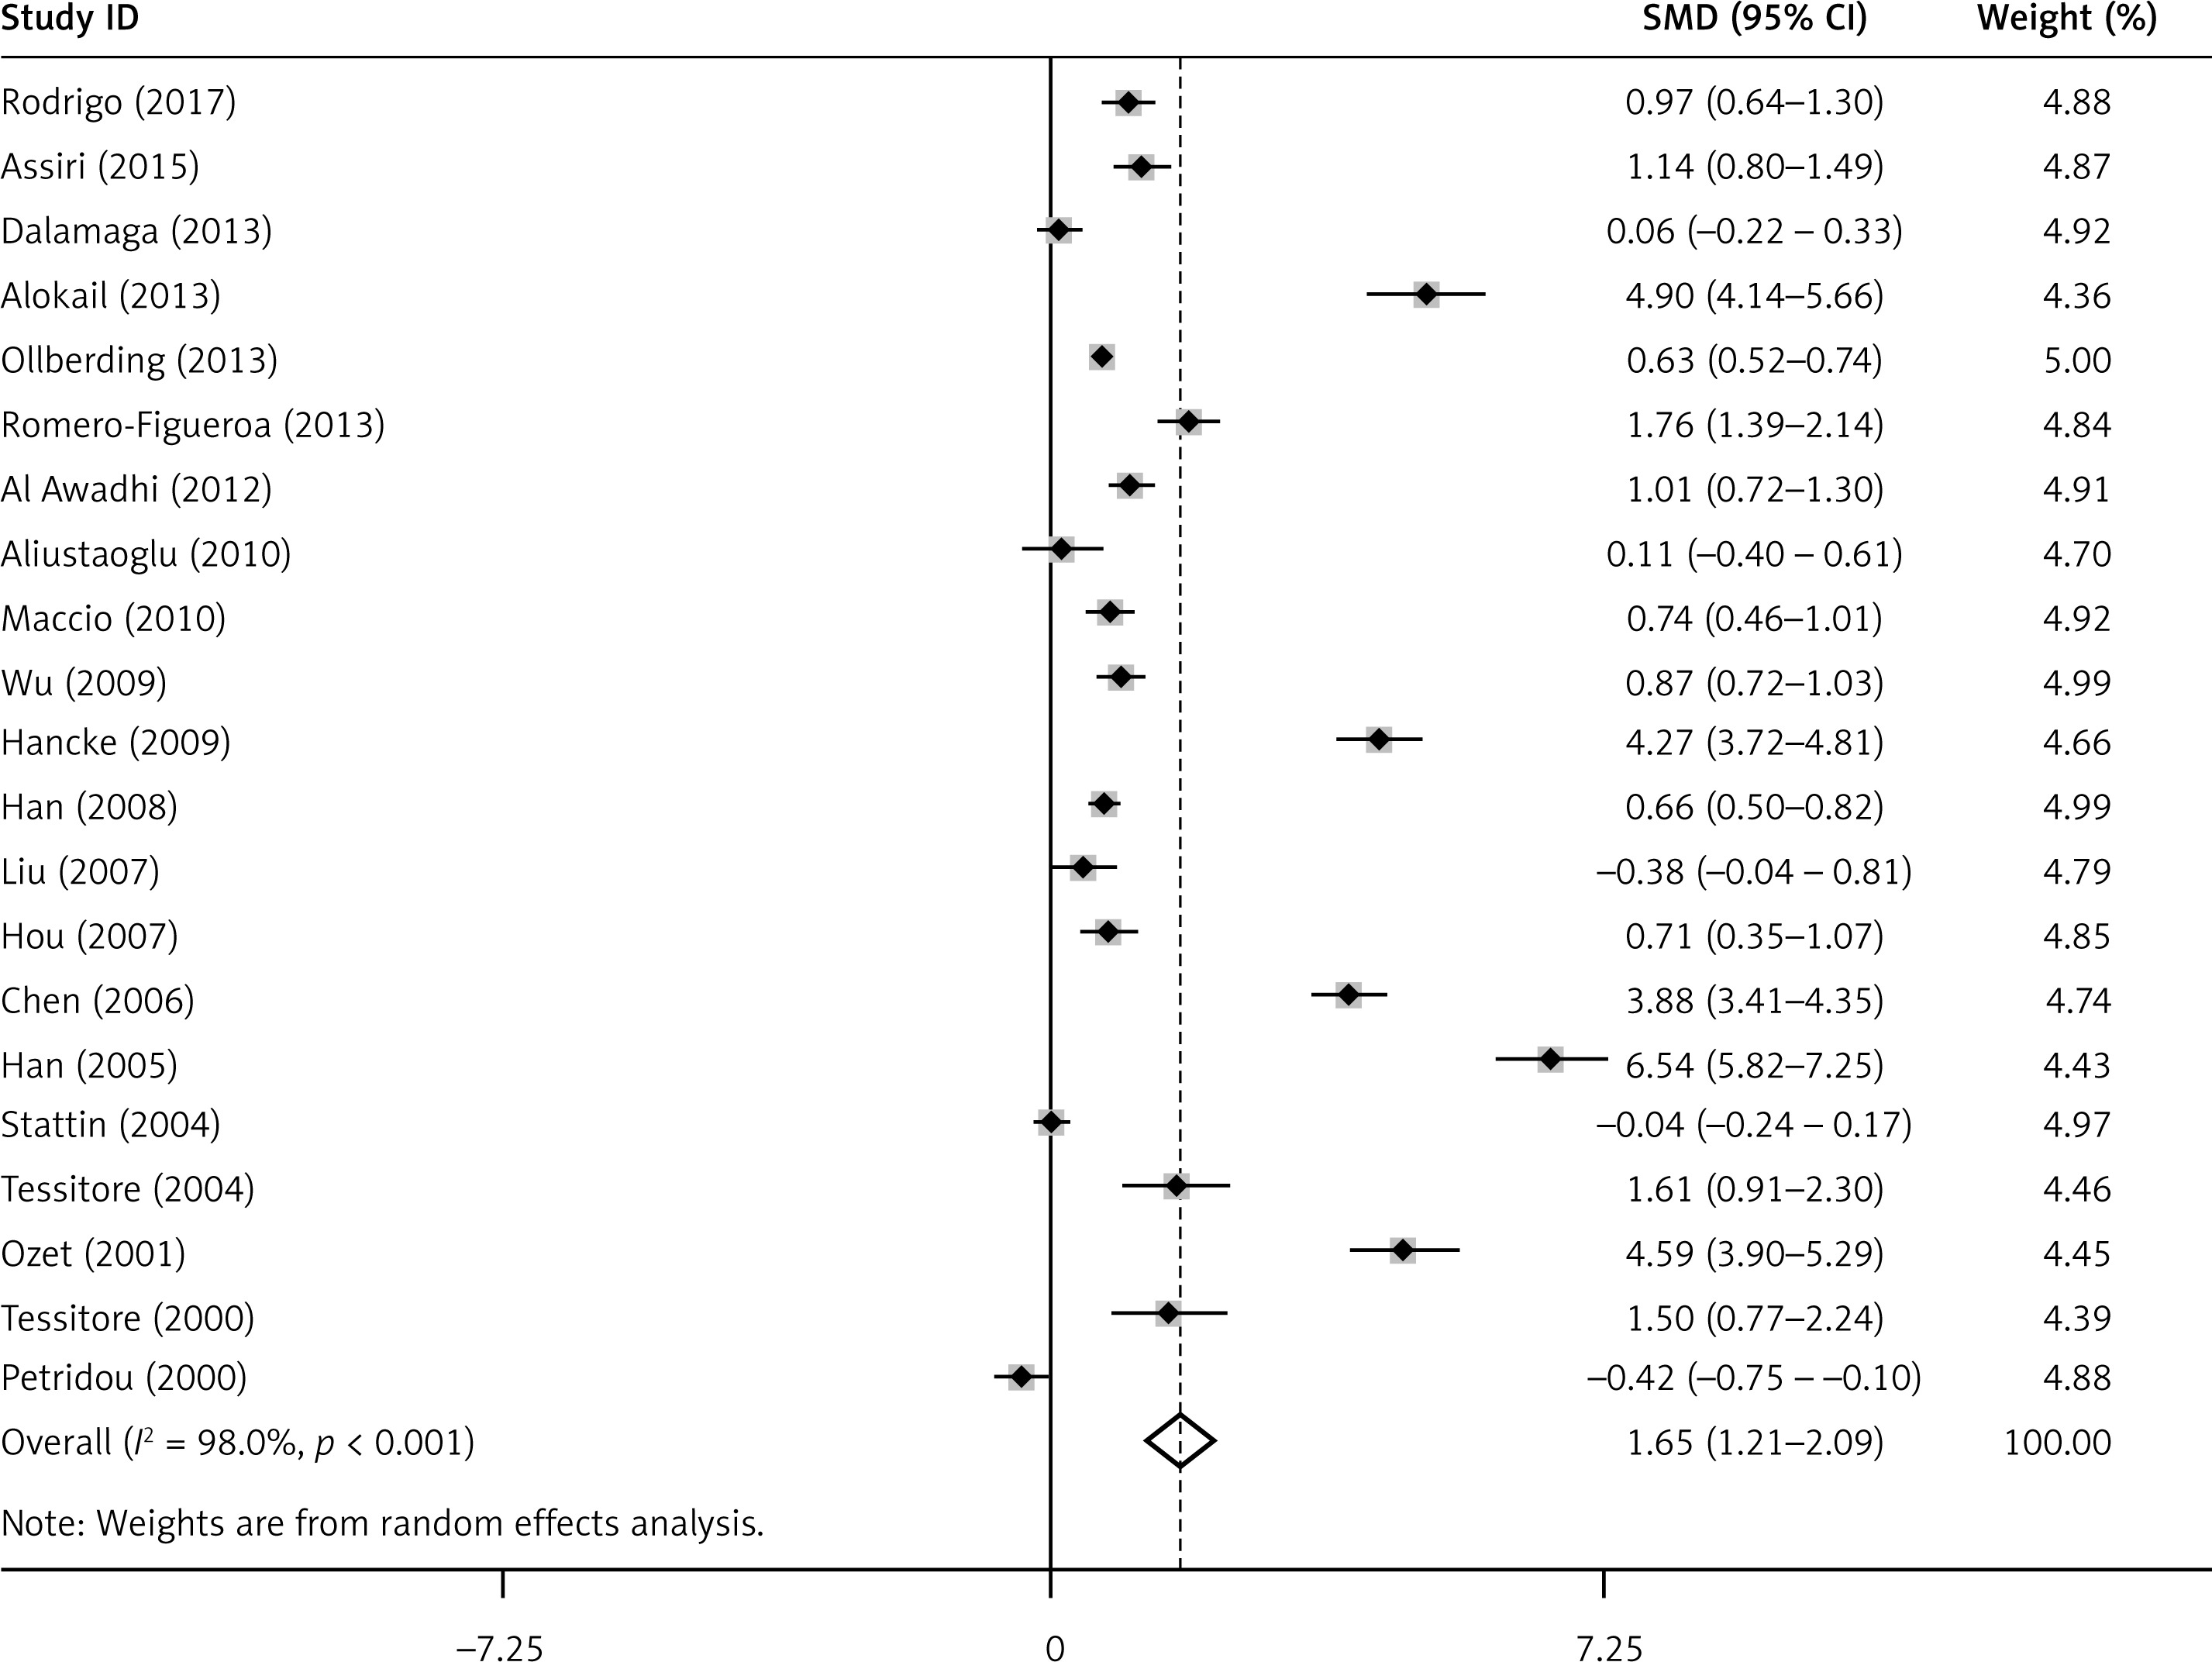
The pooled results of circulating leptin concentration indicated that there was a significantly elevated leptin level in BC patients compared to healthy controls (SMD = 1.65, 95% CI: 1.21–2.09, p < 0.001) (Figure 2). Subgroup analyses suggested that region, race, BMI, WC and measurement type were associated with leptin in BC patients (Table III).
Table III
Subgroup analysis of leptin level in BC
Meta-analysis of leptin G-2548A gene polymorphisms and susceptibility to BC
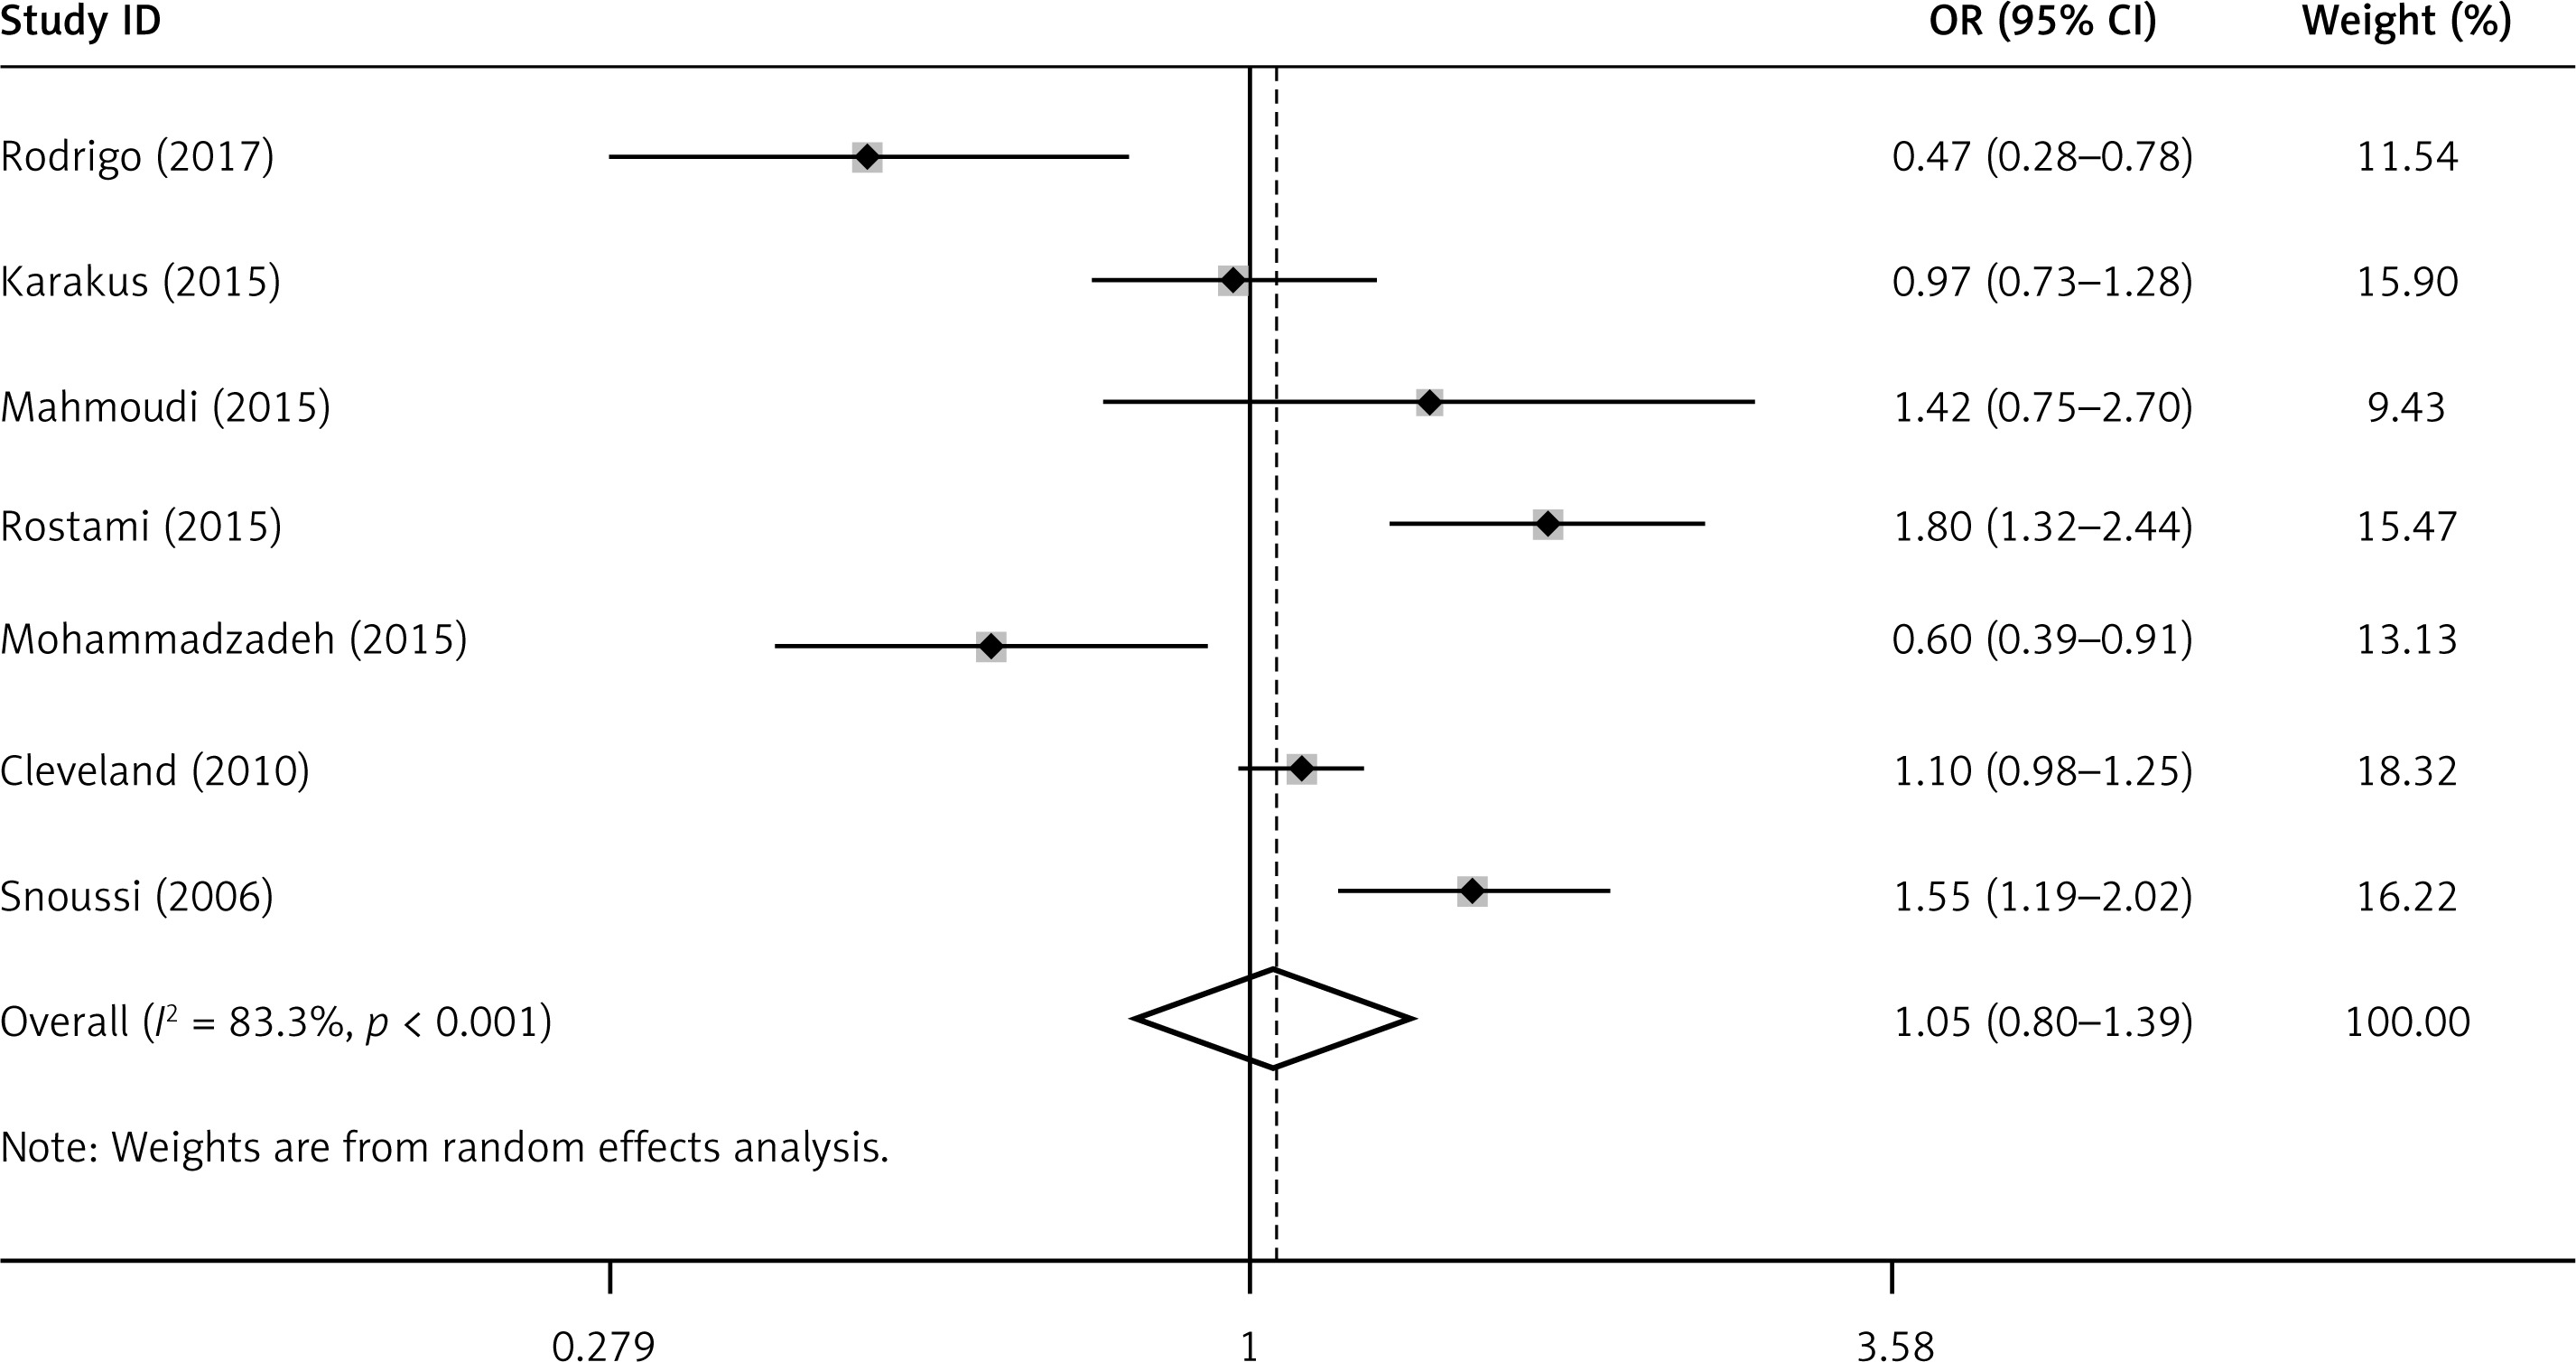
No significant association between the leptin G-2548A gene polymorphism and BC was found by using the allele contrast, recessive, dominant or homozygote models in all study subjects (OR for A allele = 1.05, 95% CI: 0.80–1.39, p = 0.722) (Figure 3, Table IV). However, when compared to the other groups, we found that there was a higher prevalence for A allele frequency (81.3%) in controls from Asia, as well as a higher A allele frequency (69.3%) in Asian BC patients (Table V).
Table IV
Meta-analysis of the association between leptin G-2548A gene polymorphisms and BC
Heterogeneity
In the current study, the pooled analysis regarding circulating leptin levels showed marked heterogeneity (I2 = 98.00%, p < 0.001) (Figure 2). Between-study heterogeneity was found when analyzing leptin G-2548A gene polymorphisms in BC (I2 = 83.30%, p < 0.001) (Figure 3). Thus, a random effect model was conducted to pool the effect size both on circulating leptin concentration and leptin G-2548A gene polymorphisms in this meta-analysis.
Publication bias
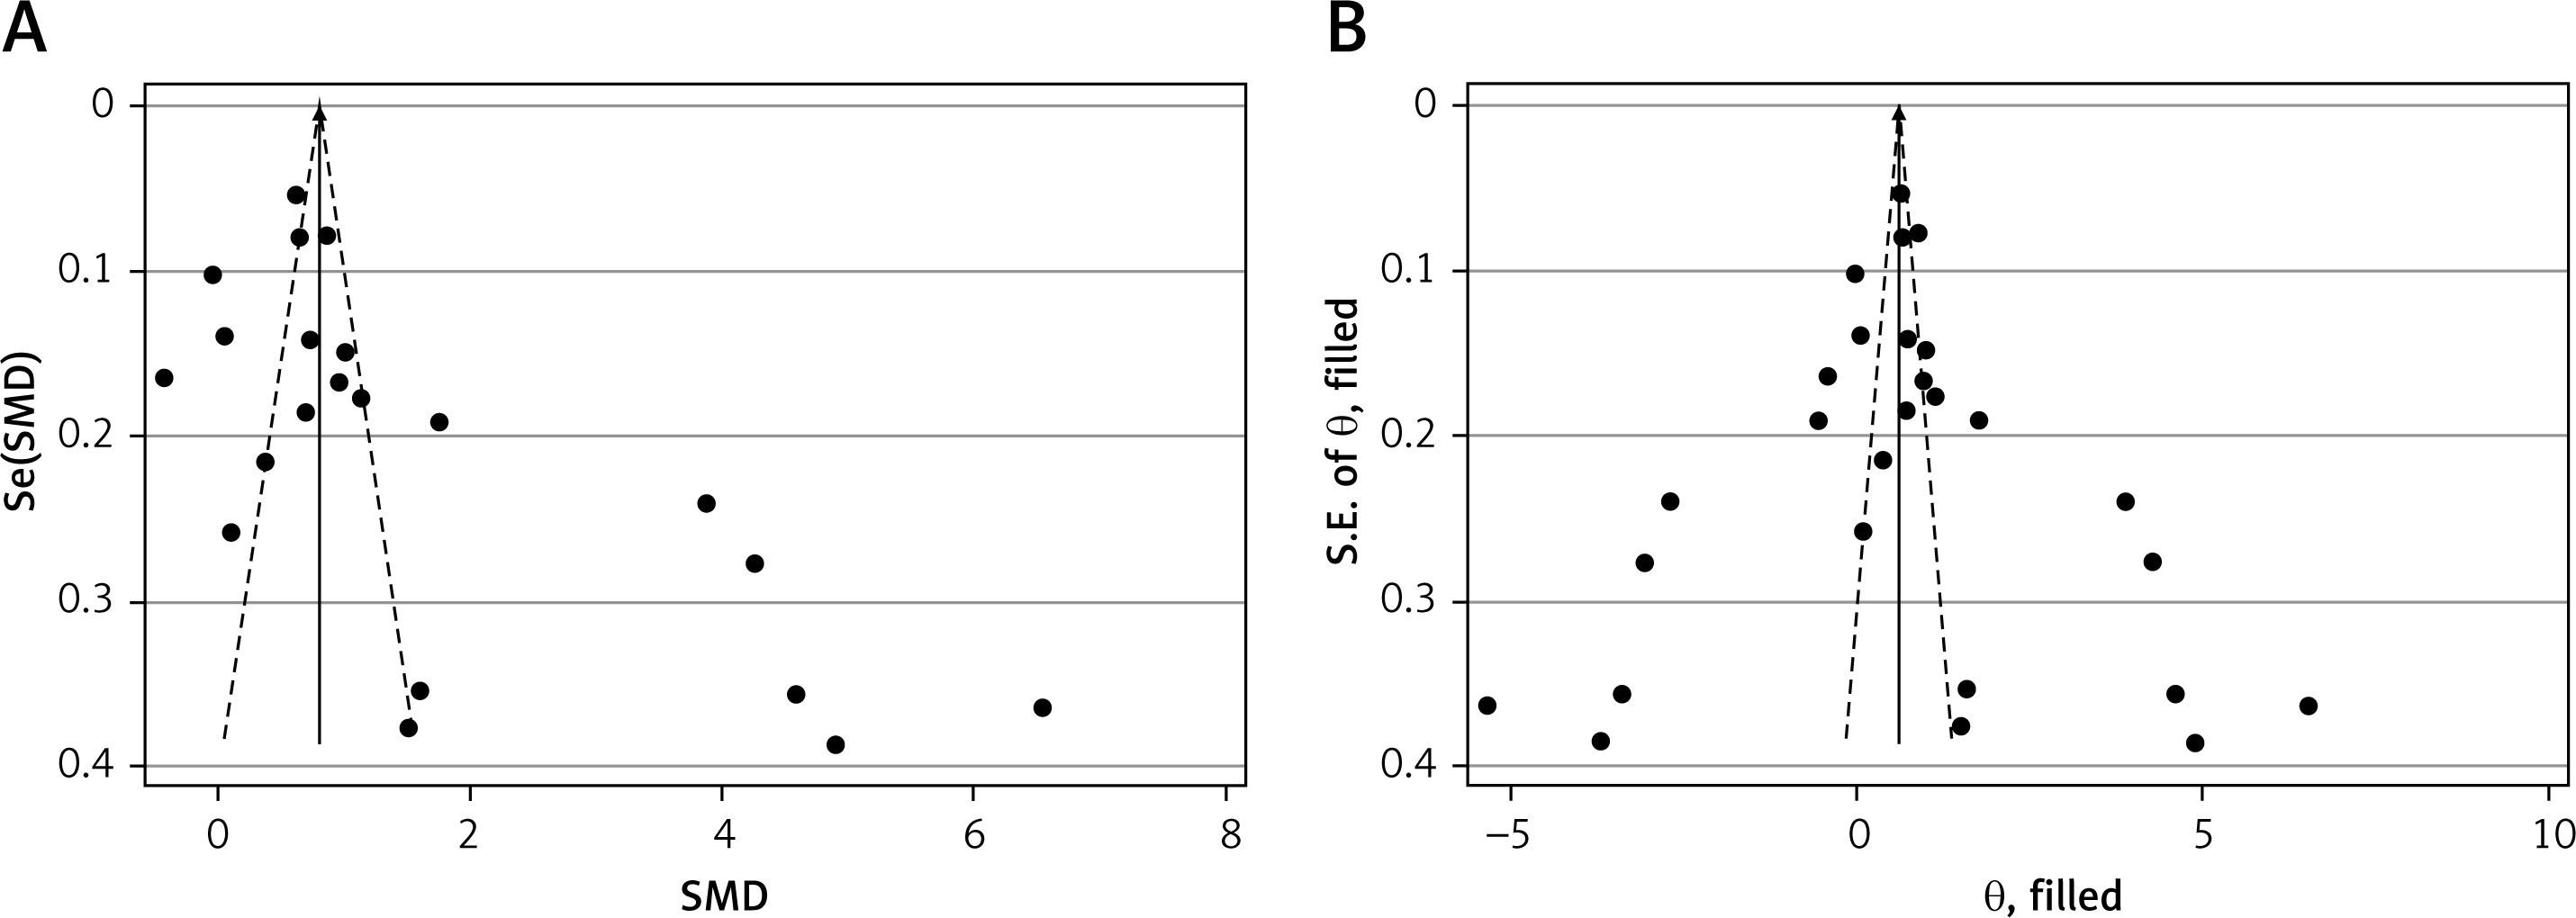
The funnel plot for circulating leptin level showed a slightly asymmetrical distribution, and Egger’s linear regression test revealed the existence of a significant publication bias (p = 0.006) (Figure 4 A). Then, Duval’s trim and fill method was applied to evaluate the asymmetry of the funnel plot and the potential publication bias risk. After 6 imputed filled values were filled, the results suggested no publication bias in our analysis (p = 0.985) (Figure 4 B).
Figure 4
Funnel plot (with pseudo 95% confidence intervals) with the standard error of the leptin difference plotted against the mean difference of leptin of each study (A); Filled funnel plot (with pseudo 95% confidence intervals) with the standard error of the leptin difference plotted against the mean difference of leptin of each study (B)
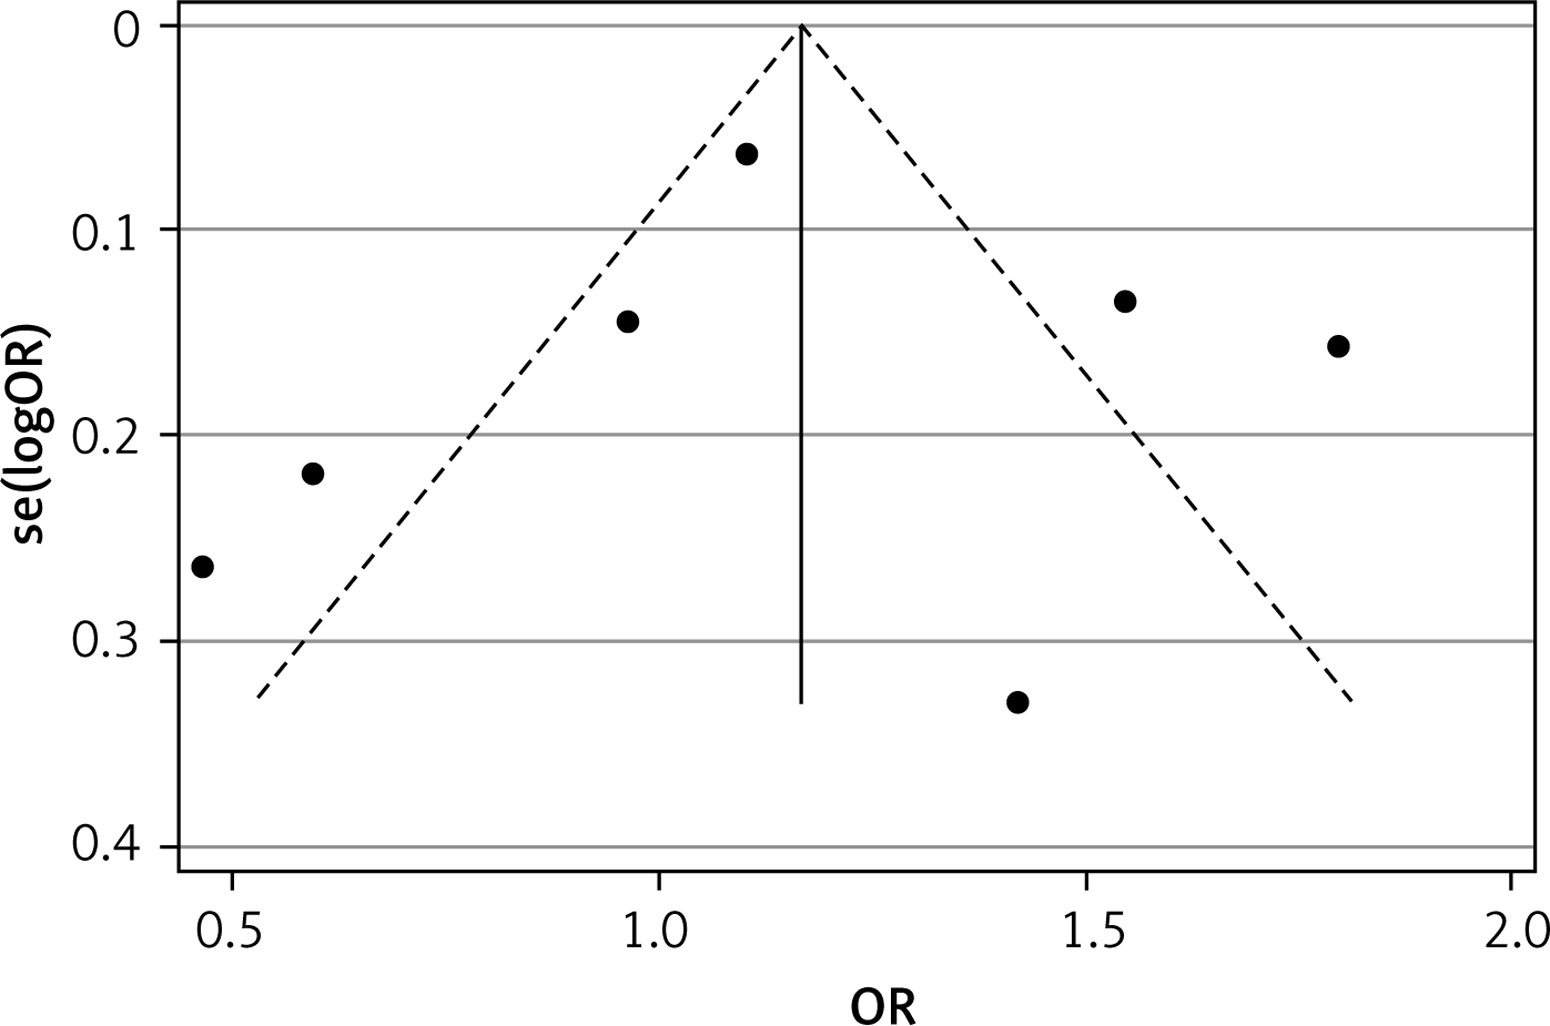
Publication bias for leptin G-2548A gene polymorphisms was not detected among the pooled studies (p = 0.968) (Figure 5).
Discussion
Leptin, as a peptide hormone, is mainly synthesized and secreted by adipose tissue. Although leptin has been recognized as a hormonal signal for regulating energy homoeostasis, available evidence demonstrates its multiple physiological functions, such as a metabolic regulator and pro-angiogenic factor [42, 43]. Recently, it has been shown that leptin and its receptor are involved in the processes leading to the initiation and progression of BC. Results from some epidemiologic studies of BC have provided evidence for an association with circulating leptin levels [14, 39]; in addition, several gene polymorphisms have been identified in the human leptin and leptin receptor, such as leptin G-2548A (rs7799039), leptin receptor Q223R/Gln223Arg A>G (rs1137101) and K109R/Lys109Arg A>G (rs1137100), which were reported to increase risk of BC in some but not in other studies [15, 18, 34, 41, 44].
In the current meta-analysis, we systemically reviewed the data from 27 comparisons of BC patients versus normal controls. The results of circulating leptin levels revealed that BC patients have a statistically significantly higher leptin level than in normal controls; however, there was no association between the leptin G-2548A gene polymorphism and BC. The heterogeneity test showed significant heterogeneity among included studies. Heterogeneity refers to the degree of difference in results among included studies. Strong heterogeneity could lead to an impaired result of meta-analysis and decrease the validity when assessing the pooled estimation. To find possible sources of between-study heterogeneity and other positive factors, subgroup analysis was conducted. Based on the stratification of region, race, BMI, WC and measurement type, no significant change in leptin level was observed in BC patients, and all subgroups showed higher leptin levels in BC patients compared to healthy controls. Among them, the Arabian group had a higher leptin level than other regional groups, Caucasians had a lower leptin level than non-Caucasians, and the BMI > 30 kg/m2 group had a higher leptin level than the other two groups, which is consistent with previous reports indicating that BMI was inversely correlated with premenopausal cancer risk, including BC [45]. The WC ≥ 80 cm group had a higher leptin level than the WC < 80 cm group. WC is an indicator of central obesity. It has been demonstrated that an increased WC level is closely corrected with BC risk in both premenopausal and postmenopausal populations [46]. Obesity, as reflected by increased BMI, has a strong positive association with postmenopausal BC and an inverse correlation with premenopausal cancer risk, especially associated with increased risk of more aggressive BC. Obese women are likely to have metastatic BC when they are first diagnosed and to have a poor prognosis regardless of their menopausal status. Central obesity, mainly measured by the WC or waist-hip ratio (WHR), can increase BC risk in both premenopausal and postmenopausal populations. Furthermore, BC patients with over-expression of leptin show a lower survival rate. Thus, for BC patients, maintaining a healthy weight may be beneficial for a good disease prognosis.
The different results of subgroup analyses may be influenced by geographic location, ethnic variations and medical/health conditions. However, we cannot exclude the possibility that the different clinical characteristics, disease durations and age may contribute to a positive result.
Although our meta-analysis included relatively high-quality studies, there were still several limitations. First, comparison among all the included studies showed significant heterogeneity and there may have been publication bias. Second, only data from three databases were collected and the number and sample of included studies were relatively small and insufficient, especially for gene polymorphism, which may also affect the reliability of the analysis results. Third, the data on circulating leptin levels in several studies were approximate numbers, and might be biased compared with the actual number. Fourth, this review only included studies published in English, which would inevitably cause language bias.
Regardless of these four limitations, it is worth emphasizing some strengths of this study. Compared to individual studies, our study could provide a pooled result of leptin level and give an accurate evaluation of the relationship between leptin levels and BC, as well as the association between the leptin G-2548A gene polymorphism and BC.
In conclusion, our findings suggest that circulating leptin level is elevated in BC patients, thereby suggesting that an elevated leptin level may be a factor for BC. However, we did not observe any association between leptin G-2548A gene polymorphism and BC susceptibility. Further studies are necessary to determine the role of leptin levels and its gene polymorphisms in the pathogenesis of BC.