Introduction
Type 2 diabetes mellitus (T2DM) is one of the most common chronic metabolic diseases, featuring hyperglycemia resulting from resistance to insulin action and an inadequate compensatory insulin secretory response. The lasting chronic hyperglycemia of diabetes is associated with long-term damage, dysfunction and complications, such as diabetic nephropathy, cardiovascular disease (CVD) and retinopathy. These complications threaten the life span and the quality of life in T2DM [1–5].
Cystatin C (Cys C), with molecular weight of 13,343 Da, is a potent competitive extracellular inhibitor of cysteine proteinases that can be steadily produced and constitutively secreted by all nucleated cells and mainly controls extracellular protease activity [6–8]. It has been shown that Cys C is able to modulate lysosomal protein turnover after cellular internalization via endocytosis, thereby indicating the role of Cys C in modulating target tissue homeostasis after cellular reuptake in vivo. Moreover, Cys C also contributes to endothelial cell (EC) tubule formation and shows angiogenic characteristics in vitro [9, 10].
Cystatin C is mainly removed from the blood stream by renal glomerular filtration, and is almost completely reabsorbed in the distal tubule without tubular secretion [11]. Unlike serum creatinine, Cys C is not susceptible to external factors such as age, diet, or body mass. Cys C has been shown to be superior to serum creatinine as a marker in assessment of renal function and improves estimates of glomerular filtration rate (GFR) compared to creatinine-based methods alone [12–15]. In addition, studies have suggested that Cys C could be an independent factor in the prediction of all-cause mortality, CVD and incident congestive heart failure in subjects with coronary heart disease (CHD) [16–20].
A number of studies have investigated the expression of Cys C in T2DM patients. Some reported an increased Cys C level in T2DM when compared to healthy controls; however, others reported a heterogeneous result. It seems that those results did not reach a consensus yet. Hence, we conducted a comprehensive review and meta-analysis. The aim of this meta-analysis was to give a precise estimation of circulating Cys C level in T2DM patients compared to healthy controls, and to investigate the possible factors.
Material and methods
Search strategy
This study was conducted and reported according to a study protocol based on the Preferred Reporting Items for Systematic Reviews and Meta-Analyses (PRISMA) guidelines [21].
A systematic literature search was performed on the major online databases including PubMed, EMBASE and the Cochrane Library to identify related studies published between database inception and October 31, 2018. The literature search items were applied using the following search terms with multiple combinations: (“type 2 diabetes mellitus” OR “T2DM” OR “diabetes type 2” OR “type 2 dm” OR “non-insulin-dependent diabetes mellitus” OR “diabetes mellitus” OR “DM” AND “cystatin C” OR “Cys C” OR “cystatin”). The blood source for detection of Cys C was defined according to use of serum or plasma. To avoid the underlying loss of related literature, we manually reviewed all the references from the retrieved literature, to acquire other potential relevant articles. No method restrictions were applied; articles from all countries were accessible.
Inclusion criteria and exclusion criteria
Studies were retained in this meta-analysis if they met the following inclusion criteria: (1) they were case-control, cohort or cross-sectional studies with data on both patients diagnosed with T2DM and healthy controls; (2) they reported the detailed data (including mean and standardized difference (SD)) about Cys C levels in both T2DM and control groups; (3) English publications. If a study was found in more than one publication, all publications were considered for data abstraction, but only one was included in the final analysis.
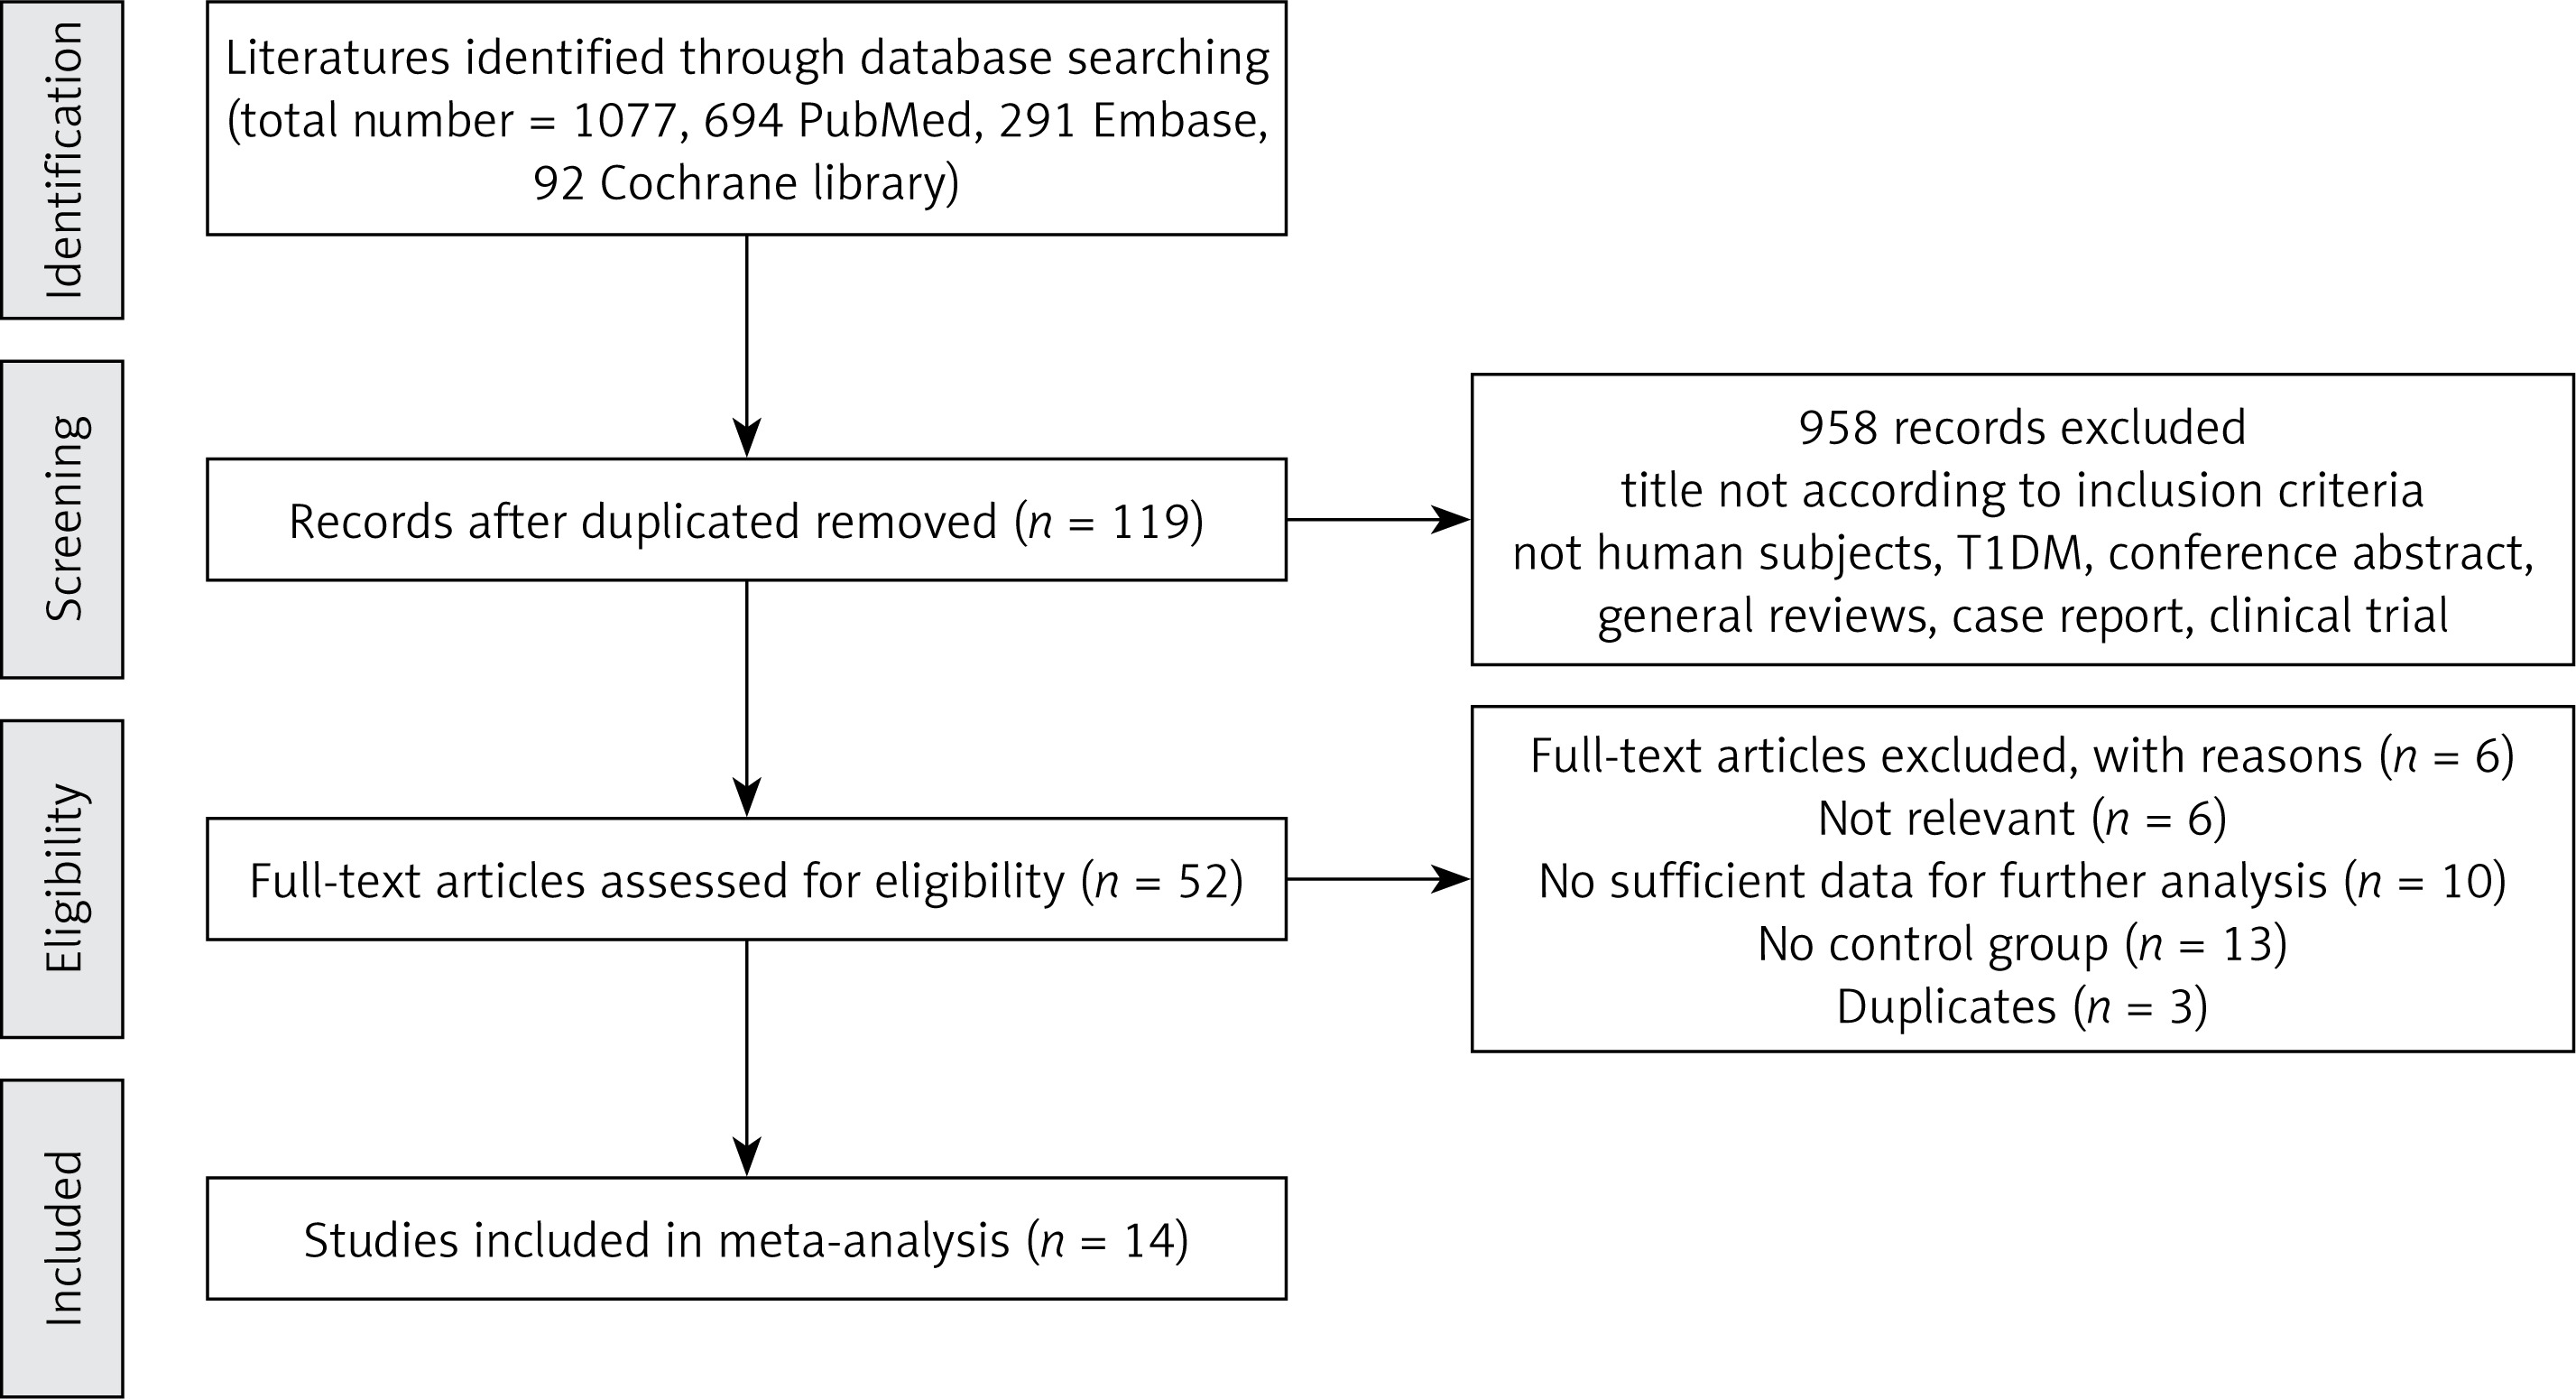
Studies regarding T1DM and an unclear diagnostic standard of T2DM were excluded. Furthermore, studies were excluded if they were (1) review articles, case reports and discussion papers; (2) contained overlapping or insufficient data. The study selection process is presented in Figure 1.
Data extraction
We used pre-designed standardized forms to extract data from each selected study, including the following variables: primary author, year of publication, country, sample size, mean and SD of Cys C levels, mean age, major clinical and demographic variables. If original data of articles were not available, we contacted the corresponding authors for additional information.
Quality evaluation of the literature
Cheng-Cheng Ma and Chun-Cui Duan independently assessed the methodological quality of each study with the validated Newcastle-Ottawa Quality Assessment Scale (NOS) [22]. In case of disagreement during the process of quality evaluation, the third investigator (Hai-Qin Tang) independently reconciled the discrepancies.
Statistical analysis
Statistical differences of Cys C between T2DM patients and control subjects was calculated by using the standardized mean difference (SMD), and its 95% confidence intervals (95% CI) were illustrated by a forest plot [23]. If there was no significant heterogeneity (p > 0.05) among these studies, the fixed-effect model was used. Otherwise, a random-effect model was used for further analyses [24, 25].
Cochran’s Q statistic was conducted to evaluate the between-study heterogeneity, then quantified with I2, which was used to estimate the effect of heterogeneity among studies [26]. We estimated the effect of heterogeneity of each study by the method, I2 = [(Q – df)/ Q] × 100% [27]. Egger’s linear regression test was implemented to statistically test publication bias, and a forest plot was used to graphically depict the results of publication bias [28]. To explore the source of between-study heterogeneity, subgroup analysis was performed according to the stratification of human race, age, gender, study sample size and disease duration. The detailed stratification criteria for each of the included studies in subgroup analysis were shown as follows: (1) Human race was stratified according to whether study subjects were Caucasian or non-Caucasian; (2) based on the age distribution of T2DM patients of all the included studies (range from 46.0 to 61.0), the stratification for age was partitioned by age of 55 years, namely age ≤ 55 and age > 55 groups; (3) according to the female proportion distribution (range from 46.0% to 95.2%) among the included studies, we chose the female proportion 50% as a cut-off point; thus the gender stratification into female% ≥ 50 and female% < 50 groups; (4) to exclude an error due to samples size on the size of SMD of Cys C, we calculated that the minimum sample size is 45 (type one error (α) as 5%, power of the test as 90% with anticipated mean difference of Cys C between groups was 0.5 and anticipated standard difference (SD) 0.7). In accordance with the distribution of study sample size of each study, we chose the sample size of 50 as a cut-off point, and the stratification for study sample size was divided into sample size < 50 and sample size ≥ 50 groups; (5) the distribution of disease duration among included studies ranged from 4.2 to 9.7 years; we set the cut-off point of 7 years as the stratification value, and the subgroup of disease duration was defined as duration ≤ 7 years and duration > 7 years groups.
Furthermore, sensitivity analyses were conducted to determine the stability and reliability of the results using the leave-one-out method. All statistical analysis was performed using Stata 12.0 software (Stata Corporation, College Station, Texas, USA).
Results
Study characteristics
Our search yielded 1077 relevant articles by using electronic and manual search methods; 14 articles were finally included in this meta-analysis according to the rigid inclusion and exclusion criteria. The final 14 studies included a total of 1195 subjects (723 patients with T2DM and 473 healthy controls) after examining title, type, abstracts and full text up to October 31 2018. The study population came from 5 continents and covered 10 different countries. Demographic and clinical data of the 14 incorporated studies are summarized in Table I [29–42]. All the included studies have a case-control design and have a clear method of diagnosis for T2DM. The measurement types for Cys C concentration were as follows: eleven studies measured by immunoturbidimetric method, one study measured by spectrometric immunoassay and two studies did not mention measurement methods. The age and sex were matched between T2DM patients and healthy controls in each included study. NOS scores were determined to assess the quality of included studies (Table I). The studies included in this meta-analysis were generally of moderate to high quality.
Table I
Demographic and clinical data of T2DM patients and controls of included studies
Meta-analysis of Cys C levels in T2DM patients and healthy controls
Heterogeneity test results and overall effects
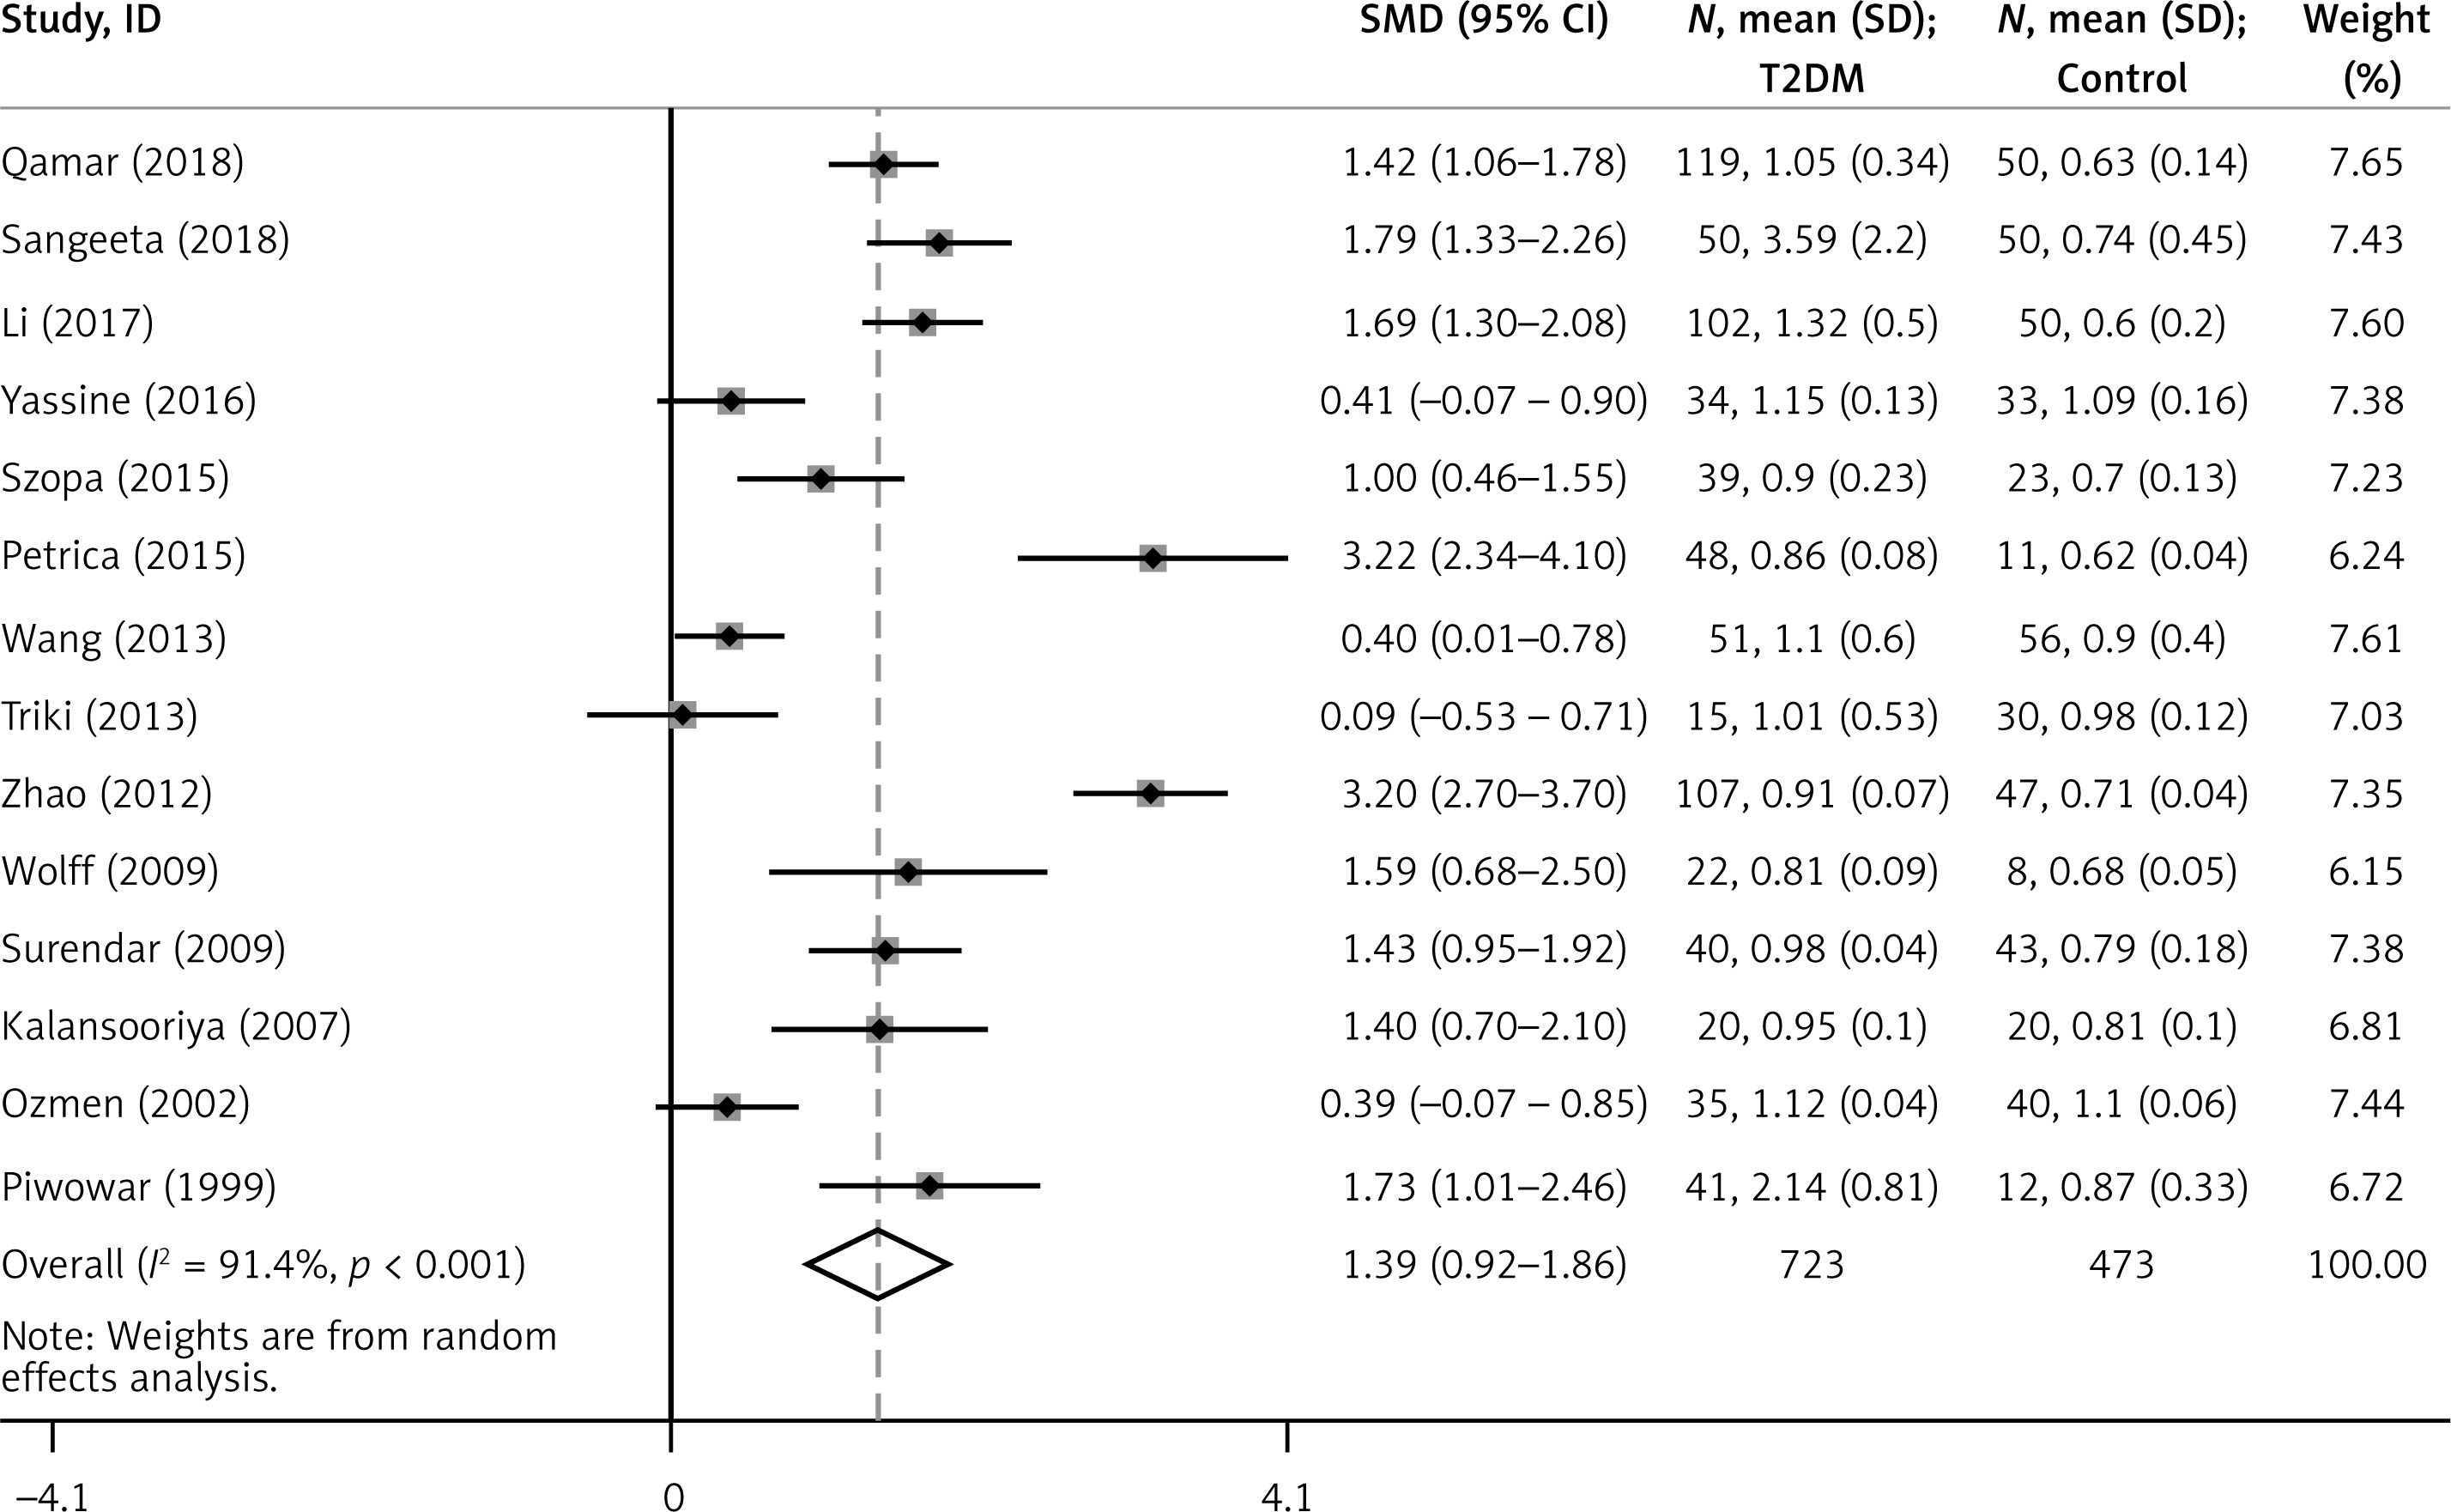
In this meta-analysis, the results showed that there was marked heterogeneity among the studies (I2 = 91.50%, p < 0.001) (Figure 2, Table I). The incorporated analysis showed that T2DM patients had significantly higher levels of Cys C compared to healthy controls (SMD = 1.39, 95% CI: 0.92–1.86, p < 0.001) (Figure 2, Table I).
Sensitivity analysis
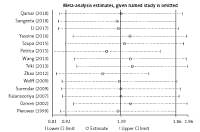
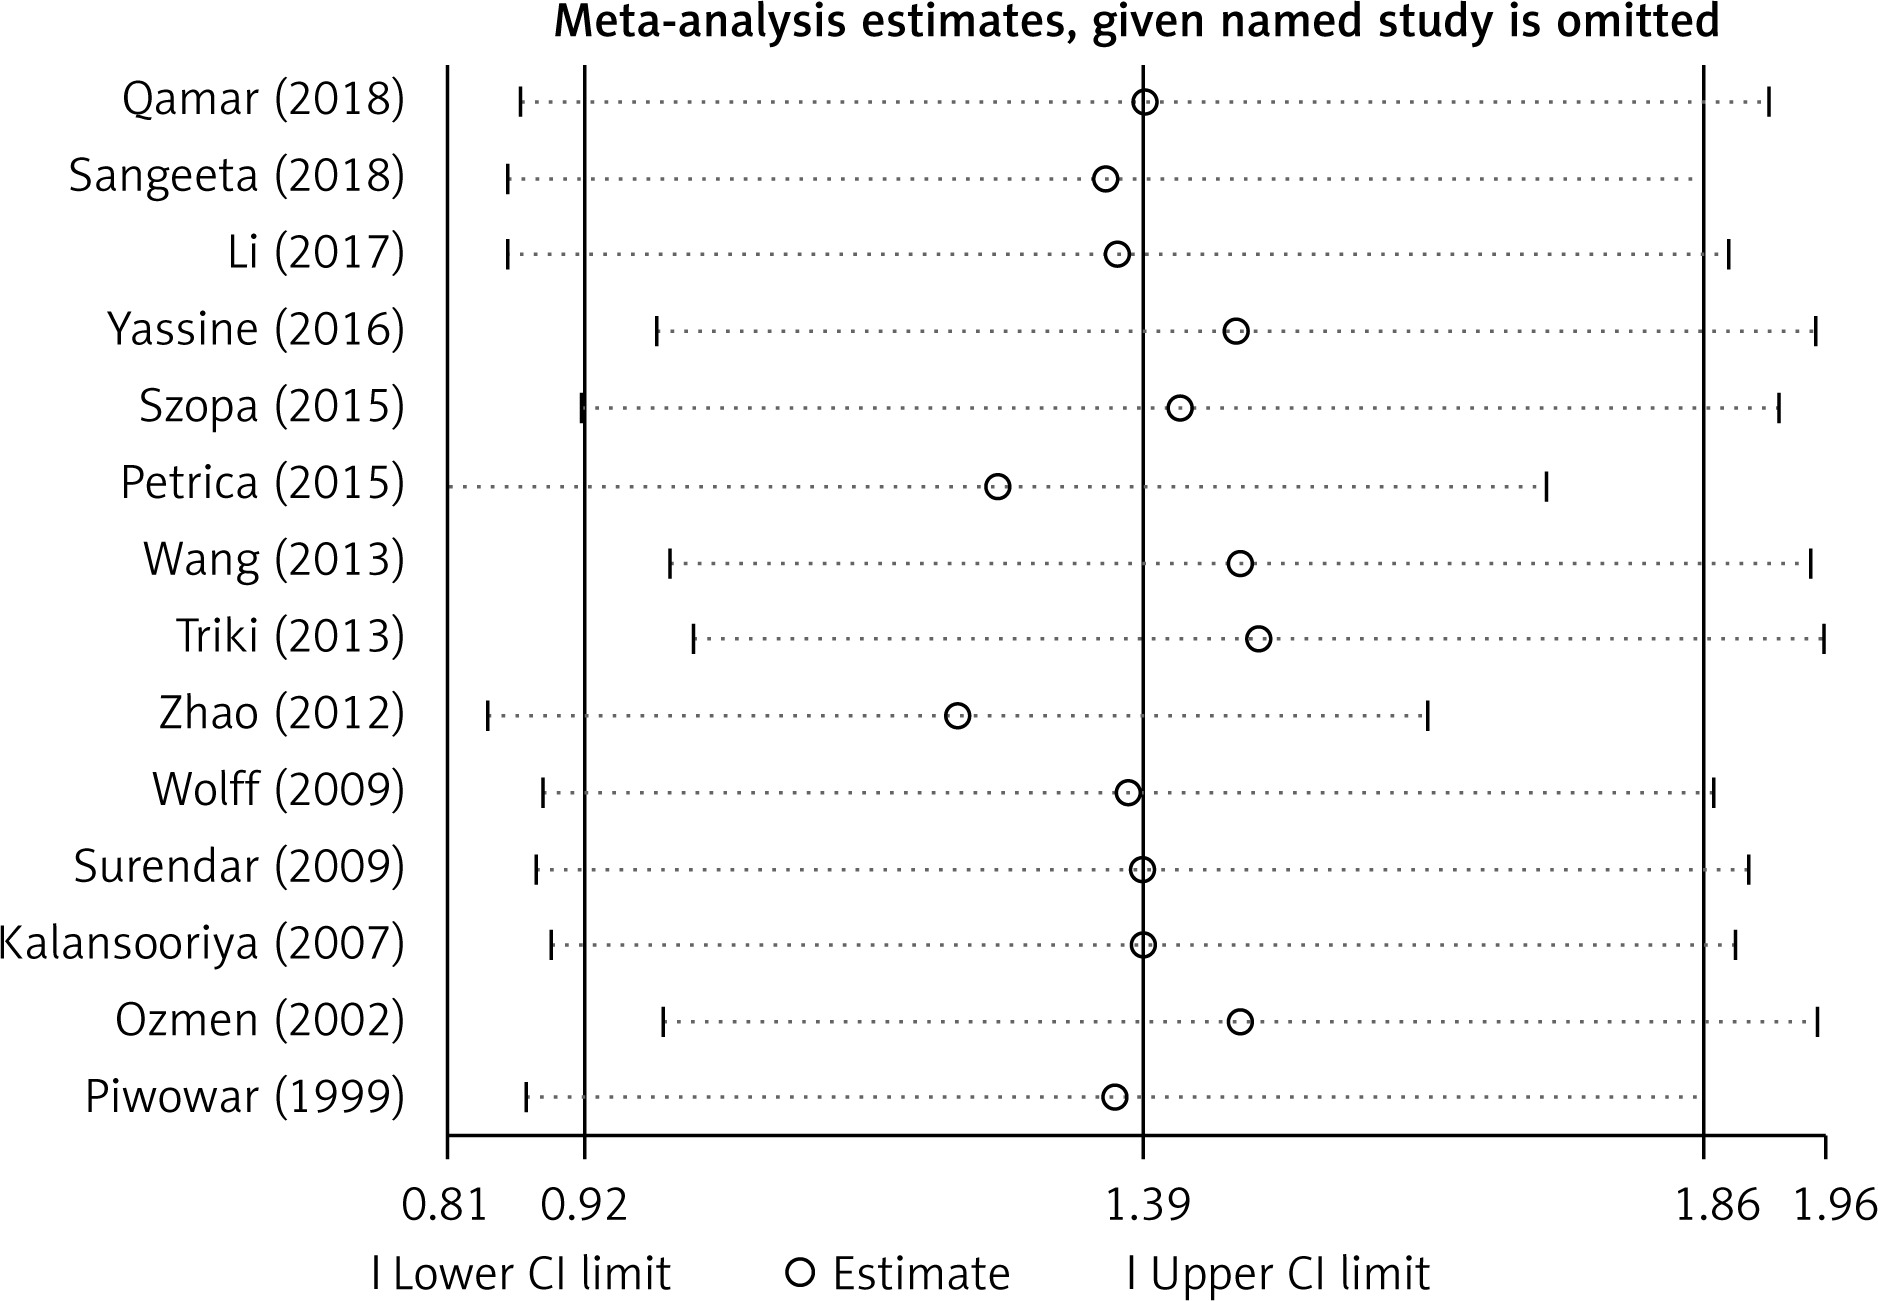
Considering the existence of strong heterogeneity in this meta-analysis, we performed a sensitivity analysis by using random effect methods, which compared the meta-analysis results of the studies as a whole to the same meta-analysis with one study excluded in each round to determine how robust the findings were. In our study, sensitivity analysis indicated that the results of this meta-analysis were reliable and stable when any one study was excluded (Figure 3).
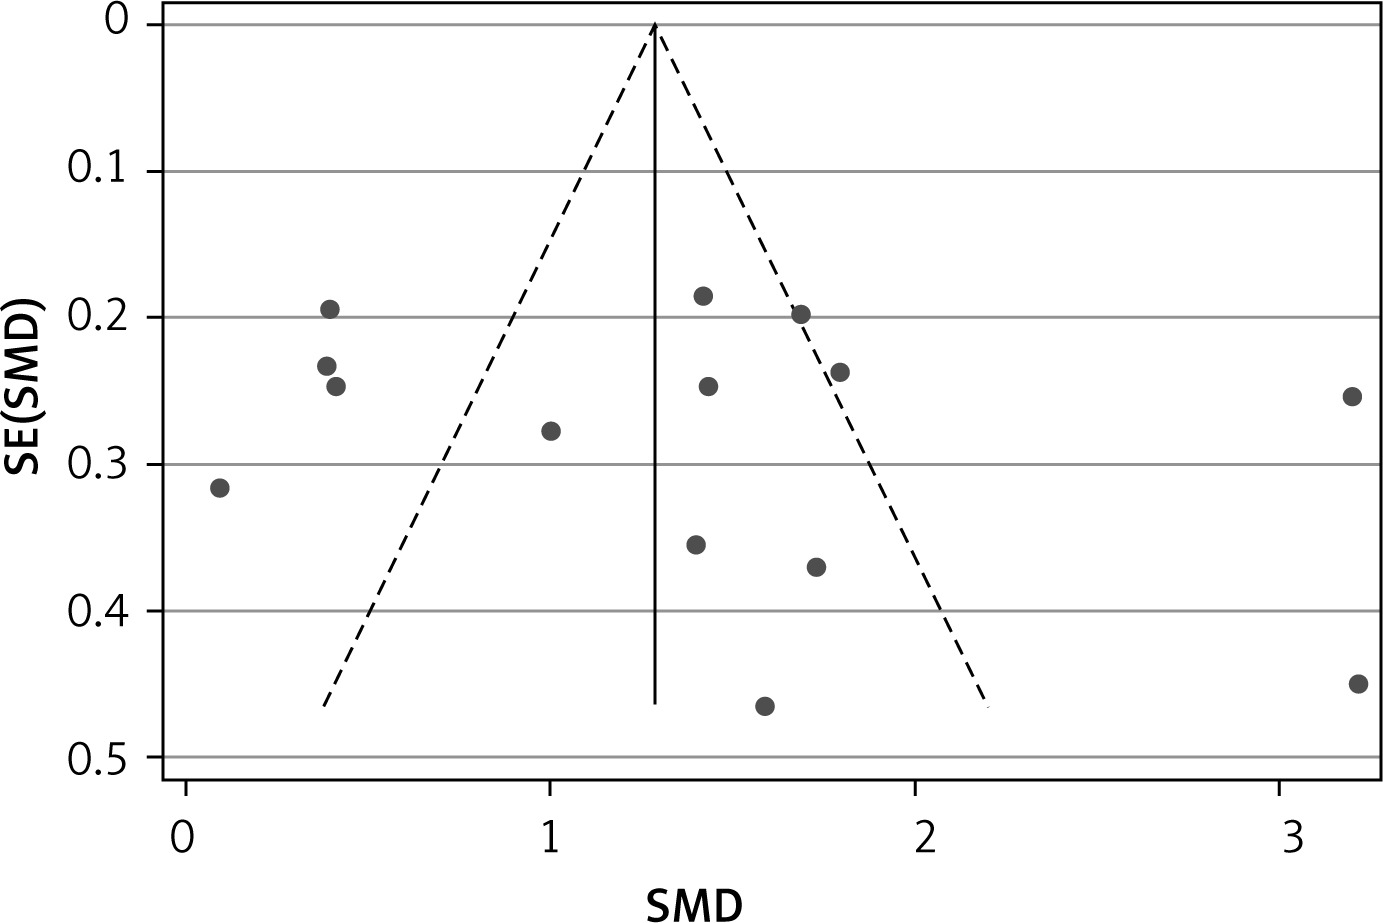
Publication bias
Publication bias was evaluated by Egger’s test and represented graphically by funnel plots of the standard difference in means vs. the standard error. Egger’s linear regression test did not reveal significant evidence of publication bias as a whole (t = 0.780, p = 0.452) (Figure 4).
Subgroup analysis
Subgroup analysis was performed to explore the potential source of between-study heterogeneity. The stratification of subgroups was based on the variables of human race, age, gender, study sample size and disease duration. The results revealed an increased Cys C level for non-Caucasian (SMD = 1.64, 95% CI: 1.01–2.27), age > 55 (SMD = 1.88, 95% CI: 0.82–2.93), female% ≥ 50 (SMD = 2.22, 95% CI: 1.18–3.25), sample size (n < 50) (SMD = 1.69, 95% CI: 0.87–2.51) and disease duration > 7 years (SMD = 1.96, 95% CI: 0.90–3.02) groups. It suggested that the concentration of Cys C was associated with human race, age, gender, study sample size and disease duration (Table II).
Table II
Subgroup analysis of Cys C level in T2DM
Discussion
Diabetes mellitus has posed a huge challenge to health care systems across the globe; the diabetic complications are a leading cause of mortality and morbidity and a serious threat to the life of diabetes patients. Cys C is an effective cysteine protease inhibitor that is produced by all nucleated cells at a fairly constant rate and freely filtered by glomeruli due to its low molecular weight. The cellular reuptake of secreted Cys C may take place particularly in the vascular endothelium and may lead to vascular endothelial specific accumulation of Cys C. Even small increases in Cys C plasma levels could have significant effects on the homeostasis of the vascular endothelium. Several previous studies have disclosed the association of Cys C with the risk of diabetic complications in T2DM, including diabetic nephropathy, CVD, and diabetic peripheral neuropathy [43–46].
Some of the most important findings about Cys C are in the area of renal disease. Vijay et al. demonstrated that there was an increased urine Cys C level in T2DM with early diabetic nephropathy as compared to patients without nephropathy, and the increase of Cys C level was positively correlated with microalbuminuria [47]. Zhang et al. reported that serum Cys C was more sensitive than serum creatinine for estimation of GFR in T2DM [48]. Cys C is a good marker of incipient renal disease and represents an ideal endogenous index reflecting the GFR [49]. Serum Cys C could be a more precise indicator than serum creatinine because it is less affected by other factors, thereby reflecting renal function much more precisely in early renal function lesions of T2DM.
Since Cys C is more reliable for assessment of renal function, it is also a potential indicator and has an associative relationship with the CV risk prediction of diabetes patients. A recent study that included 523 T2DM patients revealed that, compared to the T2DM with non-subclinical atherosclerosis group, there was an increased serum Cys C level in the subclinical atherosclerosis group, and the concentration of Cys C was correlated with brachial-ankle pulse wave velocity, suggesting a potential role of Cys C in predicting arterial stiffness [45]. Other studies have also found an association of serum Cys C with vascular complications, carotid arterial wall elasticity and subclinical atherosclerosis in T2DM [45, 50, 51]. A study by Vaduganathan et al. revealed that the renal biomarker of Cys C was independently associated with subsequent cardiovascular (CV) risk [52]. Moreover, there was a positive association of serum Cys C with CV autonomic neuropathy in patients with T2DM [44]. Those studies suggested the important role of Cys C involved in T2DM with CV complications.
The Japanese Fukuoka Diabetes Registry study suggested that Cys C based eGFR has a stronger association with all-cause mortality and is superior to creatinine based eGFR for predicting all-cause mortality in patients with T2DM [46]. They also found that a lower creatinine to Cys C ratio is a risk factor for bone fracture in T2DM [53].
In the present study, we reviewed data from 14 studies with Cys C levels reported, including subjects with T2DM patients (n = 723) and healthy controls (n = 473). Our findings revealed that the circulating Cys C levels are higher in T2DM patients than in the healthy controls, suggesting that increased Cys C levels may be a factor related to the presence of T2DM. Heterogeneity test results showed marked between-study heterogeneity. As is well known, positive studies showing favorable results are more likely than negative studies showing harmful or null results to be reported and published. Hence, strong heterogeneity may impair the validity of the overall results. Publication bias was not detected, and sensitivity analyses showed that the overall effect sizes were all stabilized in the circulating Cys C levels between cases and controls. To minimize the possible factors influencing the results, and to explore underlying sources of heterogeneity, we applied subgroup analyses. The results suggested that related factors (human race, age, gender, study sample size and disease duration) are relevant to the circulating Cys C levels and may be sources of heterogeneity.
Although our meta-analysis included relatively high-quality studies, there were still several limitations should be acknowledged. First, in the included studies, some of them did not have complete clinical characteristic variables reported, such as hemoglobin A1c% (HbA1c %), body mass index (BMI) and eGFR. Therefore, the association between serum/plasma Cys C levels and clinical characteristic variables cannot be fully understood and may lead to underpowered results. Second, the number of included studies and their study sample sizes are relatively small; a sample size that is too small increases the likelihood of a type II error skewing the results, which decreases the power of the study. Third, this review only included studies published in English, which might inevitably cause language bias. Furthermore, meta-analysis, as a kind of retrospective study (evidence-based medicine), could not prove causation, which is susceptible to the methodological deficiencies of the pooled studies.
Regardless of these limitations, it is worth emphasizing some strengths of this study. Compared to individual studies, our study could provide an overall result of Cys C level and give an accurate estimation on the relationship between Cys C level and T2DM. We carried out subgroup analysis to find possible sources of heterogeneity in our study. In addition, publication bias was not detected, suggesting that the included results may be unbiased.
In conclusion, this study demonstrates that serum/plasma Cys C levels were significantly higher in T2DM patients compared with the healthy controls. In addition, subgroup analysis suggested that Cys C levels are influenced by human race, age, gender, study sample size and disease duration. Further investigations are still needed to explore the causal relationship of aberrant expression of Cys C in T2DM.