Introduction
Cardiovascular disease (CVD) is the leading cause of death worldwide. Greece has one of the lowest rates of coronary heart disease (CHD) mortality in Europe [1] and for this reason has typically been considered a nation at low cardiovascular risk [2]. However, the incidence of CVD in Greece between 2002 and 2012 was 19.7% in men and 11.7% in women [3], and 4.8% of Greek adults reported having experienced myocardial infarction (MI) in a 2006 survey [4]. Furthermore, CHD mortality in Greece remains higher than that in the United States and Japan [5], and among Greek adults with 1 or more cardiovascular risk factors, approximately one fourth are considered to be at high cardiovascular risk [6].
Cardiovascular risk factors with high or increasing prevalence in Greece include obesity [7], smoking [8], and dyslipidemia [6, 9, 10]. Dyslipidemia was found to be present in 73% of Greek adults with cardiovascular risk factors but without established CVD [6]. In the Prospective Observational Longitudinal Registry of Patients with Stable Coronary Artery Disease (CLARIFY), dyslipidemia was observed in 89% of the Greek cohort [9]. In the Greek TARGET study, an observational study enrolling consecutive patients with acute coronary syndrome (ACS), 72.5% of patients hospitalized for ACS had LDL-C concentrations above the recommended levels [10].
Clinical trials have established that low-density lipoprotein cholesterol (LDL-C) reduction is associated with a reduced risk of cardiovascular events [11], and based on this evidence, the 2011 Joint European Society of Cardiology and European Atherosclerosis Society (ESC/EAS) as well as Hellenic Atherosclerosis Society (HAS) guidelines recommend treating LDL-C to serum levels < 70 mg/dl in all patients with existing CVD [2, 12]. Although awareness and treatment of dyslipidemia in Greece have been shown to be low [13], treatment rates appear to be improving. In a recent study of high or very high cardiovascular risk patients visiting a Greek university lipid treatment clinic, 95% were on any lipid-lowering treatment (LLT) and 92% were on statins, but only 25% among very high risk adult outpatients reached recommended LDL-C levels [14]. In another study involving 19 outpatient cardiology clinics in 2011–2012, it was found that, among patients with CVD or diabetes and initiating a LLT, only 25.9% received a high-efficacy regimen [15]. Thus, the question remains whether LLT in Greece is producing sufficient reductions in LDL-C.
The goal of the second Dyslipidemia International Study (DYSIS II) was to document lipid levels, attainment of LDL-C target values, and use of LLTs in ACS and CHD patients classified as having very high cardiovascular risk. This manuscript reports the results from the Greek cohort of DYSIS II.
Material and methods
Study design
DYSIS II was a multicountry, multicenter observational study of patients with stable CHD and patients surviving any ACS event. Greece was one of 7 European countries participating. Participating physicians were general practitioners/family physicians, internists, cardiologists or endocrinologists representative of Greek physicians managing patients for secondary cardiovascular prevention. Acute care centers were selected to be representative of the acute and ambulatory treatment of secondary prevention in Greece. Data were collected from CHD patients by clinical examination and from medical charts during single outpatient visits. Data were collected from ACS patients by clinical examination and from medical charts at admission to the hospital and again via a telephone interview at 120 ±15 days after admission (the follow-up time point). All data were collected between 2013 and 2014 via a web-based data collection form using software developed by the Institut für Herzinfarktforschung (IHF) in Ludwigshafen, Germany. The study protocol was approved by a national ethics committee as per local regulations.
Study sample
Patients included in the CHD cohort were aged ≥ 18 years, had documented CHD, and had a full lipid profile available from the year prior to enrollment. Participation in the ACS cohort of DYSIS II and/or evidence of an ACS event within 3 months of enrollment were reasons for exclusion. Patients in the ACS cohort were aged ≥ 18, had been hospitalized for an ACS event, and had a full lipid profile based on blood drawn within 24 h of admission. All patients had to be on LLT for ≥ 3 months, or not taking LLT at all, at the time of enrollment (for the CHD cohort) or the time of admission to the hospital (for the ACS cohort). Patients taking LLT for < 3 months were excluded from the analysis. Each patient in both cohorts provided written informed consent specifying that he or she was not participating in any randomized clinical trials and would not do so for the duration of the study.
Study definitions and outcome variables
CHD cohort
CHD was documented by one of 5 procedures or diagnoses: coronary angiography (stenosis > 50%), cardiac computed tomography (stenosis > 50%), prior percutaneous cardiac intervention, prior coronary artery bypass graft, or a history of ACS > 3 months prior to enrollment. CHD patients were divided into two subgroups based on treatment status as defined above (on LLT for ≥ 3 months, or not taking LLT). Use of LLTs at the time of the lipid test was determined by chart review. Attainment of lipid target values was assessed once at the time of the enrollment visit.
ACS cohort
ACS was defined as one or more of the following events: ST segment elevation myocardial infarction (STEMI)/left bundle branch block (LBBB), non-ST segment elevation myocardial infarction (NSTEMI), or unstable angina (UA). Patients were divided into subgroups based on treatment status at admission as defined above. Use of LLTs at the time of the lipid test was determined by chart review at admission and by patient report at follow-up. This study followed the patients on LLT at admission to the follow-up time point. Thus, the designations of ‘treated’ or ‘on LLT’ regarding the ACS cohort refer to the treatment status at admission, regardless of the treatment status at follow-up.
Attainment of lipid target values was assessed in treated patients at two time points: (i) at admission, using lipid values determined within 24 h of admission which reflected lipid levels from the pre-ACS period; and (ii) at follow-up, using lipid values determined between admission and the follow-up interview. Two risk classification methods were employed at the admission time point. First, pre-ACS risk status (very high, high, moderate, or low) was determined for all patients and LDL-C was matched to it. Second, all patients were classified as very high risk based on the qualifying ACS event. Only the latter risk classification was used at the follow-up time point.
Cardiovascular health outcomes assessed at follow-up were rehospitalization, myocardial infarction, stroke, percutaneous coronary intervention, and coronary artery bypass graft.
Both cohorts
Demographic and clinical variables collected at enrollment included age, gender, body mass index (BMI), sedentary lifestyle, smoking status, and family history of CHD. Comorbidities, including hypertension and type 2 diabetes mellitus, were also recorded, as was the patient’s history of ACS, MI, UA, stable angina, congestive heart failure, stroke, chronic renal failure (CRF), or chronic kidney disease (CKD). Obesity was defined according to World Health Organization (WHO) criteria [16] as having a BMI > 30 kg/m2. Diabetes was defined as current treatment for diabetes, a previous diagnosis of diabetes, or a fasting plasma glucose level of ≥ 126 mg/dl. Likewise, hypertension was defined as current treatment, a previous diagnosis, or having blood pressure > 140/90 mm Hg. A sedentary lifestyle was defined as < 20–30 min of walking on < 3–4 days per week. Stroke was either ischemic or hemorrhagic.
The lipid profile included measurements of serum levels of total cholesterol, LDL-C, high-density lipoprotein cholesterol (HDL-C), triglycerides, and non-HDL-C. For the ACS cohort, target values for LDL-C for pre-ACS very high risk, high risk, moderate risk, and low risk patients were defined according to the 2011 ESC/EAS guidelines as < 70 mg/dl, < 100 mg/dl, < 115 mg/dl, and < 130 mg/dl, respectively [2]. According to the same guidelines, for both the cohorts, the secondary target value for non-HDL-C was < 100 mg/dl [2]. The median distance to the LDL-C target value was calculated for patients who had not attained the LDL-C target value on the date of the lipid profile.
The following mutually exclusive classes of LLT were assessed: statin monotherapy, non-statin monotherapy, statin plus ezetimibe, and statin plus other non-statin therapy (‘other’ non-statins included fibrates, omega-3 fatty acids, etc.). The statins assessed were atorvastatin, fluvastatin, lovastatin, pitavastatin, pravastatin, rosuvastatin, and simvastatin. Atorvastatin and simvastatin dose equivalents were calculated based on clinical trial data on the LDL-C-lowering efficacy of various statins [17].
Statistical analysis
SAS version 9.3 (Cary, NC, USA) was used for all statistical analyses. For all comparisons, a p-value < 0.05 was considered statistically significant. In univariate analyses, continuous variables are presented as means and standard deviations (SDs) or medians and interquartile ranges (IQRs), and categorical variables as numbers and percentages. Because of the distributions of the data, total cholesterol and LDL-C are reported as means and SDs, and HDL-C, triglycerides, and non-HDL-C as medians and IQRs.
In the CHD cohort, demographic and clinical variables and lipid profiles were compared between treated and untreated patients using χ2 or Mann-Whitney-Wilcoxon tests. The LLT use was assessed descriptively. LDL-C and non-HDL-C target value attainment rates were assessed using the target values described above. Multivariate logistic regression was used to identify variables predictive of LDL-C target value attainment among patients treated with LLT. Covariates were chosen based on their potential to affect LDL-C target value attainment and were included in the regression model without further selection.
In the ACS cohort, LDL-C target value attainment was assessed first by pre-ACS risk classification and then, with all patients classified as very high risk, by time point (admission and follow-up). Lipid profiles and types of LLT used at admission and follow-up were assessed descriptively. Multivariate logistic regression was carried out as for the CHD cohort. Assessment of cardiovascular outcomes at follow-up was done using Kaplan-Meier analysis, with p-values calculated by a log-rank test. For all comparisons, a p-value < 0.05 was considered statistically significant.
Results
CHD cohort
Characteristics of the study population
We identified 499 patients with CHD (Table I). The mean ± SD age was 67.6 ±11.5 years, and 88.4% were male. A majority of patients had a history of ACS, MI, or UA (73.3%) or hypertension (64.3%), and 43.7% had a sedentary lifestyle. CHD was determined by a history of ACS > 3 months prior to enrollment in 62.1% of patients and by prior percutaneous cardiac intervention in 51.7%.
Table I
Demographic and clinical characteristics of the study cohortsA
| Parameter | CHD cohort | ACS cohort | ||||||
|---|---|---|---|---|---|---|---|---|
| All patients (n = 499) | Patients on LLT (n = 457) | Patients not on LLT (n = 42) | P-valueB | All patients (n = 200) | Patients on LLT (n = 159) | Patients not on LLT (n = 41) | P-valueB | |
| Age, mean ± SD [years] | 67.6 ±11.5 | 67.5 ±11.6 | 69.0 ±10.3 | 0.41 | 63.6 ±11.1 | 65.1 ±10.4 | 58.1 ±11.9 | < 0.001 |
| Male, n (%) | 441 (88.4) | 404 (88.4) | 37 (88.1) | 0.95 | 154 (77.0) | 121 (76.1) | 33 (80.5) | 0.55 |
| Obese, n (%) | 133 (26.7) | 121 (26.5) | 12 (28.6) | 0.77 | 63 (31.5) | 51 (32.1) | 12 (29.3) | 0.74 |
| Sedentary lifestyleC, n (%) | 209 (43.7) | 184 (42.2) | 25 (59.5) | < 0.05 | 66 (35.3) | 56 (38.4) | 10 (24.4) | 0.10 |
| Current smoker, n (%) | 74 (14.8) | 66 (14.4) | 8 (19.0) | 0.42 | 84 (42.0) | 55 (34.6) | 29 (70.7) | < 0.001 |
| Family history of CHDC, n (%) | 159 (34.7) | 146 (34.9) | 13 (32.5) | 0.76 | 57 (29.8) | 48 (31.8) | 9 (22.5) | 0.25 |
| Hypertension, n (%) | 321 (64.3) | 293 (64.1) | 28 (66.7) | 0.74 | 134 (67.0) | 114 (71.7) | 20 (48.8) | < 0.01 |
| Type 2 diabetes mellitusC, n (%) | 129 (25.9) | 119 (26.0) | 10 (23.8) | 0.75 | 55 (27.8) | 46 (28.9) | 9 (23.1) | 0.46 |
| History of ACS, MI, or UA, n (%) | 366 (73.3) | 334 (73.1) | 32 (76.2) | 0.66 | – | – | – | – |
| History of stroke (ischemic or hemorrhagic)C, n (%) | 26 (5.2) | 24 (5.3) | 2 (4.8) | 0.88 | 6 (3.0) | 6 (3.8) | 0 (0.0) | 0.20 |
| History of CRF/CKD, n (%) | 39 (7.8) | 38 (8.3) | 1 (2.4) | 0.17 | 11 (5.5) | 11 (6.9) | 0 (0.0) | 0.08 |
| Stable angina, n (%) | 105 (21.0) | 91 (19.9) | 14 (33.3) | < 0.05 | 30 (15.0) | 28 (17.6) | 2 (4.9) | < 0.05 |
| History of congestive heart failureC, n (%) | 78 (15.6) | 71 (15.5) | 7 (16.7) | 0.85 | 8 (4.0) | 8 (5.1) | 0 (0.0) | 0.14 |
| Type of CHD, n (%): | ||||||||
| Coronary angiography (stenosis > 50%) | 235 (47.1) | 218 (47.7) | 17 (40.5) | 0.37 | – | – | – | – |
| Cardiac computed tomography (stenosis > 50%) | 7 (1.4) | 7 (1.5) | 0 (0.0) | 0.42 | – | – | – | – |
| Prior percutaneous cardiac intervention | 258 (51.7) | 241 (52.7) | 17 (40.5) | 0.13 | – | – | – | – |
| Prior coronary artery bypass graft | 158 (31.7) | 142 (31.1) | 16 (38.1) | 0.35 | – | – | – | – |
| History of ACS > 3 months prior to enrollment | 310 (62.1) | 281 (61.5) | 29 (69.0) | 0.33 | – | – | – | – |
| Time between last ACS and visit date, median (IQR) [months] | 57.0 (19.3, 123.8) | 56.1 (16.9, 116.9) | 123.2 (55.5, 136.7) | – | – | – | – | |
| Type of ACS when admitted, n (%): | ||||||||
| STEMI/LBBB MI | – | – | – | 69 (34.5) | 44 (27.7) | 25 (61.0) | < 0.001 | |
| NSTEMI | – | – | – | 67 (33.5) | 56 (35.2) | 11 (26.8) | 0.31 | |
| Unstable angina | – | – | – | 64 (32.0) | 59 (37.1) | 5 (12.2) | < 0.01 | |
ACS – acute coronary syndrome, CHD – coronary heart disease, CKD – chronic kidney disease, CRF – chronic renal failure, IQR – interquartile range, LBBB – left bundle branch block, LLT – lipid-lowering therapy, MI – myocardial infarction, NSTEMI – non-ST segment elevation myocardial infarction, SD – standard deviation, STEMI – ST segment elevation myocardial infarction, UA – unstable angina.
A total of 457 patients were on LLT and 42 were not (Table I), for a treatment rate of 91.6%. Patients not on LLT more frequently had a sedentary lifestyle (59.5% vs. 42.2% of those on LLT; p < 0.05) and stable angina (33.3% vs. 19.9% of those on LLT; p < 0.05).
Lipid profiles
Mean ± SD serum lipid concentrations in the CHD cohort were 162 ±36 mg/dl for total cholesterol and 91 ±31 mg/dl for LDL-C (Table II) and were significantly different between users and non-users of LLT (p < 0.001 for both comparisons). Median (IQR) serum HDL-C, triglyceride, and non-HDL-C concentrations were 44 (37–53) mg/dl, 120 (92–161) mg/dl, and 112 (93–133) mg/dl, respectively (Table II).
Table II
Lipid levels, distance to LDL-C target value, and dose equivalents in the CHD cohort
| Parameter | All patients (n = 499) | Patients on LLT (n = 457) | Patients not on LLT (n = 42) | P-valueA |
|---|---|---|---|---|
| Lipid concentrations [mg/dl]: | ||||
| Total cholesterol, mean ± SD | 162 ±36 | 159 ±32 | 201 ±47 | < 0.001 |
| LDL-C, mean ± SD | 91 ±31 | 87 ±28 | 129 ±39 | < 0.001 |
| HDL-C, median (IQR) | 44 (37, 53) | 44 (37, 53) | 43 (37, 52) | – |
| Triglycerides, median (IQR) | 120 (92, 161) | 120 (92, 158) | 129 (88, 186) | – |
| Non-HDL-C, median (IQR) | 112 (93, 133) | 110 (92, 130) | 156 (129, 183) | – |
| Distance to LDL-C < 70, median (IQR)B [mg/dl] | 27 (11, 44) | 24 (10, 37) | 64 (44, 93) | – |
| Atorvastatin dose equivalent, mean ± SD [mg/day] | – | 24 ±16 | – | – |
| Simvastatin dose equivalent, mean ± SD [mg/day] | – | 49 ±31 | – | |
Frequency and predictors of lipid target value attainment
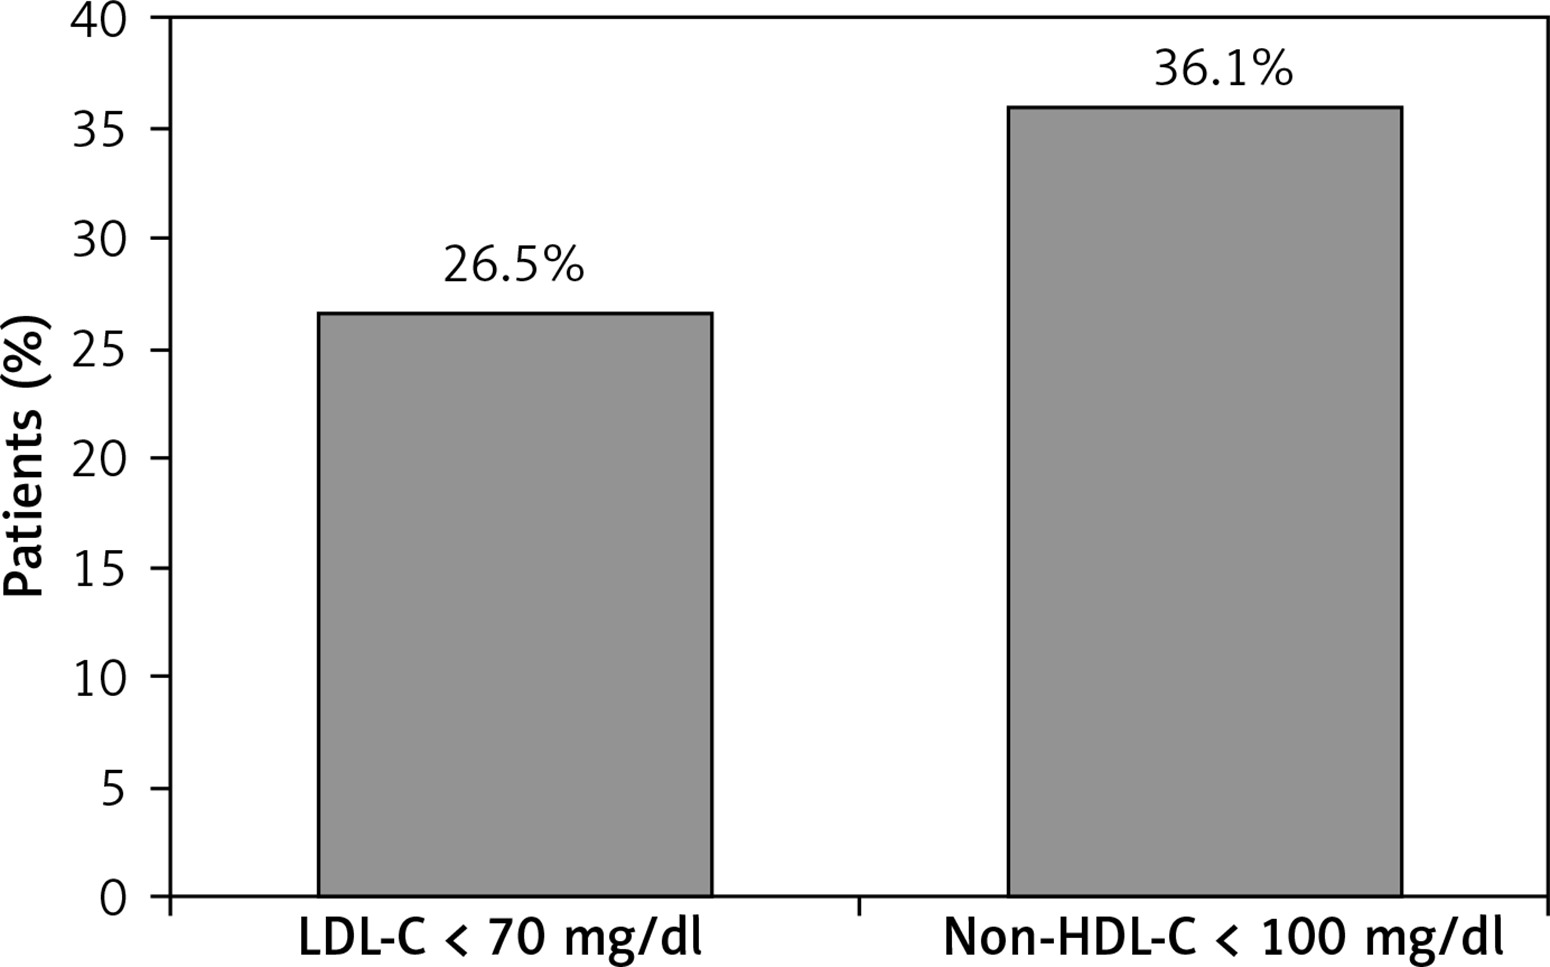
The LDL-C target value was attained by 26.5% of treated patients, and the secondary non-HDL-C target value by 36.1% (Figure 1). Among those not attaining the LDL-C target value, the median (IQR) distance to the target value in treated patients was 24 (10–37) mg/dl (Table II). In regression analyses, the only variable significantly associated with LDL-C target value attainment was having stable angina, which reduced the odds of attainment by 51% (OR = 0.49, 95% CI: 0.26–0.93; Table III).
Table III
Predictors of LDL-C target value attainment in patients treated with LLTA
ACS – acute coronary syndrome, BMI – body mass index, CHD – coronary heart disease, CI – confidence interval, LLT – lipid-lowering therapy.
A Bold font indicates statistical significance. All listed variables were included in the regression models without further selection. Variables were chosen based on their potential to affect LDL-C target value attainment and on the number of patients with non-missing data (n = 433 for the CHD cohort, n = 146 for the ACS cohort).
Use of lipid-lowering therapies
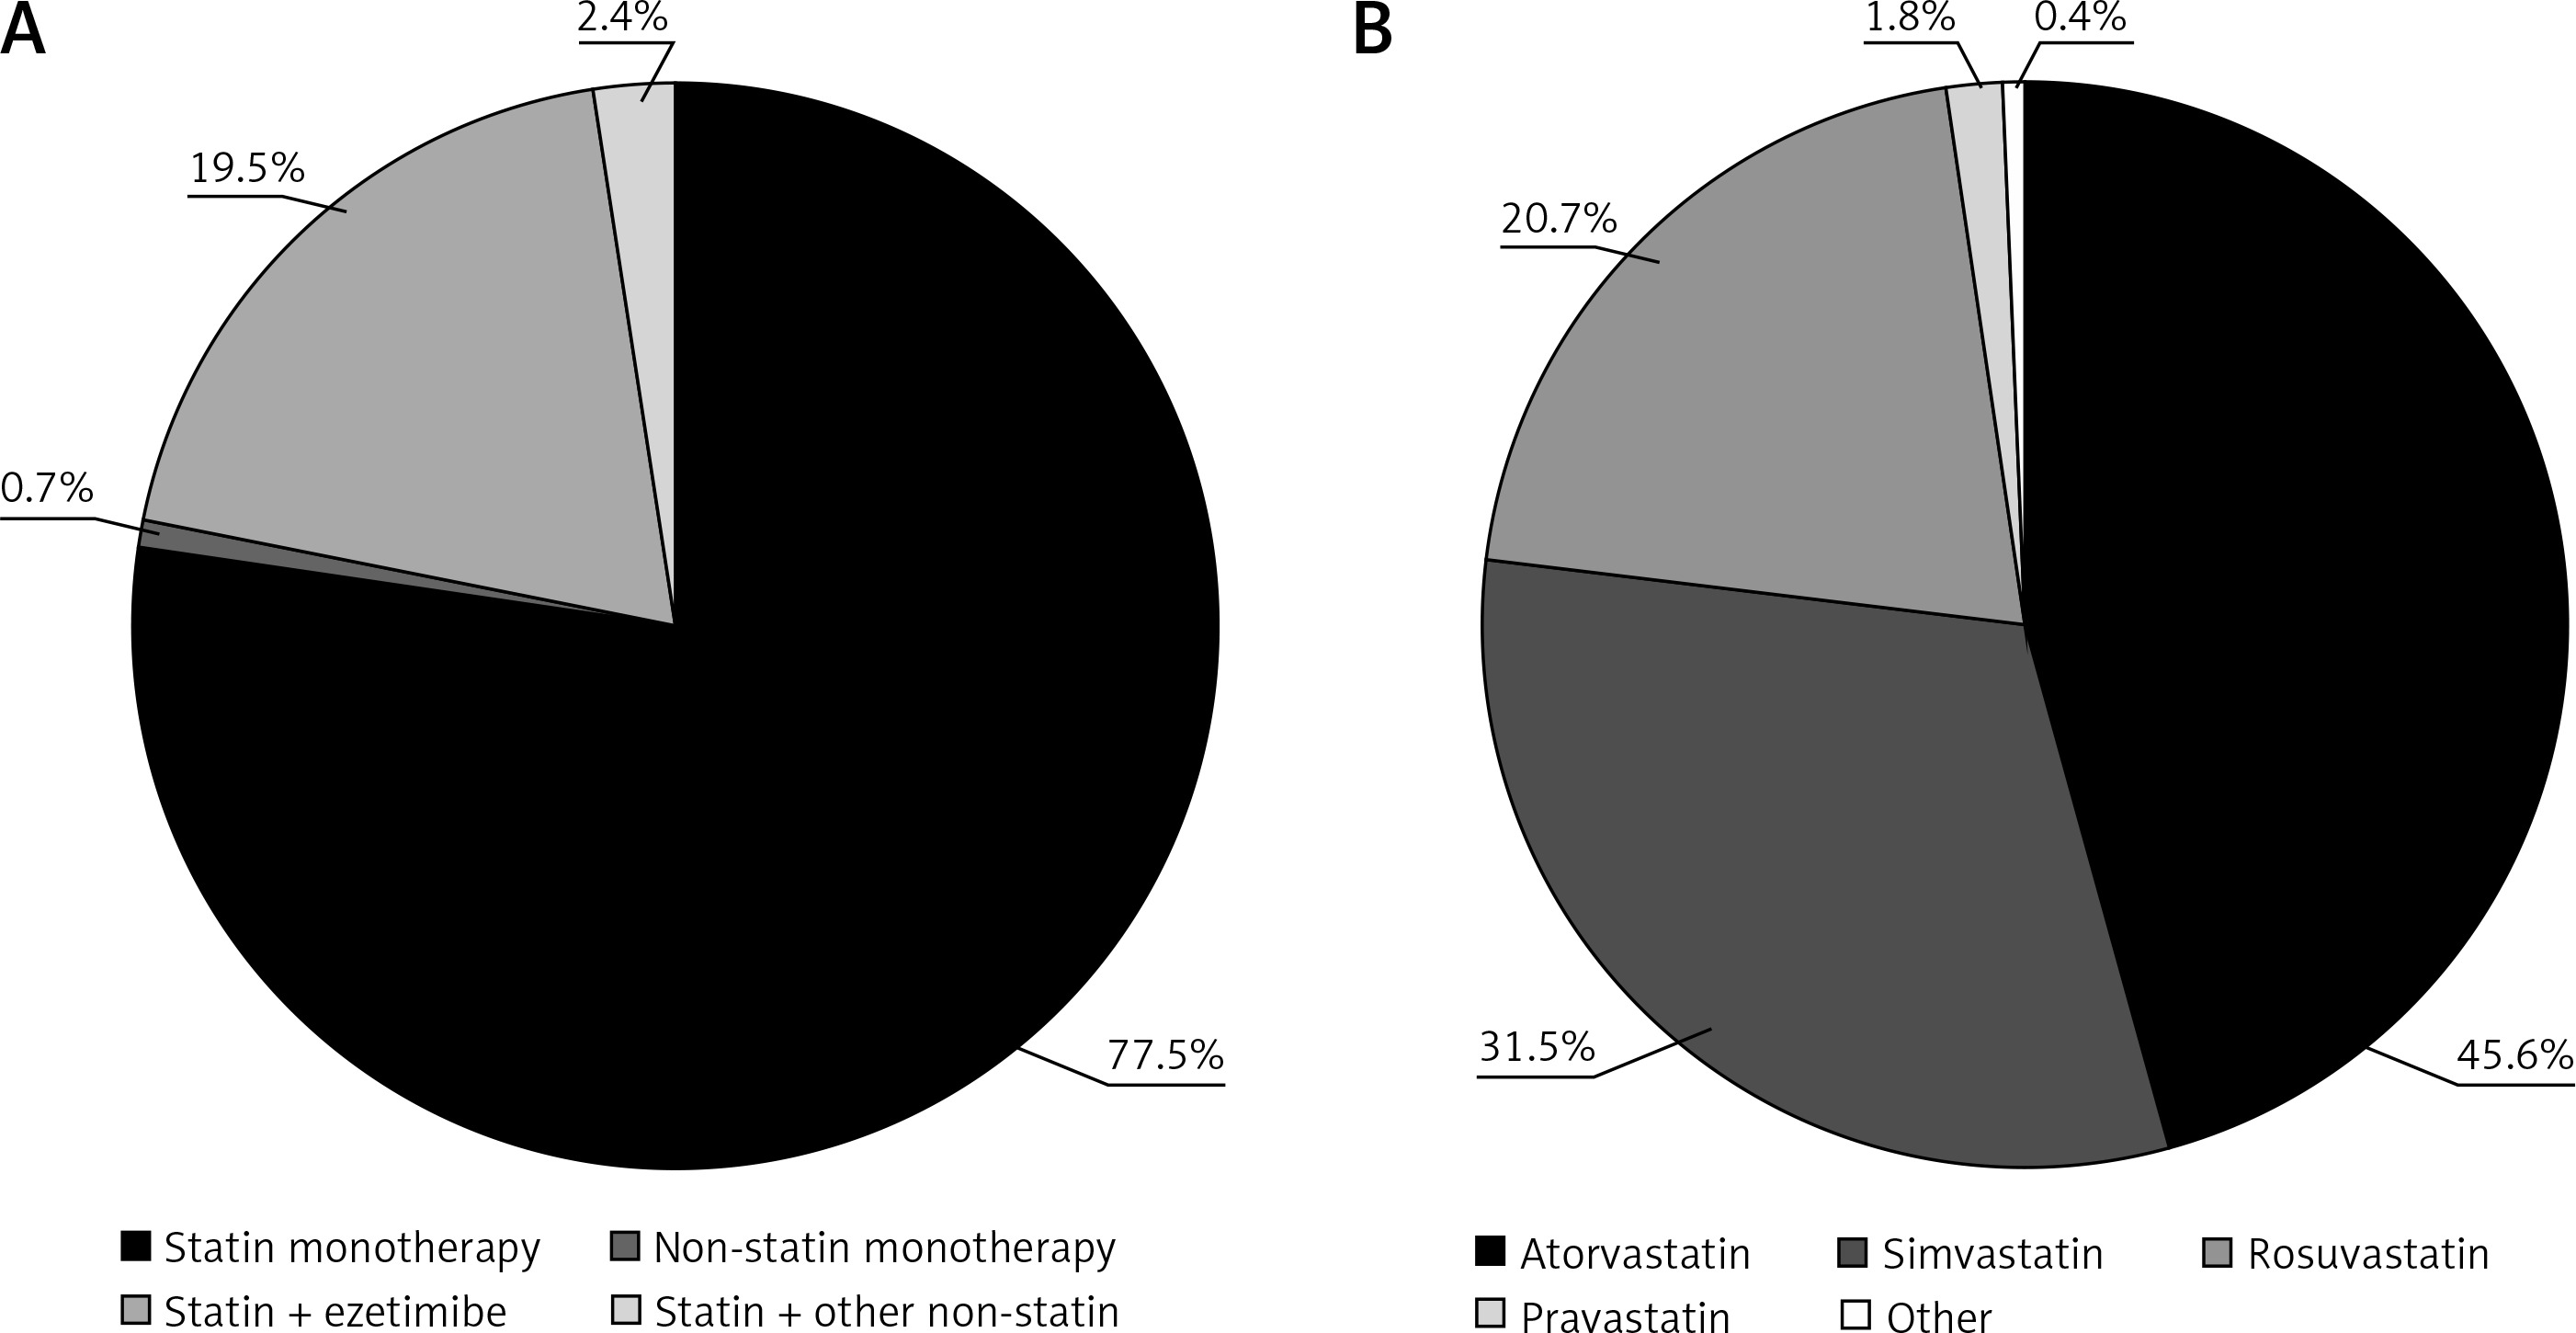
Among treated patients (n = 457), statin monotherapy was the most commonly used LLT (77.5%; Figure 2 A). A statin in combination with ezetimibe was taken by an additional 19.5% of patients. Among users of statin monotherapy or combination therapy (n = 454), atorvastatin, simvastatin, and rosuvastatin were the most commonly used treatments (45.6%, 31.5%, and 20.7% of patients, respectively; Figure 2 B). The mean ± SD atorvastatin dose equivalent was 24 ±16 mg/day (Table II).
Figure 2
Use of (A) selected classes of lipid-lowering therapies and (B) statins in the CHD cohort. Percentages reflect the inclusion of all treated patients (n = 457) in panel (A), and all statin-treated patients (monotherapy or combination therapy, n = 454) in panel (B). The ‘other non-statin’ treatments in panel (A) included fibrates, omega- 3 fatty acids, and any other non-statin therapy (except ezetimibe). The ‘other’ treatment in panel (B) included pitavastatin and fluvastatin.
CHD – coronary heart disease.
ACS cohort
Characteristics of the study population
We identified 200 patients hospitalized for ACS, 159 of whom were on LLT at admission (Table I). Among patients on LLT, the mean ± SD age was 65.1 ±10.4 years, and 76.1% were male.
Patients on LLT were older compared to those not on LLT (65.1 vs. 58.1 years; p < 0.001) (Table I). They had significantly higher rates of hypertension (71.7% vs. 48.8%; p < 0.01) and stable angina (17.6% vs. 4.9%; p < 0.05), but they were less frequently current smokers (34.6% vs. 70.7%; p < 0.001). ACS patients on LLT were less likely to be admitted with STEMI/LBBB MI (27.7% vs. 61.0% of patients not on LLT; p < 0.001), but more like to be admitted with UA (37.1% vs. 12.2%; p < 0.01).
Lipid profiles and lipid target value attainment
At admission, mean ± SD total cholesterol and LDL-C levels in patients on LLT were 177 ±48 mg/dl and 108 ±40 mg/dl, respectively (Table IV). Median (IQR) HDL-C, triglyceride, and non-HDL-C levels were 39 (33–45) mg/dl, 128 (97–172) mg/dl, and 134 (105–161) mg/dl, respectively. At follow-up, mean ± SD total cholesterol and LDL-C levels were 161 ±30 mg/dl and 86 ±25 mg/dl; serum levels of triglycerides and non-HDL-C had decreased, while levels of HDL-C had increased (Table IV). At admission, 20.1% of treated patients had attained the secondary non-HDL-C target value, and at follow-up, 29.0% had done so (data not shown).
Table IV
Lipid profiles, distance to target value, and dose equivalents at admission and follow-up in treated ACS patients
| Parameter | Admission (n = 159) | Follow-upA (n = 159) |
|---|---|---|
| Lipid concentrations [mg/dl]: | ||
| Total cholesterol, mean ± SD | 177 ±48 | 161 ±30 |
| LDL-C, mean ± SD | 108 ±40 | 86 ±25 |
| HDL-C, median (IQR) | 39 (33, 45) | 46 (42, 52) |
| Triglycerides, median (IQR) | 128 (97, 172) | 115 (94, 160) |
| Non-HDL-C, median (IQR) | 134 (105, 161) | 115 (95, 128) |
| Distance to LDL-C < 70 mg/dl, median (IQR)B | 40 (22, 71) | 25 (10, 40) |
| Atorvastatin dose equivalent, mean ± SD [mg/day] | 20 ±14 | 29 ±15 |
| Simvastatin dose equivalent, mean ± SD [mg/day] | 41 ±28 | 58 ±30 |
Among treated ACS patients, assessment of LDL-C target value attainment by pre-ACS risk classification showed that 100.0% of low risk patients, 77.8% of moderate risk patients, 42.9% of high risk patients, and 17.4% of very high risk patients attained their respective LDL-C target values according to pre-ACS classification (Figure 3 A). After classification of all patients as very high risk due to an ACS event, 17.6% of patients on LLT attained the LDL-C target value of < 70 mg/dl at admission (data not shown). Among those not attaining the target value, the median (IQR) distance to the LDL-C target value at admission was 40 (22–71) mg/dl (Table IV).
Figure 3
LDL-C target value attainment in ACS patients receiving lipid-lowering therapy (A) by pre-ACS risk level and (B) over time. A – The targets for very high, high, moderate, and low risk patients were, respectively, < 70 mg/dl, < 100 mg/dl, < 115 mg/dl, and < 130 mg/dl. Risk levels were determined from patient characteristics prior to admission. B – Goal attainment was calculated using available LDL-C data from 68 treated patients with data at both admission and follow-up
ACS – acute coronary syndrome, LDL-C – low-density lipoprotein cholesterol.
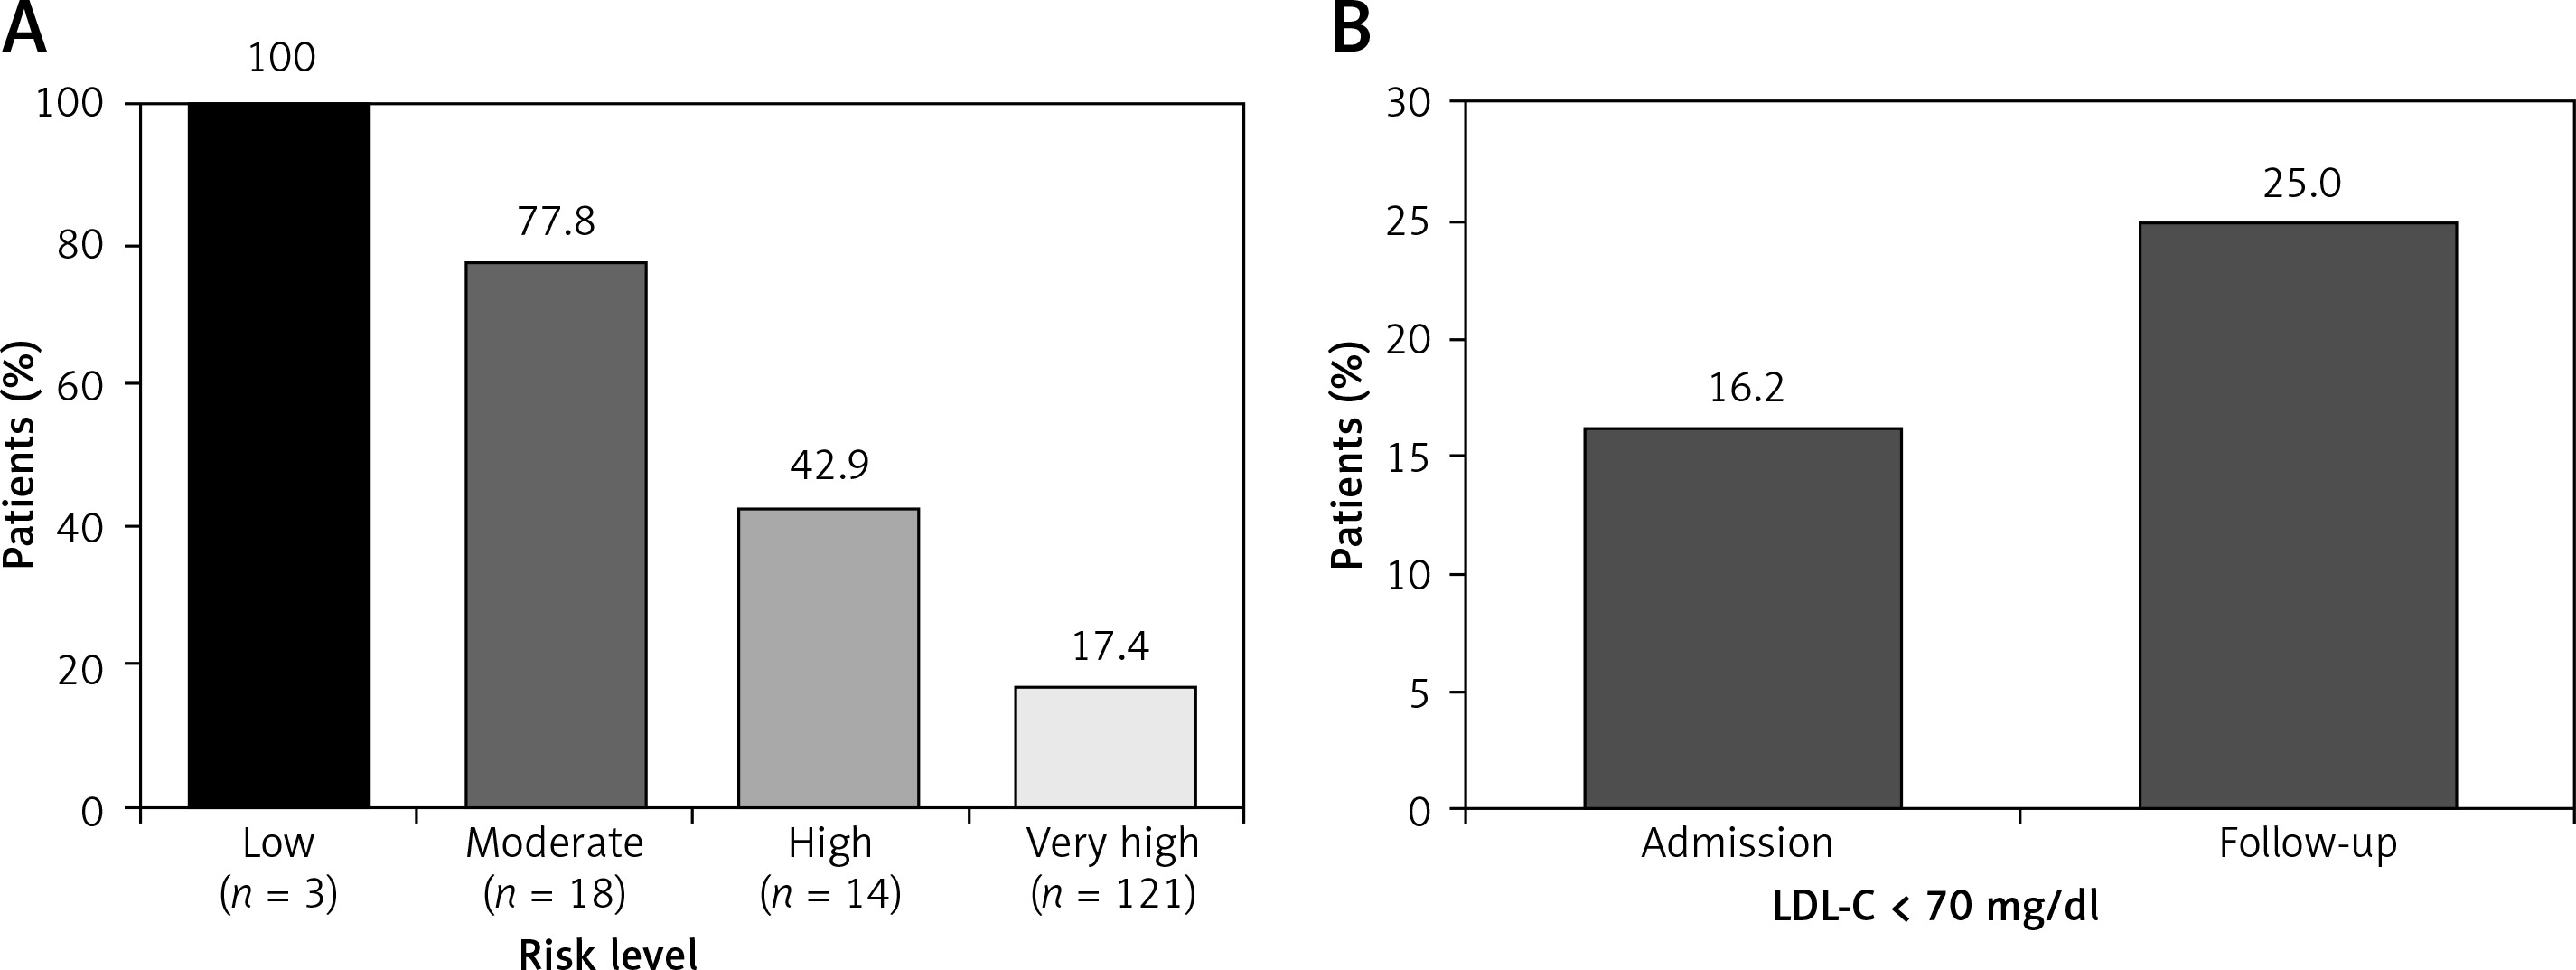
At follow-up, 25.0% of the 68 treated patients with LDL-C data had attained the LDL-C target value (Figure 3 B). Among these patients, 16.2% had attained the LDL-C target value at admission (Figure 3 B). Among patients not attaining the target value at follow-up, the median (IQR) distance to the LDL-C target value was 25 (10–40) mg/dl (Table IV). In treated ACS patients, the statin dose was predictive of LDL-C target value attainment, with an increase of 5% in the odds of attainment for every mg/day increase in the atorvastatin dose equivalent (OR = 1.05, 95% CI: 1.02–1.08; Table III).
Use of lipid-lowering therapies
Based on 159 treated ACS patients, the treatment rate at admission was 79.5%. At admission, LLTs consisted primarily of statin monotherapy (86.8%; Figure 4 A), with atorvastatin and simvastatin as the most frequently used statins (55.1% and 23.7% of statin users; Figure 4 B). The mean ± SD atorvastatin dose equivalent was 20 ±14 mg/day (Table IV).
Figure 4
(A) Lipid-lowering therapy and (B) statin use at admission and follow-up in the ACS cohort. A – Percentages reflect mutually exclusive treatment types among all treated patients at admission (n = 159) and, among them, the patients with available treatment data at follow-up (n = 153). B – Percentages are based on 156 patients receiving statins at admission and 151 patients receiving statins at follow-up. ‘Other’ includes fluvastatin and pravastatin. No patients received fluvastatin at follow-up
ACS – acute coronary syndrome.
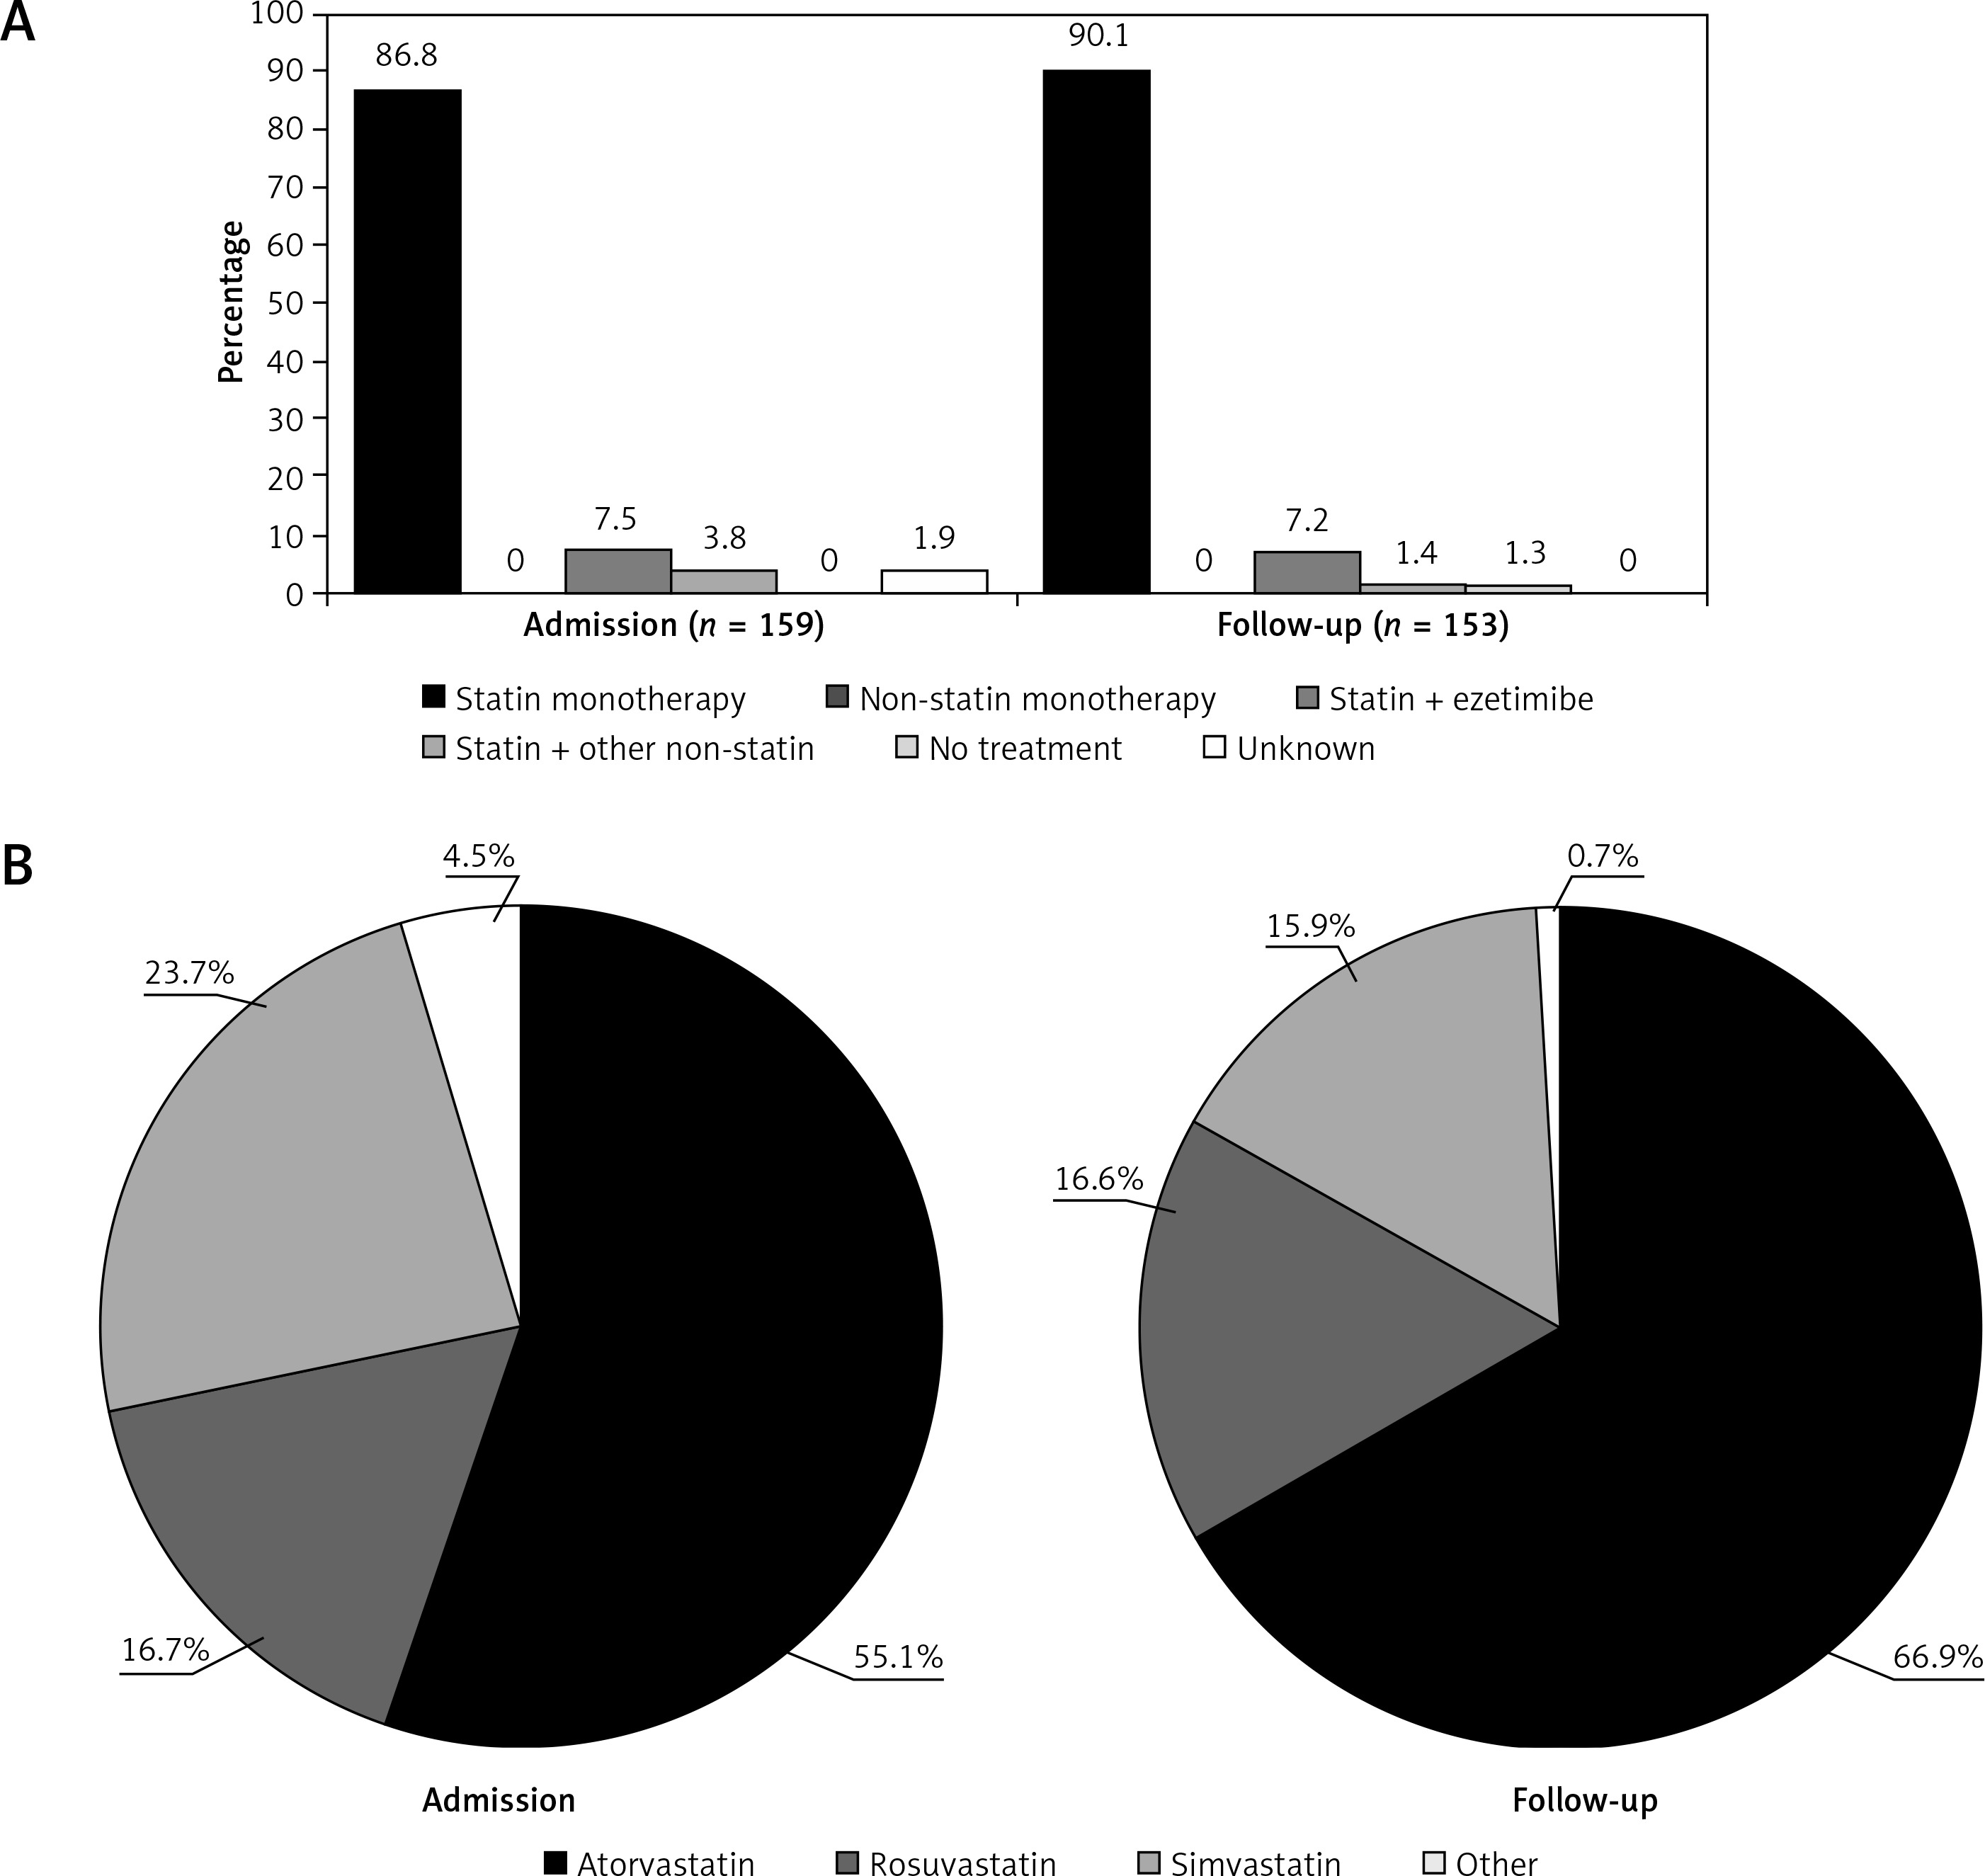
Among the 153 patients with treatment data available at follow-up, 1.3% were no longer receiving LLT (Figure 4 A). Treatment distributions at follow-up were broadly similar to those at admission, except that use of monotherapies increased and use of combination therapies decreased slightly (Figure 4 A). Among statin users, atorvastatin use increased to 66.9% and simvastatin use decreased to 15.9% (Figure 4 B). The mean ± SD atorvastatin dose equivalent at follow-up was 29 ±15 mg/day (Table IV).
Discussion
In the Greek cohort of DYSIS II, despite nearly universal treatment with statins, only about 25% of CHD patients attained the LDL-C target value, with a median distance to the target value of 24 mg/dl in those not reaching the target value. Among ACS patients, an increase in the atorvastatin dose potency between admission and follow-up, from 20 mg/day to 29 mg/day, correlated with an increase in LDL-C target value attainment, from 17% at admission to 25% at follow-up. Accordingly, the statin dose was found to be predictive of LDL-C target value attainment in ACS patients.
DYSIS [18] applied the 2007 ESC guidelines [19] to the Greek cohort for risk classification and LDL-C target values and thus did not define a very high risk group of patients. In that study, using a target value of < 2.5 mmol/l (< 97 mg/dl), 39% of all high risk patients and 46.5% of all CVD patients attained the target [18]. DYSIS II applied the more stringent cutoff of < 70 mg/dl recommended by the 2011 ESC guidelines [2] for patients at very high risk, and therefore much lower rates of attainment were observed. In other studies applying the < 70 mg/dl LDL-C target value to Greek patients, attainment rates were 10.0% in patients with CVD or diabetes and newly treated with LLT for a median of 3 months [15]; 14.7% among patients on LLT in the Centralized Pan-European Survey on the Undertreatment of Hypercholesterolemia (CEPHEUS) [20]; 16.2% and 18.2%, respectively, in ACS patients upon admission to a hospital and 6 months after discharge [10, 21]; 25% among very high risk adult outpatients at a lipid treatment clinic [14], and 15.5% among very high risk patients in the CHALLENGE study [22]. Thus, LDL-C target value attainment in CHD and ACS patients in DYSIS II (25% for both) was at the high end of the range observed to date in very high risk Greek patients.
In DYSIS II, the statin dose was not predictive of LDL-C target value attainment in CHD patients, whereas in ACS patients it was. In DYSIS, Liberopoulos et al. found that the statin dose was not predictive of LDL-C target value attainment in statin users, whereas use of ezetimibe was associated with better LDL-C target value attainment [18]. These differences may have arisen from the differing characteristics of the patient populations enrolled in DYSIS (all statin users) versus DYSIS II (very high risk status treated with a variety of LLTs). In addition, the patients in DYSIS were using simvastatin dose equivalents of 20–40 mg/day, which is lower than the dose equivalent used by either the CHD or ACS patients in the current study.
Previous studies in Greece support the idea that LLT potency affects LDL-C target value attainment. In Greek patients with CVD or diabetes newly initiating LLT, a drug regimen with very high potency, defined as a regimen producing > 55% reduction in LDL-C, was associated with double the odds of LDL-C target value attainment when compared with lower efficacy regimens (OR = 2.21; p = 0.02) [15]. Likewise, among adults receiving LLT at a lipid treatment clinic in Ioannina, 41% of those on combination therapy versus 31% on statin monotherapy attained the recommended LDL-C levels (p < 0.03) [14].
In the current study, 92% of CHD patients were on LLT, and 80% of ACS patients were on LLT at admission. In both groups, atorvastatin was the most commonly used statin, followed by simvastatin. In the Greek cohort of DYSIS, simvastatin (43.6% of patients) was used slightly more often than atorvastatin (37.4%) [18], and the same was true in the study of CVD/diabetes patients initiating LLT [15]. Among the high or very high risk patients in a lipid treatment clinic, 95% were on any LLT and 92% were on statins (67% statin monotherapy and 33% statin therapy in combination with other drugs); atorvastatin and rosuvastatin were the predominant statins (43% and 32% of statin-treated patients, respectively) [14]. Further studies are needed to determine whether LLT regimens in Greece are changing over time.
In the TARGET study of Greek ACS patients, the rate of statin use increased from 40% at hospital admission to 93% at discharge and then decreased to 88% at the 6-month follow-up visit [10, 21]. In DYSIS II, 156 of 200 ACS patients received statins at admission (78%), and 151 of them were still using statins at the 4-month follow-up assessment (97% retention among treated patients; 76% of the total ACS cohort). These high levels of adherence in ACS patients are consistent with other studies of Greek patients in which 87% reported missing 3 or fewer LLT doses per month [21] and 90% reported missing 4 or fewer doses [20]. Adherence would certainly be expected to affect LDL-C target value attainment, as shown by Barkas et al. for high risk and very high risk patients receiving LLT [14].
Distinctive features of DYSIS II include enrollment of a very high risk patient population, to which the most stringent LDL-C target value applies, and inclusion of untreated patients, which provides insight into the gains achieved by use of LLTs. Limitations of the DYSIS II analysis include the relatively short follow-up time in the ACS cohort, which may have affected treatment rates and thus the follow-up LDL-C levels, and the cross-sectional evaluation of CHD patients, which is limited to a single point in time. Omission of non-statin therapies from the regression analyses limits the conclusions that can be drawn regarding the effects of dose potency on LDL-C target value attainment.
Adherence to statin treatment is known to be poor in clinical practice and is associated with an increased risk for CVD events [23–25]. In this context, statin-associated side effects and statin intolerance may contribute to increased rates of treatment discontinuation [26–28]. In DYSIS II adherence to statin treatment and discontinuation rates were not directly assessed and therefore no relevant data are provided. Of note, DYSIS II was not a safety surveillance study, nor a clinical trial. Thus, no systematic collection of drug-related adverse events took place. Familial hypercholesterolemia (FH) is associated with poor LDL-C target achievement in clinical practice [29, 30]. Unfortunately, we did not collect data on the prevalence of FH in our population. Finally, we used the Friedewald equation for estimating LDL-C, which however is known to underestimate LDL-C at values < 100 mg/dl. The use of a higher precision estimate, such as the validated Johns Hopkins LDL-C algorithm, would increase the percentage of patients achieving the LDL-C target, as is the case for non-HDL-C in our study [31].
In conclusion, this analysis of DYSIS II showed that rates of attainment of the recommended LDL-C value are low in Greek CHD and ACS patients. Patients not attaining the LDL-C target value remain substantially above it.