Introduction
Ovarian cancer is the most lethal gynecologic malignancy, carrying a 5-year survival rate of 40% [1, 2]. Serous epithelial ovarian cancer (SEOC) is the most common ovarian neoplasm and lacks specific clinical symptoms at an early stage [3]. The majority of observed cases are diagnosed at advanced stages (according to the International Federation of Gynecology and Obstetrics (FIGO) classification stage III–IV) with disseminated intra-abdominal metastasis [4–6].
There is substantial evidence obtained in human and animal studies indicating that certain bioactive sphingolipids are involved in development and progression of cancer [7–12]. Sphingolipids are a group of lipids containing an organic aliphatic amino alcohol sphingosine backbone or a substance structurally similar to it. Ceramides (CER) are some of the most important elements in the metabolism of sphingolipids. Apart from ceramides, biologically active sphingolipids include dihydroceramide, sphingosine-1-phosphate (S1P), sphingosine (Sph) and sphinganine (SPA). Based on several studies, ceramides have pro-apoptotic properties and constitute an important antineoplastic factor (lipid tumor suppressors). Sphingosine-1-phosphate acts antagonistically to ceramides, as it induces cell transformation, cancer cell proliferation and cell survival, and blocks the anti-apoptotic mechanisms of ceramides. Moreover, an increase in the expression of sphingosine kinase (SPHK1), an enzyme that transforms Sph to S1P, causes accumulation of S1P in the cell, promoting carcinogenesis and tumor formation [13–15].
Platelets (PLT) play a central role in hemostasis and thrombosis, and contribute to the development of a variety of diseases, including malignancies [16, 17]. Accumulating experimental and clinical evidence supports the hypothesis that PLT during cancer (in response to endothelial or epithelial injury) promote disease progression. The concept that PLT may participate in cancer biology is not new, since an experimental reduction in PLT count or platelet function was found to have an anti-metastatic effect in an animal model. The results of numerous randomized clinical trials demonstrated that anti-platelet drugs might reduce the incidence of some cancers. On the other hand, numerous in vitro or in vivo studies also investigated the platelet-mediated mechanisms of cancer progression including tumor growth, angiogenesis and metastasis development [18–20].
The role of CER in PLT and red blood cell (RBC) function in patients with advanced serous ovarian cancer is still uncertain. No data are available on the level of different bioactive sphingolipids in the blood cells in patients with that neoplastic ovarian disease. It was, therefore, the aim of the present study to examine the level of bioactive sphingolipids (CER, S1P, Sph, SPA) in plasma, erythrocytes and platelets of patients with advanced serous ovarian cancer.
Material and methods
Subjects
The investigation conforms with the principles outlined in the Declaration of Helsinki and was approved by the Ethical Committee for Human Studies of the Medical University of Bialystok, Poland (recruitment between January 2015 and December 2016). All patients gave their informed consent prior to their inclusion in the study. The patients suspected to have an advanced ovarian cancer were examined in the Department of Gynecology and Gynecologic Oncology, Medical University of Bialystok and pre-treatment diagnosis were evaluated based on present adnexal masses with metastasis spread into the pelvis and abdomen confirmed by computed tomography (CT) scan, ascites, and elevated level of Ca-125. IOTA Logistic Regression Models giving an indication of the probability of malignancy of an ovarian tumor were also used.
The study included two groups of women: 135 patients with serous advanced ovarian cancer (SAOC) according to the FIGO classification stage III–IV and women with normal ovarian morphology confirmed by transvaginal sonography evaluation (control group, n = 159). All initial diagnoses according to ovarian cancer patients and the healthy group (control) were confirmed postoperatively by final histology reports. A venous blood sample of 15 ml was collected from each patient 24 h before any medical or surgical procedure.
Blood fractionation
Immediately after sampling into sterile tubes containing 4.9 ml of 3.8% (w/v) trisodium citrate blood was centrifuged at 300 × g for 10 min at room temperature and the platelet-rich plasma was transferred to a fresh plastic tube. The leukocyte-rich buffy coat was thoroughly removed. Separated erythrocytes were suspended in phosphate-buffered saline (PBS), centrifuged at 800 × g for 10 min and the upper layer as well as the remaining buffy coat was discarded. Red blood cell were then resuspended in PBS and flash frozen in liquid nitrogen. Platelet-rich plasma was centrifuged at 5000 × g for 10 min to separate platelets. Supernatant was then transferred to a fresh plastic tube and recentrifuged at 5000 × g for 10 min to obtain platelet-free plasma. Isolated thrombocytes were washed with platelet wash buffer (5 mM KH2PO4, 5 mM Na2HPO4, 0.1 M NaCl, 1% glucose, 0.63% sodium citrate, pH 6.6), suspended in PBS, and flash frozen in liquid nitrogen. All samples were stored at –80°C until analysis.
Hemoglobin concentration in RBC suspensions was determined colorimetrically using Drabkin’s reagent kit (Sigma). Protein concentration in platelet samples was measured with the BCA protein assay kit (Sigma).
Plasma, red blood cells, platelets sphingolipids
The content of plasma, RBC and PLT sphingolipids in a venous blood sample of 10 ml was collected for EDTA tubes as mentioned above. The blood was centrifuged for 15 min. Plasma was subsequently separated and frozen at –80°C.
The level of sphingolipids in plasma was analyzed by the LC/MS/MS approach as previously described by Blachnio-Zabielska et al. with minor modification [21]. Briefly, to each plasma sample (100 μl) 50 μl of the internal standard solution (17C-sphingosine and 17C-S1P, C17-Cer and C25-Cer Avanti polar lipids) were added as well as 1.5 ml of an extraction mixture (isopropanol : water : ethyl acetate, 35 : 5 : 60; v : v : v). The following sphingolipids were quantified: SPH, S1P, SPA, ceramide C14:0-Cer (ceramides containing myristic acid), C16:0-Cer (ceramides containing palmitic acid), C18:1-Cer (ceramides containing oleic acid), C18:0-Cer (ceramides containing stearic acid), C20:0-Cer (ceramides containing arachidic acid), C22:0-Cer (ceramides containing behenic acid), C24:1-Cer (ceramides containing nervonic acid) and C24:0-Cer (ceramides containing lignoceric acid). The mixture was vortexed, sonicated and then centrifuged for 10 min at 4000 rpm (Sorvall Legend RT). The supernatant was transferred to a new tube and the pellet was re-extracted. After centrifugation supernatants were combined and evaporated under nitrogen. The dried sample was reconstituted in 100 μl of LC Solvent A (2 mM ammonium formate, 0.15% formic acid in methanol) for LC/MS/MS analysis. Quantitative measurement was performed using a triple quadrupole mass spectrometer (Agilent 6460) in positive mode using multiple reaction monitoring (MRM). The chromatographic separation was performed on an Agilent 1290 Infinity Ultra High Performance Liquid Chromatography (UHPLC) system. The analytical column was a reverse-phase Zorbax SB-C8 column 2.1 × 150 mm, 1.8 μm. Chromatographic separation was conducted in binary gradient using 2 mM ammonium formate, 0.15% formic acid in methanol as Solvent A and 1.5 mM ammonium formate, 0.1% formic acid in water as Solvent B at the flow rate of 0.4 ml/min. All sphingolipids were quantified against a standard concentration curve. The flow was diverted to waste for the first and the last four minutes to prevent eluting impurities from entering the mass spectrometer.
Statistical analysis
Descriptive statistics including mean concentration and min-max values of the mean concentration were calculated for selected sphingolipids, henceforth called features. For statistically significant differences between examined groups, either fitting an analysis of variance model was conducted or a non-parametric method (Wilcoxon rank-sum test) was applied. The choice of an appropriate method was made upon fulfilling the normality and the homogeneity of variances assumptions and in case of violation of at least one condition a non-parametric approach was employed. The normality of features’ distribution was checked with the Shapiro-Wilk test and the homogeneity of variances with Levene’s test. In order to determine the diagnostic accuracy (sensitivity and specificity) of statistically significant differences among experimental groups, receiver operating characteristic (ROC) curves were drawn and the area under the curve (AUC) was calculated, constructed and optimal threshold values were determined with the Youden method. Calculations concerning ROC curves and corresponding tests were conducted with the functions provided by the pROC R package. Confidence intervals for sensitivity and specificity were constructed using the binom.confint function, part of the binom R package. All calculations were carried out in the R software environment. Finally, Spearman’s rank test was used to correlate each examined sphingolipid’s derivativeness. An α significance level equal to 0.05 was applied for all statistical tests.
Results
The characteristics of the patients are presented in Tables I and II. The patients with advanced serous ovarian cancer and the healthy controls were statistically similar with respect to age, body mass index, systolic and diastolic blood pressures, erythrocyte count, hemoglobin, glucose, triglycerides and total cholesterol. When compared to the control group, the ovarian cancer group had a significantly higher platelet count (p < 0.0001), higher leukocyte count (p < 0.004), higher serum Ca-125 level (p < 0.0001) and lower total protein level (p < 0.0001).
Table I
Clinical characteristics of the patients with serous advanced ovarian cancer (AOC) and control group included in the study
| Parameter | Patients with advanced ovarian cancer (n = 135) | Control group (n = 159) | P-value |
|---|---|---|---|
| Median (25th–75th percentile) | |||
| Age | 57.8 (42.2–66.7) | 51.9 (40.1–63.9) | 0.050* |
| BMI | 26.2 (25.3–28.1) | 28.1 (26.1–29.1) | 0.792 |
| Systolic BP | 134.4 (112.2–152.5) | 119.3 (98.7–131.1) | 0.731 |
| Diastolic BP | 84.2 (69.5–89.1) | 79.2 (60.3–86.3) | 0.454 |
| RBC | 3.8 (2.9–4.7) | 3.0 (2.9–4.7) | 0.287 |
| HGB | 12.1 (10.9–14.1) | 10.2 (10.1–13.1) | 0.356 |
| PLT | 620.1 (512.1–777.2) | 249.5 (167.1–367.9) | 0.0001* |
| WBC | 11.1 (8.7–12.9) | 7.9 (6.2–10.1) | 0.004* |
| Ca-125 | 1182.4 (903.2–1399.1) | 11.8 (6.7–21.2) | 0.0001* |
| Glucose | 89.8 (71.1–99.9) | 72.5 (68.1–88.1) | 0.781 |
| Triglycerides | 1.8 (0.9–2.2) | 1.5 (0.9–1.8) | 0.123 |
| Total cholesterol | 182.3 (149.9–212.4) | 173.3 (155.4–198.9) | 0.085 |
| Total proteins | 4.3 (3.0–5.1) | 7.6 (6.5–7.9) | 0.0001* |
Table II
Clinicopathological characteristic of the patients with high-grade serous advanced ovarian cancer (n = 135)
There were significantly higher plasma concentrations of C16-Cer, C18:1-Cer and C18-Cer (1.5-fold, p = 0.021; 1.8-fold, p = 0.036 and 1.5-fold, p = 0.031, respectively) in the advanced serous ovarian cancer group compared to the control group. Furthermore, there was a significant increase in the erythrocyte concentration of C18:1-Cer in the advanced serous ovarian cancer group (p = 0.027) compared to the control group (Table III).
Table III
Concentration of sphingolipids in: plasma, erythrocytes (RBC) and platelets (PLT): ovarian cancer patients and healthy women (control group)
| Sphingolipids | Concentration of sphingolipids in plasma (ng/100 ml) – median (25th –75th percentile) | RBC sphingolipid concentration (ng/100 ml) – median (25th –75th percentile) | PLT sphingolipid concentration (ng/ml) – median (25th –75th percentile) | ||||||
|---|---|---|---|---|---|---|---|---|---|
| Ovarian cancer patient (n = 135) | Control group (n = 159) | P-value | Ovarian cancer patient (n = 135) | Control group (n = 159) | P-value | Ovarian cancer patient (n = 135) | Control group (n = 159) | P-value | |
| Total Cer | 4236.40 (2276.54–6874.37) | 3772.72 (2976.38–5743.34) | 0.244 | 100.15 (69.41–123.89) | 101.42 (76.56–114.38) | 0.642 | 444.13 (314.60–570.14) | 382.67 (259.09–523.81) | 0.499 |
| SPH | 77.84 (33.39–91.29) | 96.74 (47.98–156.34) | 0.201 | 1.00 (0.49–1.29) | 0.97 (0.46–1.14) | 0.573 | 127.08 (47.33–203.12) | 145.18 (43.24–141.49) | 0.978 |
| SPA | 27.56 (9.26–46.77) | 26.87 (8.90–44.80) | 0.843 | 0.18 (0.09–0.21) | 0.17 (0.12–0.21) | 0.583 | 24.75 (10.21–43.93) | 31.87 (10.84–36.96) | 0.757 |
| S1P | 424.63 (271.84–601.40) | 420.35 (301.39–590.35) | 0.844 | 18.08 (10.49–23.31) | 14.44 (9.48–19.44) | 0.083 | 244.38 (127.57–292.28) | 234.34 (100.10–340.13) | 0.714 |
| C14:0-Cer | 7.70 (3.94–12.13) | 8.09 (4.00–13.20) | 0.675 | 0.09 (0.07–0.11) | 0.09 (0.07–0.11) | 0.583 | 1.38 (0.69–1.62) | 1.34 (0.74–1.53) | 0.704 |
| C16:0-Cer | 403.67 (261.39–660.28) | 261.60 (119.90–387.40) | 0.021* | 8.93 (6.73–11.55) | 8.26 (6.84–9.48) | 0.481 | 73.96 (51.07–97.67) | 68.37 (46.71–87.79) | 0.583 |
| C18:1-Cer | 7.35 (4.00–13.00) | 3.89 (1.02–7.25) | 0.036* | 0.10 (0.08–0.22) | 0.08 (0.0439–0.0918) | 0.027* | 1.06 (0.65–1.19) | 0.98 (0.65–1.25) | 0.642 |
| C18:0-Cer | 161.74 (87.98–276.99) | 92.43 (54.57–159.34) | 0.031* | 2.78 (1.98–3.51) | 2.61 (1.97–3.46) | 0.833 | 38.36 (20.82–50.82) | 30.66 (16.55–43.13) | 0.226 |
| C20:0-Cer | 117.20 (46.86–181.74) | 104.85 (55.33–176.55) | 0.056 | 1.53 (1.02–1.82) | 1.65 (1.19–1.98) | 0.360 | 61.35 (33.98–72.64) | 48.52 (33.08–58.87) | 0.304 |
| C22:0-Cer | 557.78 (221.62–723.72) | 514.97 (200.29–754.87) | 0.444 | 9.77 (6.66–11.58) | 11.39 (6.26–14.28) | 0.704 | 95.44 (63.02–130.85) | 88.14 (54.20–107.78) | 0.989 |
| C24:1-Cer | 1332.82 (501.28–1991.82) | 1174.83 (499.11–1799.37) | 0.073 | 49.89 (34.02-52.25) | 43.53 (34.26–52.26) | 0.237 | 95.23 (64.02–109.61) | 70.31 (44.84–86.38) | 0.067 |
| C24:0-Cer | 1648.14 (520.38–2288.77) | 1470.15 (512.00–2234.66) | 0.421 | 27.06 (12.97-37.33) | 33.83 (12.79–36.54) | 0.989 | 77.34 (53.71–85.49) | 74.37 (46.48–95.75) | 0.767 |
CER – ceramides, Sph – sphingosine, SPA – sphinganine, S1P – sphingosine-1-phosphate, C14:0-Cer – ceramides containing myristic acid, C16:0-Cer – ceramides containing palmitic acid, C18:1-Cer – ceramides containing oleic acid, C18:0-Cer – ceramides containing stearic acid, C20:0-Cer – ceramides containing arachidic acid, C22:0-Cer – ceramides containing behenic acid, C24:1-Cer – ceramides containing nervonic acid, C24:0-Cer – ceramides containing lignoceric acid.
All statistically significant sphingolipids were included in later ROC analyses to determine the diagnostic potential of the sphingolipids. The threshold values were set and allowed prediction of the likelihood of ovarian cancer with specific sensitivity and specificity.
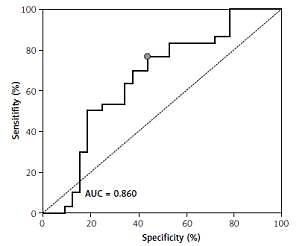
ROC showed a good discriminatory ratio for patients with moderate/severe vs. mild ovarian cancer for plasma C16-Cer (AUC = 0.86, p < 0.03), for plasma C18:1-Cer (AUC = 0.898, p = 0.02), and for RBC C18:1-Cer (AUC = 0.795, p = 0.02) (Figures 1–3).
Figure 1
ROC curve calculated for C16-Cer plasma in group of patients with serous epithelial ovarian cancer
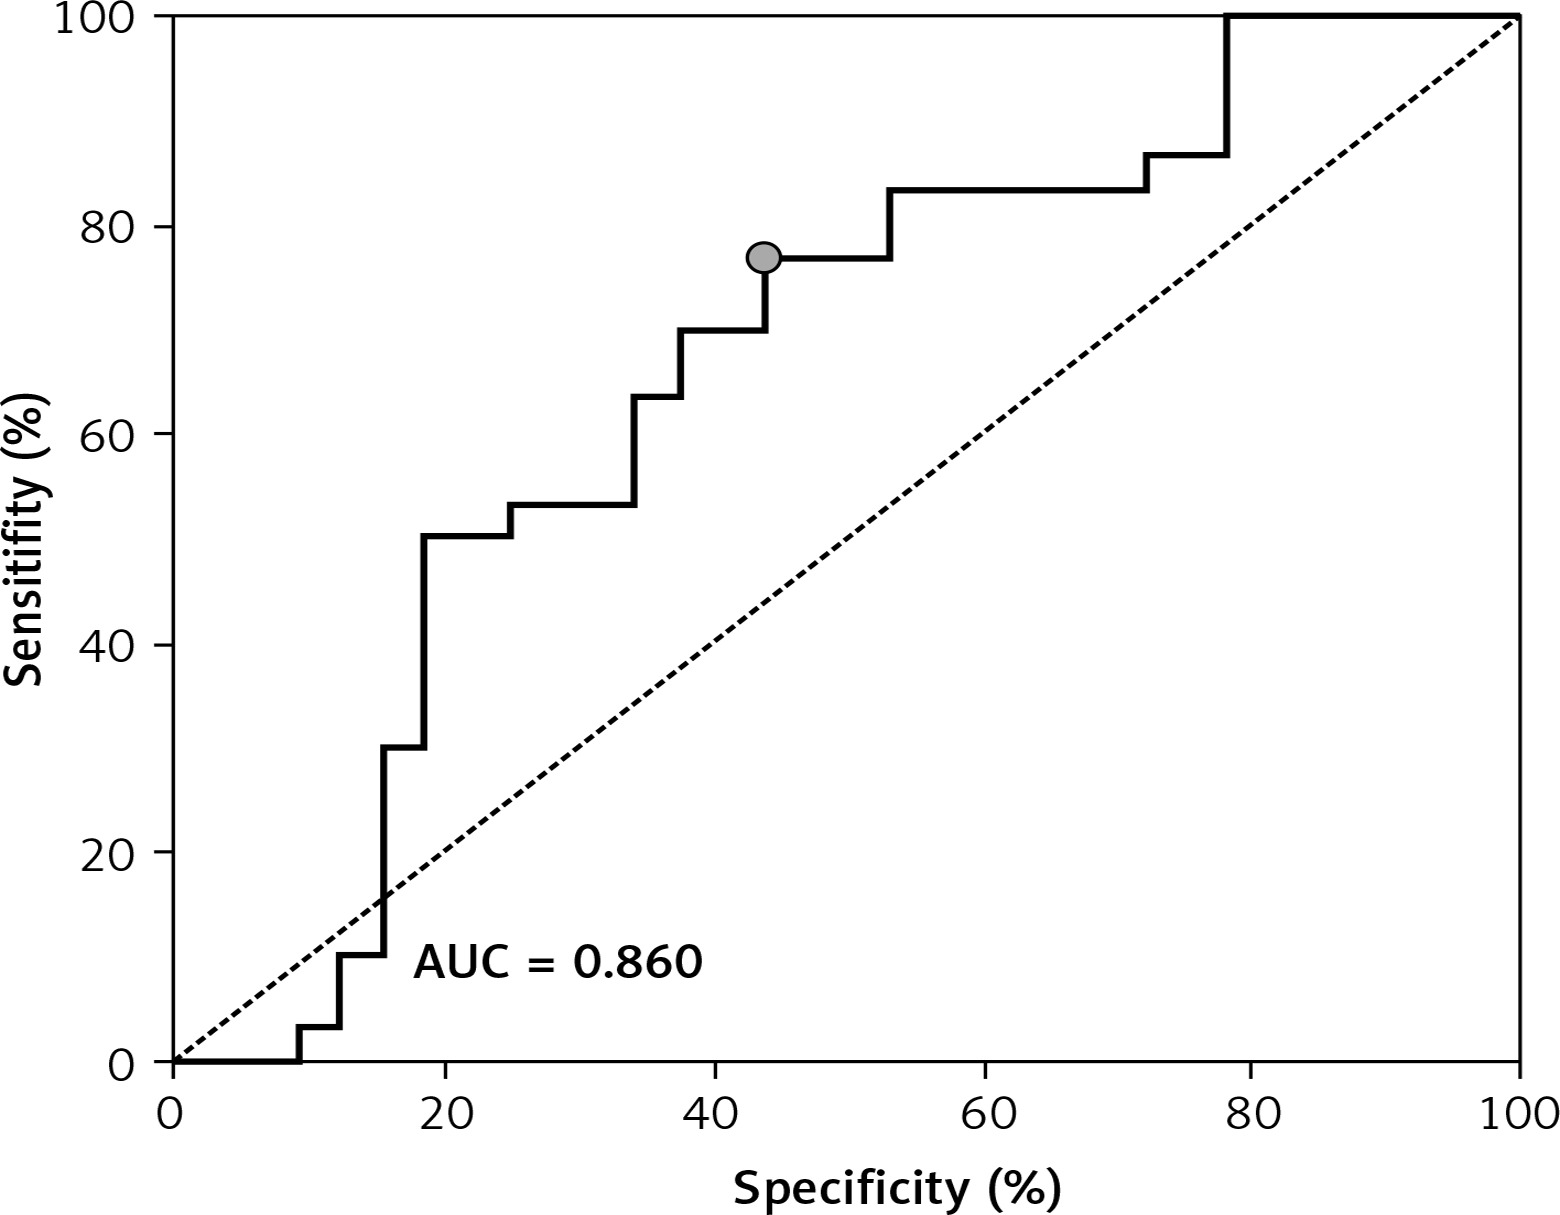
Figure 2
ROC curve calculated for C18:1-Cer plasma in group of patients with serous epithelial ovarian cancer
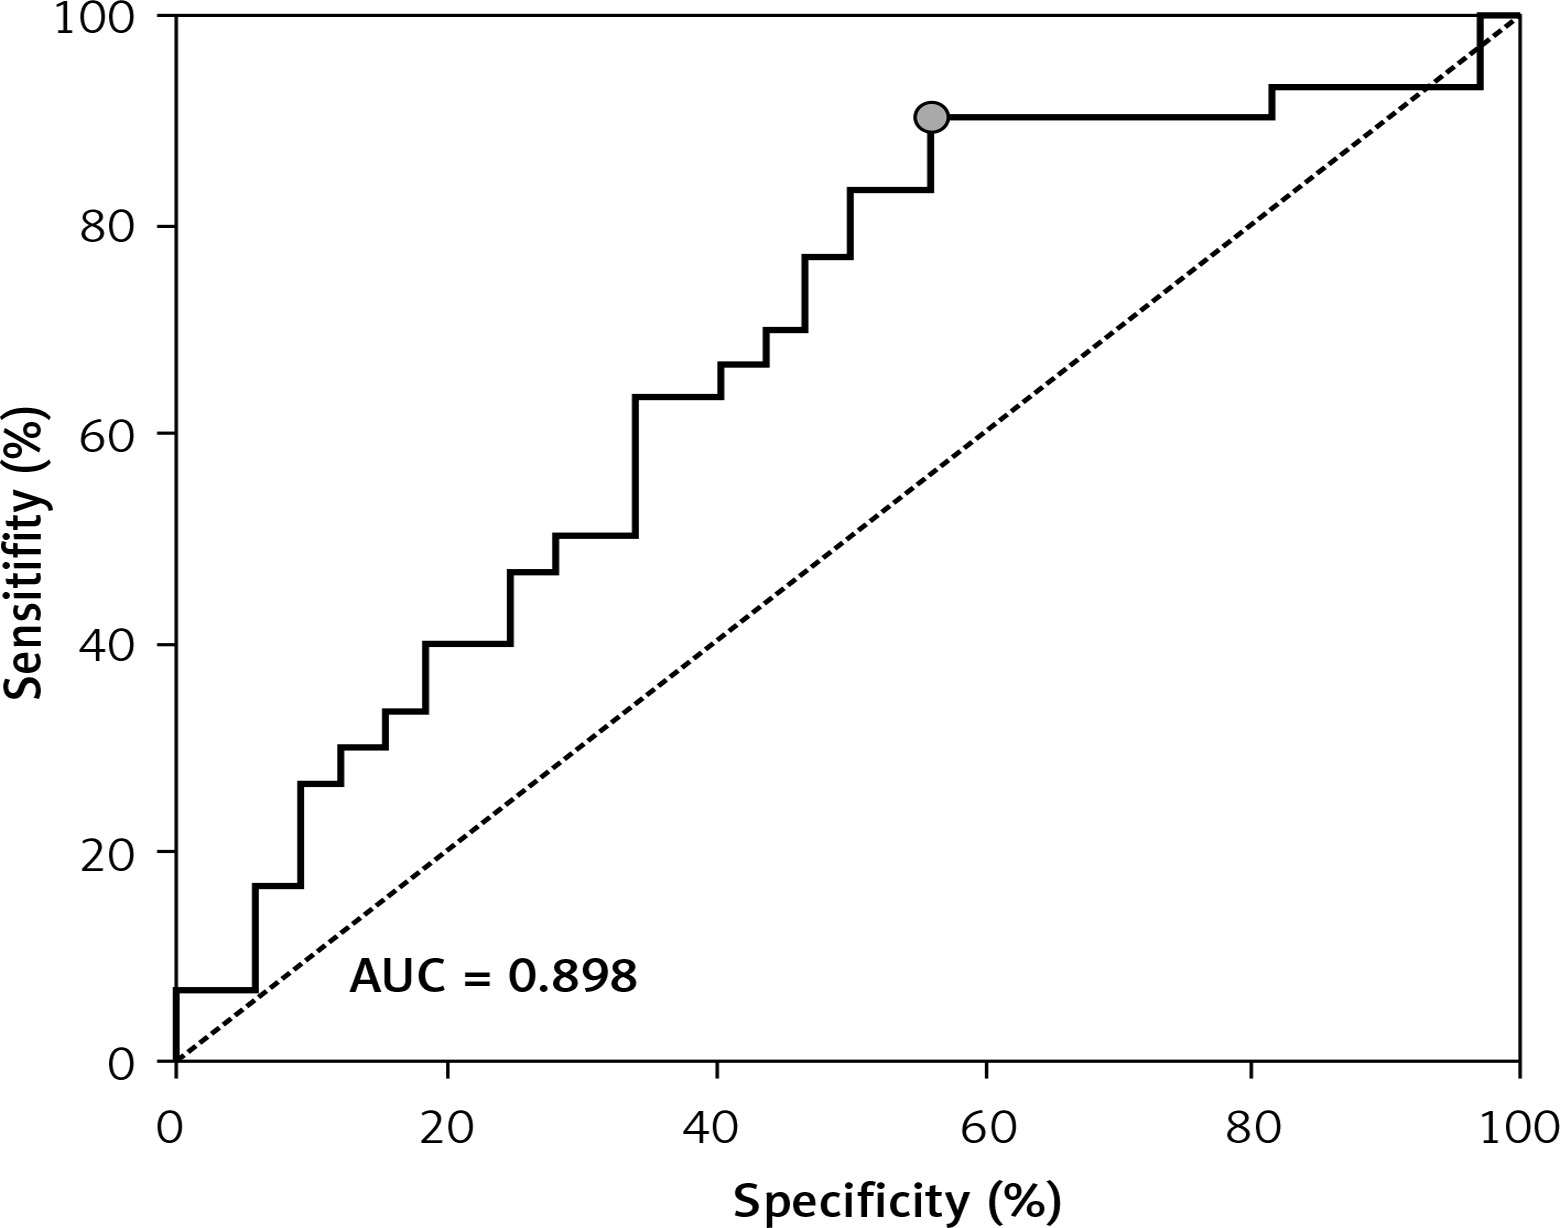
Figure 3
ROC curve calculated for C18:1-Cer RBC in group of patients with serous epithelial ovarian cancer
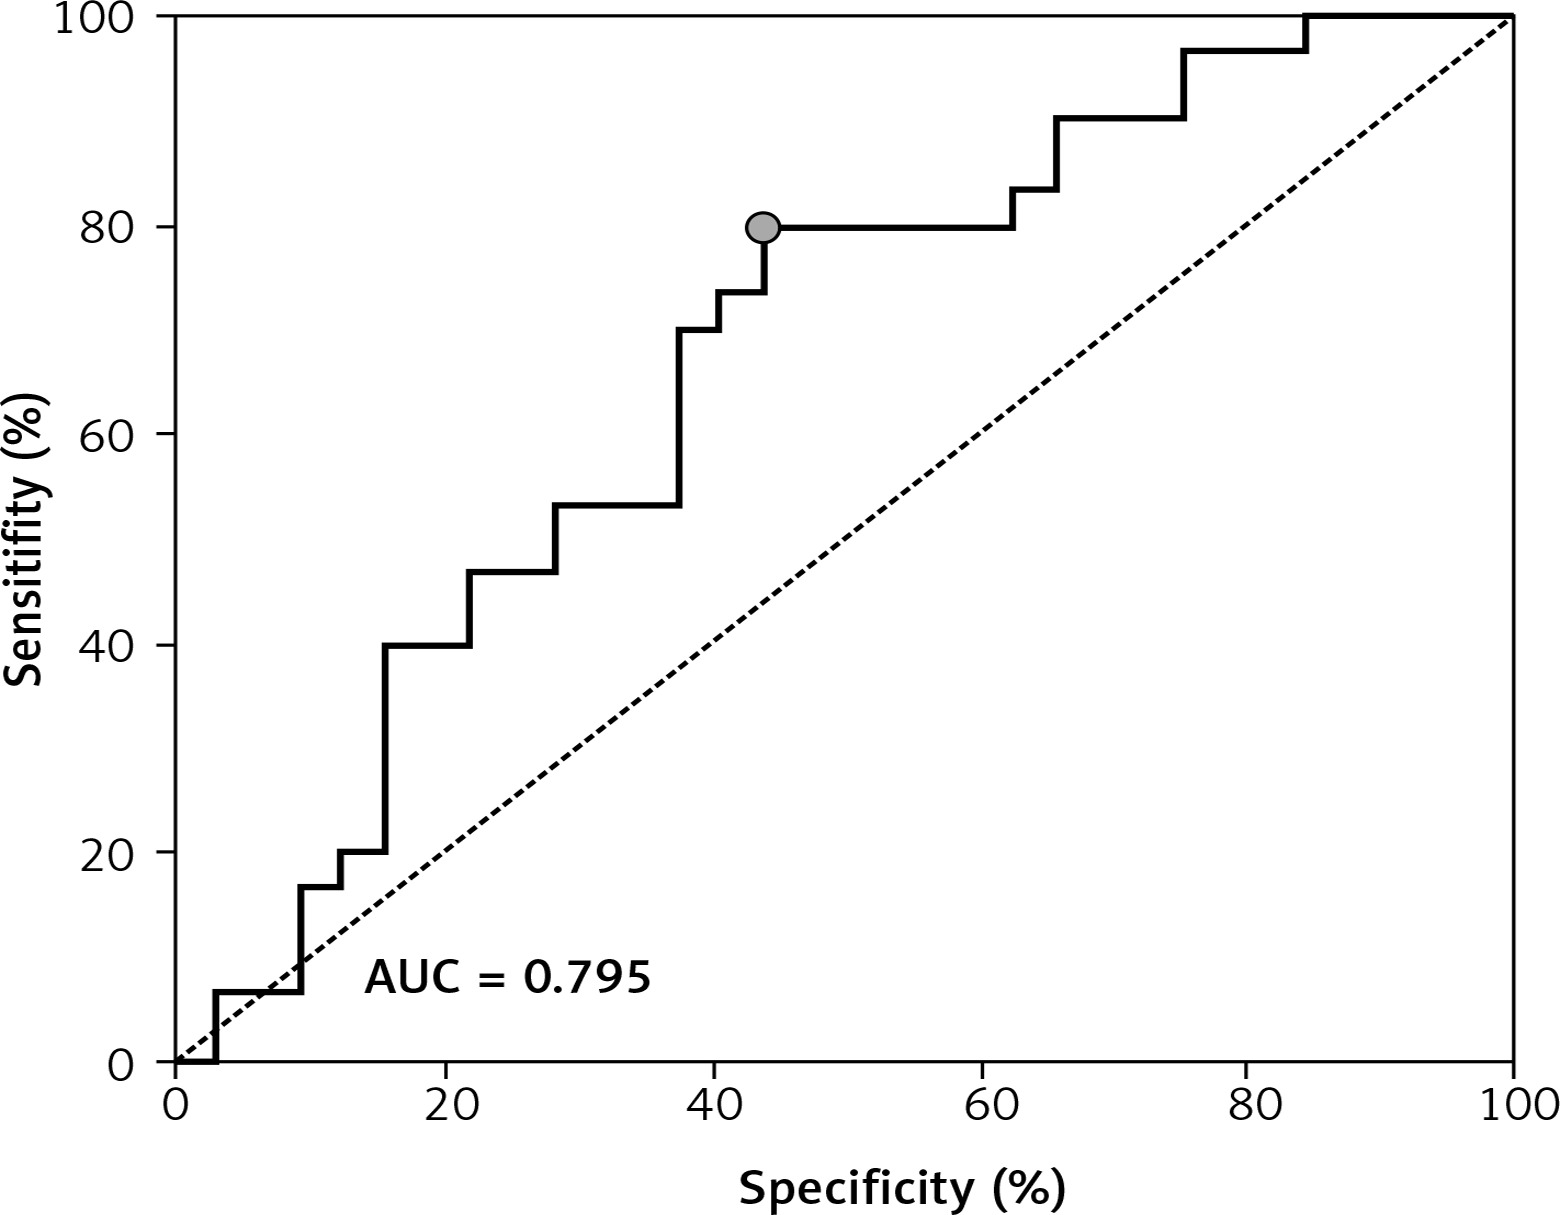
A significantly higher risk of ovarian cancer was demonstrated when the plasma concentration of C16-Cer > 315.98 ng/100 ml (sensitivity: 90%; specificity: 59%, p = 0.0279); C18:1-Cer > 4.81 ng/100 ml (sensitivity: 91%; specificity: 54%, p = 0.023) and C18-Cer > 113.26 ng/100 ml (sensitivity: 79%; specificity: 59%, p = 0.0456); RBC C18:1-Cer > 0.1 ng/100 ml (sensitivity: 90%; specificity: 49%, p = 0.0221). Diagnostic values of these sphingolipids in plasma and RBC are presented in Table IV.
Table IV
Diagnostic values of sphingolipids in patients with advanced ovarian cancer
Plasma concentrations of C16, C18.1 and C18 correlated with FIGO staging (R = 0.46, p = 0.001; R = 0.39, p = 0.024 and R = 0.61, p = 0.005, respectively) and grading (R = 0.54, p = 0.021; R = 0.43, p = 0.021 and R = 0.63, p = 0.033, respectively). Moreover, platelet S1P, C14, C16, C18, C20, C22, C24:1 and C24 concentrations significantly correlated with BMI values (R = 0.33, p = 0.009; R = 0.34, p = 0.009; R = 0.47, p = 0.0001; R = 0.39, p = 0.002; R = 0.45, p = 0.0001; R = 0.47, p = 0.0001; R = 0.45, p = 0.0001 and R = 0.46, p = 0.0001 respectively). Erythrocyte C18:1 concentrations were significantly associated with BMI values (R = –0.31, p = 0.015).
Discussion
Ovarian cancer is the main cause of mortality among female patients with genital system neoplasms [4, 5]. Two thirds of the patients are diagnosed with advanced-stage disease (mostly high-grade serous type) and despite high response rates (about 80%) from first-line treatment with surgical debulking and platinum-based chemotherapy, relapse often occurs within a few years [6]. Early detection methods of ovarian cancer are still highly unsatisfactory.
In our study ROC curve analysis showed that the single measurement of the concentration of plasma C16-Cer > 315.98 ng/100 ml, C18:1-Cer > 4.81 ng/100 ml and C18-Cer > 113.26 ng/100 ml, and RBC C18:1-Cer > 0.1 ng/100 ml differentiates patients with advanced ovarian cancer vs. the healthy group with 90% sensitivity and 59% specificity, 91% sensitivity and 54% specificity, 79% sensitivity and 59% specificity, 90% sensitivity and 49% specificity respectively. Furthermore, biopsies, as an invasive procedure, were only performed in subjects in justified cases, often when the cancer was already in development stage III/IV. From a clinical point of view a rise in levels of particular CER across cut points might suggest a specific switch into the carcinogenesis pathways. Those should accelerate a decision to do both-side adnexectomy as a prophylactic procedure in women with BRCA mutation. In that context, evaluation of plasma C16-Cer, C18:1-Cer and C18-Cer might play a crucial role in making a timely decision for surgery. Several authors state that prophylactic adnexectomy was done too late in the group of patients with mutation confirmed [22–29].
Despite the important role of sphingolipids in cancer biology, their metabolism in different malignant gynecological diseases is poorly investigated. We observed in our previous study altered sphingolipid metabolism in human endometrial cancer that likely contributed to its progression and chemoresistance [12]. There are numerous data showing involvement of sphingolipids in various pathways associated with their elevated levels (e.g. preterm labor, preeclampsia, fetal Down syndrome, myocardial infarction) [30–32]. Some of those studies reported that several diseases in humans affect metabolism of bioactive sphingolipids not only in plasma but also in erythrocytes and platelets. In RBC, it manifests with elevation in the level of S1P, SA1P, sphinganine-1-phosphate (SA1P), Sph, SPA and CER. In PLT, only the increased levels of S1P and SA1P were observed (e.g. myocardial infarction) [30]. There are also no data on the effect of changes in the concentration in the plasma sphingolipid on the level of the compounds in the enucleated blood cells.
In the present study the level of the total examined CER in erythrocytes and platelets differs from their plasma levels in patients with SAOC (plasma: 4236.4 vs. RBC: 100.1 vs. PLT: 444.1 (ng/100 μl)). Elevated concentrations of plasma CER and enzymes catalyzing the transformation to bioactive derivatives and accumulation of SPA and dihydroceramide coupled to activation of palmitoyltransferase suggest that CER are synthesized de novo. It could mean that the main source of plasma CER is ovarian cancer tissue. We found that the levels of examined sphingolipids in erythrocytes remain stable and basically unchanged in the patient and control groups. Also in platelets, the levels of analyzed CER were stable. We speculate that the stable levels of CER, SPA, Sph and S1P would indicate autonomous regulation of their metabolism in the blood cells. This is in line with Blachnio-Zabielska et al., who reported similar stable levels of described sphingolipids in RBC and PLT and reduction in the levels of Cer, Sph, SPA but not in S1P in the liver of rats treated with myriocin [22]. Similar stability of the level of CER in the blood cells was also observed in patients with multivessel coronary artery disease versus healthy volunteers. The authors concluded that the disease did not affect the content of examined sphingolipids in erythrocytes and platelets [30]. Another explanation of the unchanged level of examined sphingolipids in the blood cells in patients with SAOC could be the aggressive biological nature of ovarian cancer whereby high levels of S1P produced by the tumor promote cell proliferation and cell transformation as well as survival of abnormal cells, neoangiogenesis and inhibition of pro-apoptotic processes. Currently, researchers are searching for useful markers in the advanced diagnosis of ovarian cancer [33, 34].
Angiogenesis plays a crucial role in the tumor transformation, invasion and spread of ovarian cancer cells. There are two different mechanisms of angiogenesis [35–37]. The first one is creating a new blood vessel by splitting an existing blood vessel into separate capillaries. The second one is sprouting a new blood vessel from pre-existing capillaries. We speculate that ovarian tumor S1P (data not published) as an angiogenic growth factor activates receptors on endothelial cells present in pre-existing blood vessels. Then activated endothelial cells release S1P and proteases that destroy the basement membrane, allowing endothelial cells to proliferate into the surrounding matrix. It is likely that release of S1P from the endothelial cells is reduced in ovarian cancer with subsequent reduction in the plasma level of the compound. The plasma S1P is also dephosphorylated by different unspecific phosphatases, the activity of which could increase in ovarian cancer and thus contribute to the reduction in the plasma level of the compound (426.6 vs. 420.3 (ng/100 μl)). On the other hand, aggressive ovarian cancer cells destroy endothelial cells in advanced stages of this disease. After vascular injury, platelets are able to rapidly adhere to sites of endothelial disruption via the interaction of platelet specific glycoprotein and von Willebrand factor. Finally, activated platelets form stable aggregates through the link of integrins and fibrinogen [38]. We speculate that because of aggressive biology of ovarian cancer most of the analyzed blood cell sphingolipids are used in those processes and despite the high level of platelets total levels of sphingolipids are stable. On the other hand, there is persuasive evidence that platelets contribute to the metastatic potential of tumor cells at each phase of the metastasis.
Ovarian cancer cells can produce an excessive amount of CER, resulting in increased conversion to S1P. According to such an assumption, increased risk of ovarian cancer could be caused by shifting of the balance towards S1P through dysregulation of sphingolipid metabolism, resulting in overproduction of S1P and CER. The role of bioactive sphingolipids in the function of erythrocytes and platelets awaits recognition.
In conclusion, it seems that this is one of the few publications dealing with the role of active sphingolipids in blood cell metabolism in patients with advanced serous ovarian cancer. There is still a shortage of studies explaining the role of sphingolipids as transducers in cell signaling in the metabolism and development of ovarian cancer. In summary, measurement of CER (C16, C18.1, C18) in plasma of patients with ovarian cancer may be an important tool in the noninvasive assessment of the progression of disease. The present data show that concentrations of RBC C16-Cer, C18:1-Cer, C18:1-Cer could discriminate moderate/severe vs. mild ovarian cancer with high sensitivity and specificity patients with ovarian cancer. Plasma concentration of CER could be an important markers in ovarian cancer diagnostics and patients’ selection for surgical and chemotherapy treatment. Confirmation of these conclusions requires further investigation of sphingolipids in ovarian cancer.