

Introduction
Hydrocephalus is a common disorder of the central nervous system (CNS) in the pediatric population. Surgical treatment options involve ventriculoperitoneal shunt (VPS) placement. VPS infection is the most common complication of surgically treated hydrocephalus in pediatric patients [1, 2], which may lead to neuronal damage. Myelin basic protein (MBP) has been proposed as a marker of neuronal injury in a variety of contexts, and MBP levels in the cerebrospinal fluid (CSF) may be used to assess the severity of neuronal damage [1, 3, 4].
Hydrocephalus is a condition characterized by a dynamic imbalance between the formation (production) and absorption of cerebrospinal fluid (CSF) that results in an increase in the size of fluid cavities within the brain and, in some situations, in an expansion of the spaces outside the brain, with or without an increase in the size of the ventricles [5, 6]. The treatment of hydrocephalus is surgical [5]. Ventriculoperitoneal shunt (VPS) implantation is the method of choice, still considered as the golden standard [3]. Only in cases where an obstacle in the CSF evacuation pathways is present (noncommunicating hydrocephalus), neuroendoscopic procedures like third ventricle ventriculostomy (ETV) are preferred [5]. Depending on the source, VPS infection is estimated to occur in 3-20% of cases, usually within the first 3 months after implantation [7]. The most common etiological factor of CNS infection is Staphylococcus epidermidis, occurring in about 85% of cases. In the course of VPS infection, biofilm is formed on its surface, modifying the interaction between the host and the infectious factor. It is also responsible for the immunological reaction and protects the pathogen from the immune system. The standard procedure in such cases involves removal of infected VPS, implantation of external ventricular drainage (EVD) or Rickham reservoir, and targeted antibiotic therapy [2, 8, 9]. Myelin basic protein is essential for normal myelination and axonal conduction. It mediates adhesion between cytoplasmatic surfaces of individual myelin layers [10, 11]. This protein is a known marker of blood - brain barrier (BBB) disruption and indicator of brain damage [10-13]. MBP may also be considered as a marker for monitoring the severity of white matter destruction, especially in patients with hydrocephalus [9, 11, 14, 15].It is more characteristic of CNS destruction than of immunological response [15]. MBP can act as neuronal damage biomarker [16]. CNS infection can be related to MBP level as a marker of brain damage, expressed as demyelination and destruction of oligoastrocytes [4,17]. It has been used in the assessment of traumatic brain injury in children [4, 18]. Based on the animal model described by Perera, it is known that MBP can correlate with immune response to infection [11, 19]. MBP can be a marker of many pathological states, such as infection caused by Mycobacterium leprae [20],viral infection in multiple sclerosis (MS) [21], and peripheral nerve autoimmune reaction in Chagas disease [22]. The immunological process accompanying bacterial encephalomeningitis and leading to white matter destruction has been described in the literature on CNS infection caused by Streptococcus pneumoniae, Haemophilus influenzae, and Neisseria meningitidis. The invading pathogen induced a reaction of various brain cells, which act as innate CNS immune system (astrocytes, microglia, endothelial cells, epithelial cells, resident macrophages). Recognition of the invading microorganisms by the CNS resident immunological system leads to a release of early response inflammatory cytokines (including IL-6). Recruited neutrophils and monocytes eliminate pathogens via reactive molecules. These cells are also capable of releasing cytokines, e.g. IL-6. Apart from the destruction of the offending pathogen, these molecules can be responsible for brain damage. In addition, matrix metalloproteinases produced by leucocytes in the course of an immunological reaction may also contribute to white matter demyelination. Therefore it can be expected to observe increased levels of MBP in the context of an inflammatory process. The destruction of the invading pathogen could also intensify the immunological reaction, thus increasing the level of MBP in CSF [23, 24]. To our knowledge however, none of the publications pertains to VPS infection. We decided to evaluate the levels of MBP associated with VPS infection during the whole neurosurgical treatment of pediatric patients. The principal aim of the article was to assess brain damage connected with ventriculitis in the context of VPS infection [25]. In addition, we wanted to evaluate the dynamics of encephalitis secondary to VPS shunt infections caused by S. epidermidis [26].
Material and methods
The study group included children with congenital hydrocephalus. Patients were hospitalized because of primary VPS infection. In all cases, the etiological factor was Staphylococcus epidermidis. Infections caused by other factors were excluded from the study. The material includes 30 pediatric patients, successively admitted and operated in the Polish Mother’s Memorial Hospital Research Institute (PMMHRI) between 2010 and 2014.In all cases, VPS was removed (including intraventricular and peritoneal catheter) and external ventricular drainage EVD implanted. The intraventricular catheter was exchanged to eliminate the biofilm. The first CSF sample (measurement I) was taken at diagnosis (clinical symptoms of VPS malfunction and positive CSF culture). Adequate antibiotic therapy was implemented according to the antibiogram. After receiving the first sterile CSF culture, two additional samples were taken to obtain three sterile samples of CSF culture. To assess bacterial growth from a sample, specimens were drawn for culture on average once a week. Therefore, the time between the first and the second measurement depended on the results of microbiological examination of CSF samples. When the condition of three sterile CSF cultures was fulfilled, the second CSF sample was taken (measurement II). Patients were eligible for VPS reimplantation when CSF protein level was ≤ 100mg% and pleocytosis did not exceeded 100 cc/µl.If these criteria were not fulfilled, the CSF was re-examined once a week, until satisfactory results were obtained. The third CSF sample was taken during the surgical procedure (measurement III). For safety reasons, during each procedure, only 5 mL of CSF was taken from the ventricular system. All CSF specimens were stored at –80°C. All CSF samples were frozen immediately in order to preserve stability. Before analysis, samples were heated to –20°C and then to room temperature. The CSF was centrifuged at 2,000 rpm for 10 min to eliminate cellular components and 2.0 ml of supernatant were removed. The following quantitative assessments were performed using the ELISA method. Ready-made standardized sets made by R&D Systems, Inc.; 614 McKinley Place NE; Minneapolis, MN 55413, USA (enzyme immunoassay) were used. Absorbance reading of the test samples was performed using a microplate DS2 Dynex Technologies, Inc., USA reader. This test is performed using cell culture supernatants as this method of evaluation is more sensitive compared to the tests using blood serum. Physiological saline was used as the negative control. Absorbance values for each sample were read at a wavelength of 450 nm. Concentration values of the test samples were calculated automatically from the standard curve. Assessments in the following material were made, and the sensitivity of the test, i.e. the minimal detectable concentration was 0.20-0.31 ng/ml. The control group included 30 pediatric patients who underwent first-time VPS implantation (measurement-control). Patients with hydrocephalus due to inflammation, hemorrhage, or tumor were excluded from the group. Similarly, excluded were all patients eligible for treatment by neuroendoscopic techniques at any time of therapy. In the study group, parameters such as MBP, IL-6 levels, pleocytosis, and protein values obtained during the subsequent measurements were compared using variance analysis. Bonferroni post hoc analysis was used to verify significant differences between measurements. Parameters in the study group obtained in each of three measurements (measurement I, measurement II, and measurement III) were compared to corresponding parameters in the control group. In this case, Friedmann test was used (post-hoc Wilcoxon test with Bonferroni correction for the number of comparisons). Normal distribution of measured parameters was checked using the Kolmogorov-Smirnov test with Lilliefors correction. The homogeneity of variances was tested with the Mauchly test. If variances were not homogeneous, the Greenhouse-Geisser correction was used. As the level of statistical significance, p< 0.05 was used. For the whole statistical analysis, SPSS 17.0 software was applied. This research was funded by the National Science Centre programme No. N N403 242440. It was approved by the Ethical Committee of the Polish Mother’s Memorial Hospital Research Centre.
Results
The study involved 30 pediatric patients (16 male and 14 female, gender ratio M : F = 1.14 : 1). The average age of patients was 8.4 months (standard deviation [SD] ±5.8 months). The control group included 30 pediatric patients who underwent first-time VPS implantation (measurement-control). It consisted of 17 male and 14 female patients (gender ratio M:F = 1.21:1). The average age of patients was 1.2 months, SD ±0.3. The first sample of CSF (measurement I) was taken at diagnosis (clinical symptoms of VPS malfunction and positive CSF culture). The mean level of MBP was 2.63 ng/ml, SD ±12.8 ng/ml, and the median value 0.01 ng/ml. It was significantly lower (p = 0.003) compared to the MBP levels in the control group, where the mean value was 2.63 ng/ml, SD ±4.56 ng/ml, and median 0.52ng/ml (Fig. 1, Tables 1 and 2). After identification of the etiological factor, which in all cases was Staphylococcus epidermidis, removal of VPS and the implantation of EVD was performed. Proper targeted antibiotic therapy was implemented. In all cases,it was 5 mg of vancomycin intraventricular every 24 h. The mean duration of antibiotic therapy was 20.2 days, SD ±7.9 days. When condition of three sterile CSF cultures was fulfilled, the second CSF sample was taken - measurement II. Median MBP concentration at the second measurement was 1.60 ng/ml, whereas the mean level was 49.48 ng/ml,SD ±237.73 ng/ml (Fig. 1, Tables 1 and 2). In all CSF samples, MBP levels were significantly elevated in comparison to the first measurement, and this was true also for the control group. But there was no statistically significant difference sample from the second measurement in comparison to the control group (p = 0.246) (Fig. 1, Tables 1 and 2), and at this time, antibiotic therapy was maintained. From this point, in all cases, we waited until the time of the normalization of protein and pleocytosis values. It took on average 23.8 days, SD ±5.27 days. Once the conditions were fulfilled, the implantation of new VPS was performed. The third CSF sample was taken during surgical procedure – measurement III. At the time of VPS, implantation the average level of MBP in CSF was 4.55 ng/ml, SD ±7.19 ng/ml,and median 1.83 ng/ml (Fig. 1, Tables 1 and 2). It was higher than in the first measurement (p = 0.002) and in the control group (p = 0.036) (Fig. 1, Tables 1 and 2). Average CSF MBP level in control group was 2.63 ng/ml, SD ±4.56 ng/ml, and median 0.52 ng/ml (Fig. 1, Tables 1 and 2). Levels were higher than in the first (p = 0.003) and lower in the third measurement (p = 0.036) of the study group (Fig. 1).
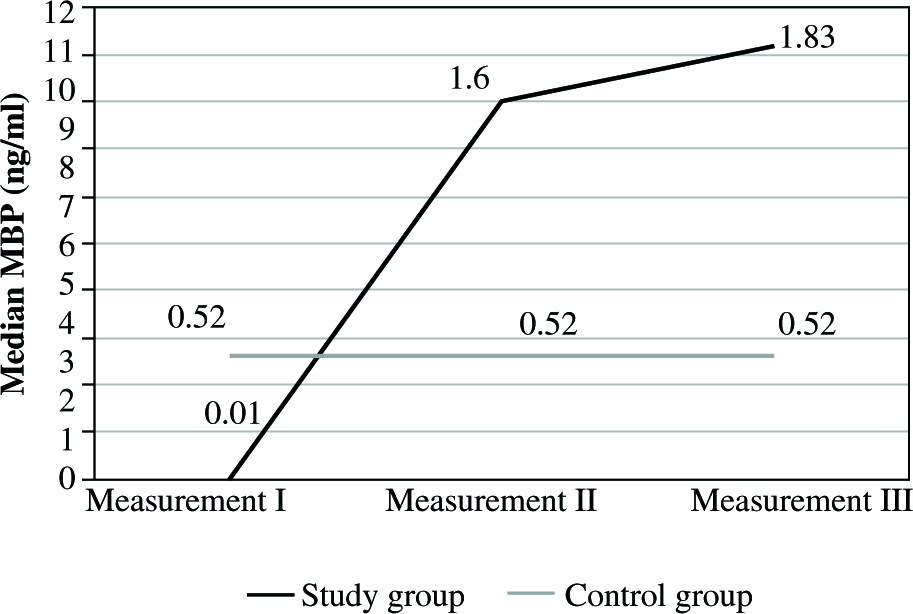
Table 1
Diversity of specific parameters in each measurement
Table 2
MBP, IL-6, protein, and pleocytosis individual distribution data
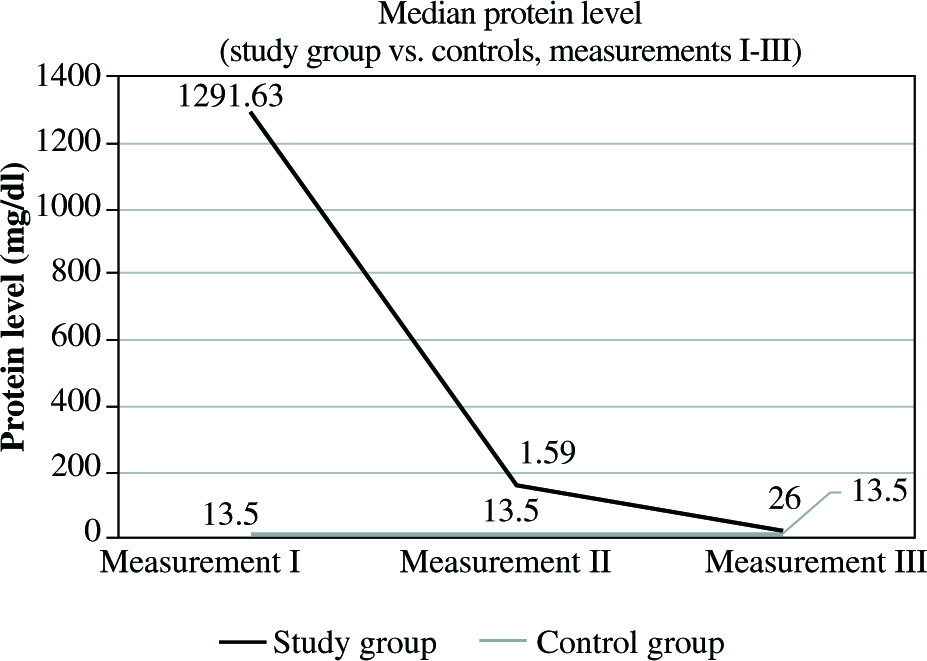
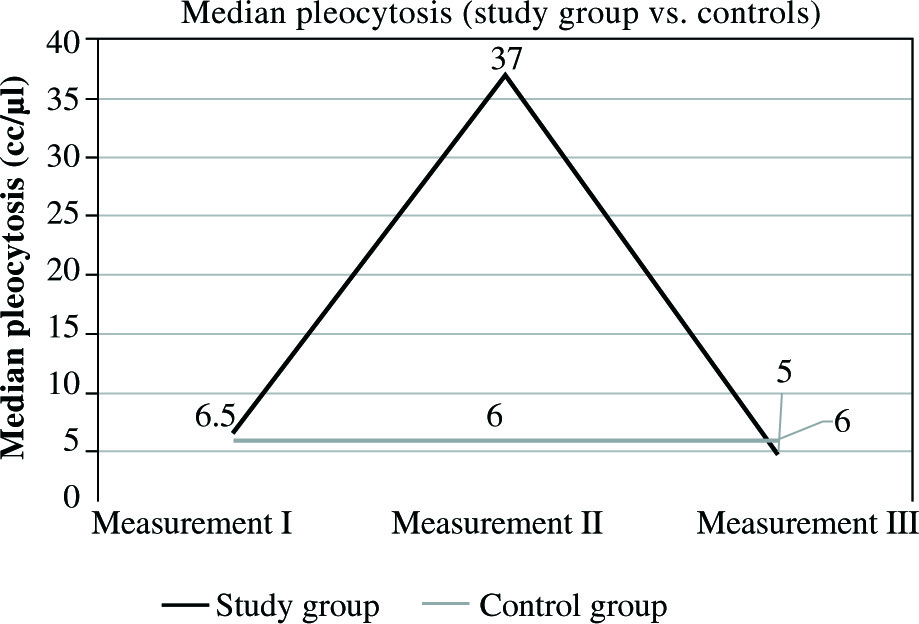
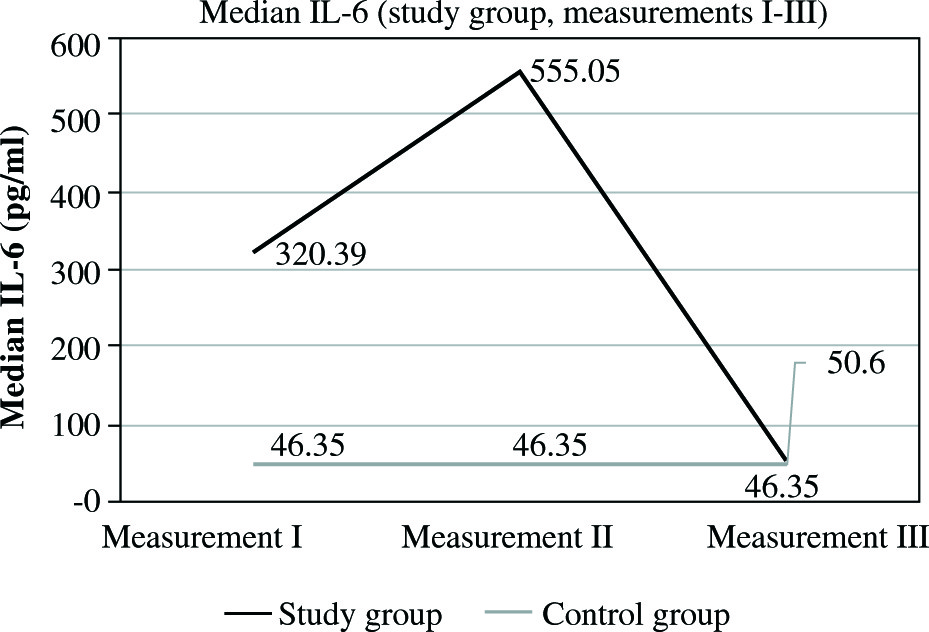
In the study group, the mean protein level at this time was 1291.63 mg/dl, SD ±497.80 mg/dl, and median 1291.63 mg/dl. The levels were significantly higher than in all other measurements (measurement II and III, p< 0.001) in analyzed group. It was also significantly higher than in the control group, where the mean CSF protein value was 17.47 mg/dl, SD ±9.24 mg/dl, and median 13.50 mg/dl (Fig. 2, Tables 1 and 2). In the second measurement, mean protein concentration was 179.83 mg/dl, SD ±83.12 mg/dl, with median 159 mg/dl. These values were lower compared to those obtained in the first measurement, and higher than those in the third measurement. In both cases, p< 0.001 (Fig. 2, Tables 1 and 2). The CSF protein values in the third measurement included mean 35.30 mg/dl, SD ±25.20 mg/dl, and median 26 mg/dl. They remained higher than the corresponding values in the control group (p = 0.013) (Fig. 2, Tables 1 and 2). In the control group, mean protein levels were 17.47 mg/dl, SD ±9.24 mg/dl, and median 13.50 mg/dl. The results obtained for pleocytosis followed a different pattern. In the first measurement, the mean pleocytosis level was 7.90 cc/µl, SD ±7.8 cc/µl, and median 6.50 cc/µl. Similar values were obtained in the control group (p = 0.953). The highest pleocytosis value was found in the second measurement. The mean value was 106.03 cc/µl, SD ±145.21 cc/µl, and median 37 cc/µl (Fig. 3, Tables 1 and 2). At that time, none of the 30 patients in the study group was eligible for VPS reimplantation because of elevated protein and pleocytosis. Pleocytosis levels in CSF of patients in the study group were significantly higher in comparison to controls (p = 0.001). In the third measurement, the mean pleocytosis level was 13.10 cc/µl, SD ±19.53 cc/µl, median 5 cc/µl (Fig. 3, Tables 1 and 2), comparable to the values in the control group(p = 0.953) (Fig. 3, Tables 1 and 2). In the control group, the pleocytosis level was 7.83 cc/µl, SD ±6.81 cc/µl, and median 6 cc/µl (Fig. 3, Tables 1 and 2). The intensity of the inflammatory process initiated by bacterial invasion was measured using CSF levels of IL-6. The results were higher than those in the control group from the first measurement (median 320.39 pg/ml, mean 393.98 pg/ml, SD ±296.92 pg/ml) (Fig. 4, Tables 1 and 2). The peak value of IL-6 was noted in the second measurement, with median 555.05 pg/ml and mean value of 8107.09 pg/ml, SD ±21809.43 pg/ml (Fig. 4, Tables 1 and 2). In the third measurement, there was no statistically significant difference between the study group and controls. In study subjects, the median level of IL-6 was 50.60 pg/ml, mean 101.14 pg/ml, and SD ±131.36 pg/ml (Fig. 4, Tables 1 and 2). In the control group, mean IL-6 value was 48.41 pg/ml, SD ±11.81, and median 46.35 pg/ml (Fig. 4, Tables 1 and 2). In the second measurement between MBP and IL-6, a strong positive correlation was observed (correlation index, 0.7350; p< 0.05). Furthermore, in the same measurement, a positive correlation between MBP and pleocytosis was noted (correlation index: 0.1291, p< 0.05). No quantitative relationship was found between MBP and protein level in CSF (correlation index, 0.0094; p< 0.05).
Fig. 2
Comparison of median CSF protein in the study group vs. controls in three consecutive measurements
Discussion
Myelin basic protein is considered to be one of the markers of BBB disruption. It is an indicator of brain damage. MBP may also be considered as a marker for monitoring of the severity of white matter destruction, especially in patients with hydrocephalus [9, 11, 15]. Most publications concern adult patients (particularly patients with multiple sclerosis [MS]), a few are dedicated to the pediatric population, and none to CSF inflammation [13-15, 23, 24, 27]. In healthy children, mean MBP concentration should be 0.11 ng/ml ± 0.01 ng/ml [17,22]. Elevated MBP levels are observed in all cases of elevated intracranial pressure (ICP). During VPS infection, mechanical malfunction of the device is observed, leading to insufficient CSF drainage from the ventricular system. In this context, the ventricles are usually enlarged. High MBP levels due to increased ICP can explain higher MBP levels in the control group in comparison to the first measurement in the study group[4, 11]. In the first measurement, despite elevated ICP, MBP values were not increased in comparison to the control group. A possible explanation could be that the assessment was made at the initial stage of inflammation and CNS destruction, and that the ensuing elevation of MBP level could be detected later [4, 24]. Perhaps in the study group, the clinical manifestations of CNS infection prevailed over those of shunt dysfunction. This can be associated with an early stage of the pathological process. According to the literature on S. aureus infection, the recruitment of leucocytes and macrophages occurred within 4-9 days after the invasion [24]. In the study group, a period of about 20 days following the start of antibiotic therapy was necessary to achieve bacterial inactivation. This period would be sufficient for the detection of CNS damage. The control group was composed of children with active congenital hydrocephalus and accompanying increased intracranial pressure (ICP); according to the literature, this could explain a relatively high level of MBP [4]. A significantly increased MBP level was observed in the second control CSF sample (measurement II), despite the absence of ICP elevation at that time. Usually, elevated MBP levels follow a destructive process in the CNS [27]. Possible causes of increased MBP in the second measurement could include the release of meta-allomatrix proteinase, which has been described in the context of other encephalomeningitis [14, 24]. It is consistent with a statistically significant increase of proinflammatory cytokines such as IL-6, which is released not only by cells of the innate CNS immune system like microglia, but also by leucocytes and monocytes from peripheral blood [14, 24, 26]. The induction of microglia could be associated with brain injury via proinflammatory cytokines [24]. Increased pleocytosis reflects BBB disruption with high levels of MBP in CSF. Another explanation is that high MBP level can be connected with intrathecally administered vancomycin [28]. It should be emphasized that intraventricular administration of vancomycin should be individualized due to potential risk of neurotoxicity [28, 29]. At that time, all our 30 patients from the study group were not eligible for VPS reimplantation because of elevated protein and pleocytosis. Elevated CSF MBP levels can explain the migration of peripheral cells to the CNS via the BBB break [14, 30]. Brain injury can be connected with an immunological reaction to bacterial infection, but vancomycin toxicity cannot be excluded. The 5 mg vancomycin dosage administered intrathecally is fully accepted [31]. Unfortunately, little is known at present about brain injury associated with vancomycin treatment [32]. The third CSF sample was taken during the surgical procedure of VPS reimplantation (measurement III). MBP levels were comparable to those in the second measurement, but were still higher than in the control group. Su et al. first discovered that CSF MBP concentration was elevated in children after severe traumatic brain injury. This occurred immediately after injury and remained elevated for 5 days. During that period, no overlap between clinical status and health parameters was observed [27]. Additionally, it was noticed in a group of preterm neonates with intracranial hemorrhage [33]. It explains elevated MBP level in the control group due to intraventricular catheter insertion and ICP elevation before VPS implantation [1, 11]. MBP is considered a marker of brain damage and is thought to be useful for monitoring the severity of injury to the white matter in patients with hydrocephalus. MBP plays an important role in CSF immune reaction. In an experimental model, D’Aversa et al. demonstrated that MBP induces mediators from primary endothelial cells. BBB disruption caused by MBP increases its permeability correlated with the induction of inflammatory markers [30, 34]. Perera proved in animal models that MBP stimulates infiltration of T-cells, MHC class II expression, and microglia activation in the spinal cord [19]. VPS infection can be treated successfully provided that the intraventricular catheter with bacterial biofilm on its surface is removed [2, 7, 8]. In our material, the etiological factor did not influence the MBP level. Elevated MBP level still occurred 20 days after VPS removal, when a sterile culture of CSF was collected. It is correlated with high pleocytosis. Even after normalization of protein levels and pleocytosis, MBP concentration was higher than in the control group. Moreover, the level of IL-6 also decreased at that time. This finding invalidates the role of MBP as marker of active immune reaction in the CNS. High elevation of the protein level was observed in the first measurement and slight elevation in the second measurement. It is considered a positive marker of proper antibiotic therapy. Changes in MBP concentration can be related to its immunomodulatory capabilities. Roy et al. showed that MBP inhibits the inflammatory response. In vitro studies proved that MBP-primed Th2 cell dose inhibited the production of interleukin-1β (IL-1β) and nitric oxide (NO) in microglia via cell-to-cell contact [35]. It explains the decrease in the protein level and pleocytosis. Increased MBP level can be related to neurotoxicity of intrathecal vancomycin. Monitoring of MBP levels following termination of vancomycin therapy could be beneficial.
Conclusions
1. Normalization of MBP levels in the CSF of children with VPS infection takes longer than the normalization of protein levels and pleocytosis.
2. The highest CSF MBP level detected in measurement III (at VPS reimplantation) is not connected with increased ICP. This might represent a reaction to vancomycin neurotoxicity.
3. The inflammatory process induced by the invading microorganism could be a contributing factor in the elevation of CSF MBP correlated with increased levels of IL-6 in the second measurement.