Introduction
In developed countries cancer and cardiovascular (CV) diseases represent the most frequent causes of death. In Poland, according to the National Register of Cancers, in 2013 the most frequent malignant tumours according to morbidity and mortality were as follows: lung cancer, breast cancer, and tumours of the digestive and urogenital systems [1]. Chemotherapy is included in the standard therapeutic regimen methods in those types of cancer and has been shown to improve survival in patients who were approved for chemotherapy and received it accordingly. The comorbidities such as previous CV disease, arterial hypertension, or diabetes mellitus may often influence the choice of treatment, the aggressiveness of therapy, and thus the success of treatment. On the other hand, in the future many patients may experience CV complications related to the regimen and recognised as long-term adverse effects of the chemotherapeutic drugs. Left ventricular dysfunction caused by antineoplastic therapy is known as cancer therapeutics-related cardiac dysfunction (CTRCD) and is defined as an absolute decrease in the left ventricular ejection fraction (LVEF) by > 10 percentage points, to a value below the lower limit of normal [2]. Although a few algorithms have been proposed to assess CV risk in oncological patients, none has been validated prospectively nor gained wide clinical acceptance [2].
Even though CV screening may preclude using certain management regimens in high-risk patients, especially with severe pre-existing CV disease, the risk in the remainder may vary. The aim of the study was to evaluate the prevalence of classical CV risk factors among patients with a diagnosis of de novo cancer prior to chemotherapy. We would like to assess a suitability SCORE algorithm in that respect in a cohort of patients with various types of cancer.
Material and methods
Study population
This study is part of the multicentre, observational, prospective program ONCOECHO, which was conducted between 2012 and 2014 in reference CV units. The main aim of the study was to investigate the CV consequences, especially CTRCD, of systemic treatment (chemotherapy or targeted therapy) applied during the treatment of lymphoma (DLBCL), chronic myeloid leukaemia (CML), breast cancer, kidney cancer or colorectal cancer, and other kind of cancers. The kidney cancer sub-group consisted of only 15 persons (4.4%; 4 women and 11 men), colorectal carcinoma of 25 patients (7.3%; 12 women and 13 men), haematological malignancies (HM) of 91 patients (26.5%; 46 women and 46 men), and the largest sub-group (61.8%) of 212 women with breast cancer. Table I presents the stage of tumours in each of the study groups.
Table I
The stage of tumours in the study groups
We analysed the data of all consecutive patients screened prior to proposed systemic treatment for the mentioned cancer types at first diagnosis. Patients were excluded if they had the following: ejection fraction at baseline (EF) < 55%; regional left ventricular (LV) wall motion abnormalities at rest; thickness of the wall of the left ventricle > 13 mm corresponding with LV hypertrophy, moderate or severe valvular heart disease, or were treated in the past with anthracyclines or radiotherapy.
The study was approved by local Ethical Committees, and all patients provided written informed consent.
Study protocol
Standardised history and physical examination were obtained in patients included in the study, with special attention paid to oncological data and cardiac history with comorbidities and concomitant medications. Blood pressure, heart rate, height, and weight were measured. We calculated body mass index (BMI) based on measured weight in kilograms divided by squared height in metres. Overweight was defined as a BMI of 25 to 29.9 kg/m<sup>2</sup>; and obesity as BMI more than 30 kg/m<sup>2</sup>.Glomerular filtration rate (GFR) was calculated according to the Cockcroft-Gault’s formula. Standard 12-lead resting electrocardiogram was performed to assess heart rate and rhythm, QT interval duration, presence of arrhythmia or conduction disorders, as well as ST segment and T wave abnormalities. The study protocol has been described in detail in the recently published colon cancer ONCOECHO population [3]. Standard blood sampling included the following: blood morphology, lipidogram, serum fasting glucose level, concentration of serum creatinine (GFR), and the N-terminal pro-B-type natriuretic peptide (Nt-proBNP) or B-type natriuretic peptide (BNP) concentration. All patients underwent transthoracic echocardiography to assess the systolic and diastolic LV function, size and function of the right ventricle, valvular status, and presence of pericardial fluid.
Based on the collected data, we evaluated CV risk defined as the probability of CV death within the following 10 years using the SCORE algorithm. The risk was estimated according to the SCORE value: low (< 1%), moderate (1 – less than 5%), high (5 – less than 10%), or very high (equal to or exceeding 10%).
Finally, we compared the prevalence estimates with data of the Polish adult population available from the epidemiologic NATPOL 2011 study, including sex and age ranges [4].
Statistical analysis
The distribution of all variables was verified with the Kolmogorov-Smirnov test. Despite the variety of tumours, all data were distributed normally. The continuous variables, presented as the mean ± standard deviation, were compared between groups by t test or analysis of variance, as appropriate. The categorical variables are presented as n (%) and were compared between groups by χ2 test. A univariate analysis of variance was performed to check the association between type of cancer and age, CV risk estimated by SCORE points and also between SCORE and NT-proBNP/BNP, GFR, or type of carcinoma. If the result of the analysis of variance was significant then post-hoc comparisons of more than two groups were performed. All of the above calculations were performed using a licensed copy of SPSS 15 and MedCalc. P-value of 0.05 was considered statistically significant.
Results
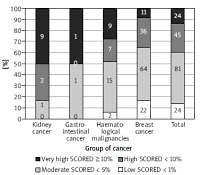
A total of 343 consecutive patients (mean age: 55.5 ±12.8 years), 78.7% (270) of whom were females, were included in the study. We found a difference between sub-groups regarding age: breast cancer patients were significantly younger than patients with colorectal cancer (Δ = 7.5 ± 2.7 years; p = 0.026) – Figure 1. The analysis of differences between sub-groups is shown in Tables II and III. Due to the multicentre study design, the full datasets were not available for all patients, especially with regard to cholesterol, Nt-proBNP, or BNP, and therefore SCORE results were not calculated for all pts. At baseline 117 patients (34.4%) were taking angiotensin-converting enzyme inhibitors, 46 (13.5%) diuretics, 56 (19%) statins, 16 (5.4%) acetylsalicylic acid, 17 (5.8%) oral hypoglycaemic drugs, and 4 (1.4%) insulin. Only 52% were free of all the mentioned preventive medications. Acetylsalicylic acid was applied according previous European guidelines for prevention [5].
Table II
Baseline characteristic of the study population
Table III
Laboratory data from blood samples obtained at baseline in the study population
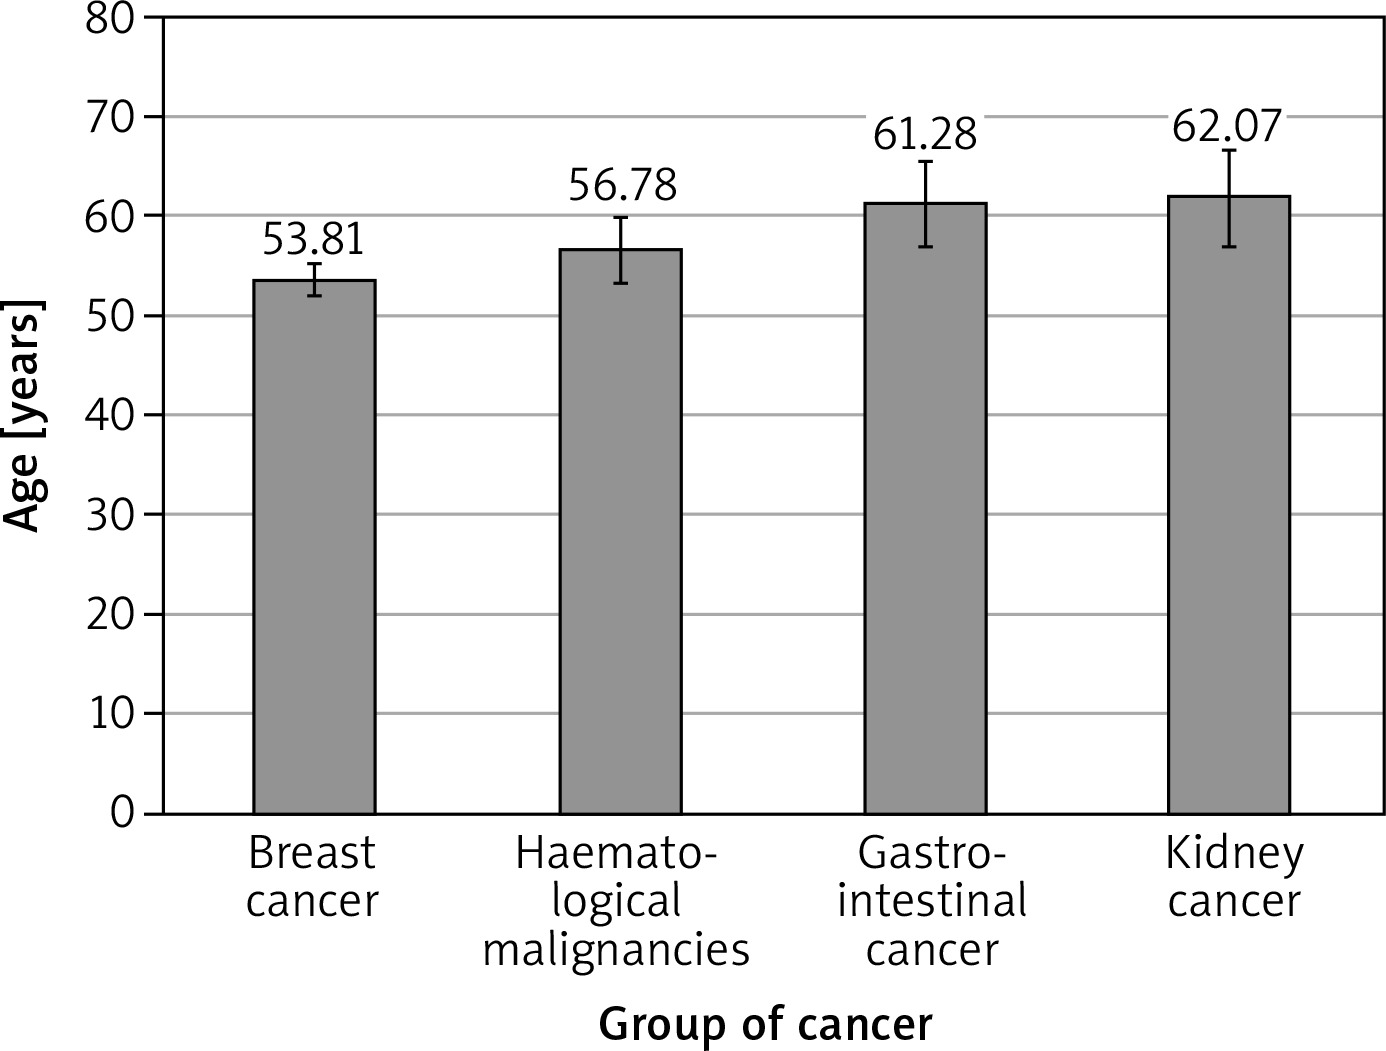
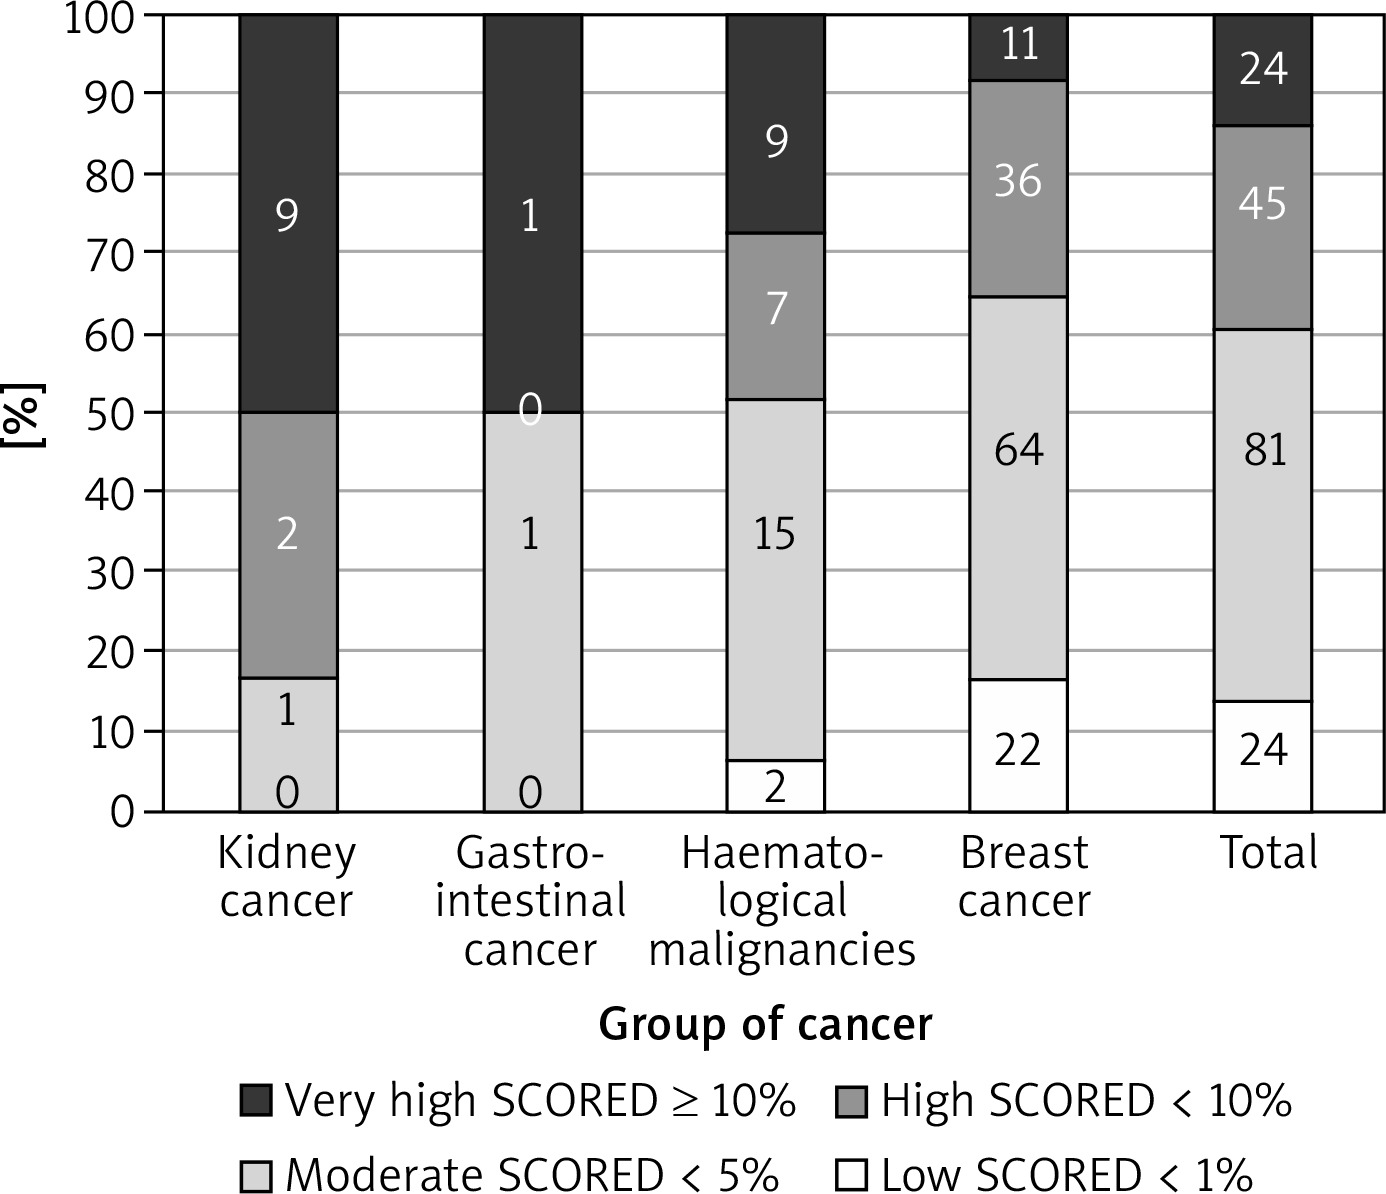
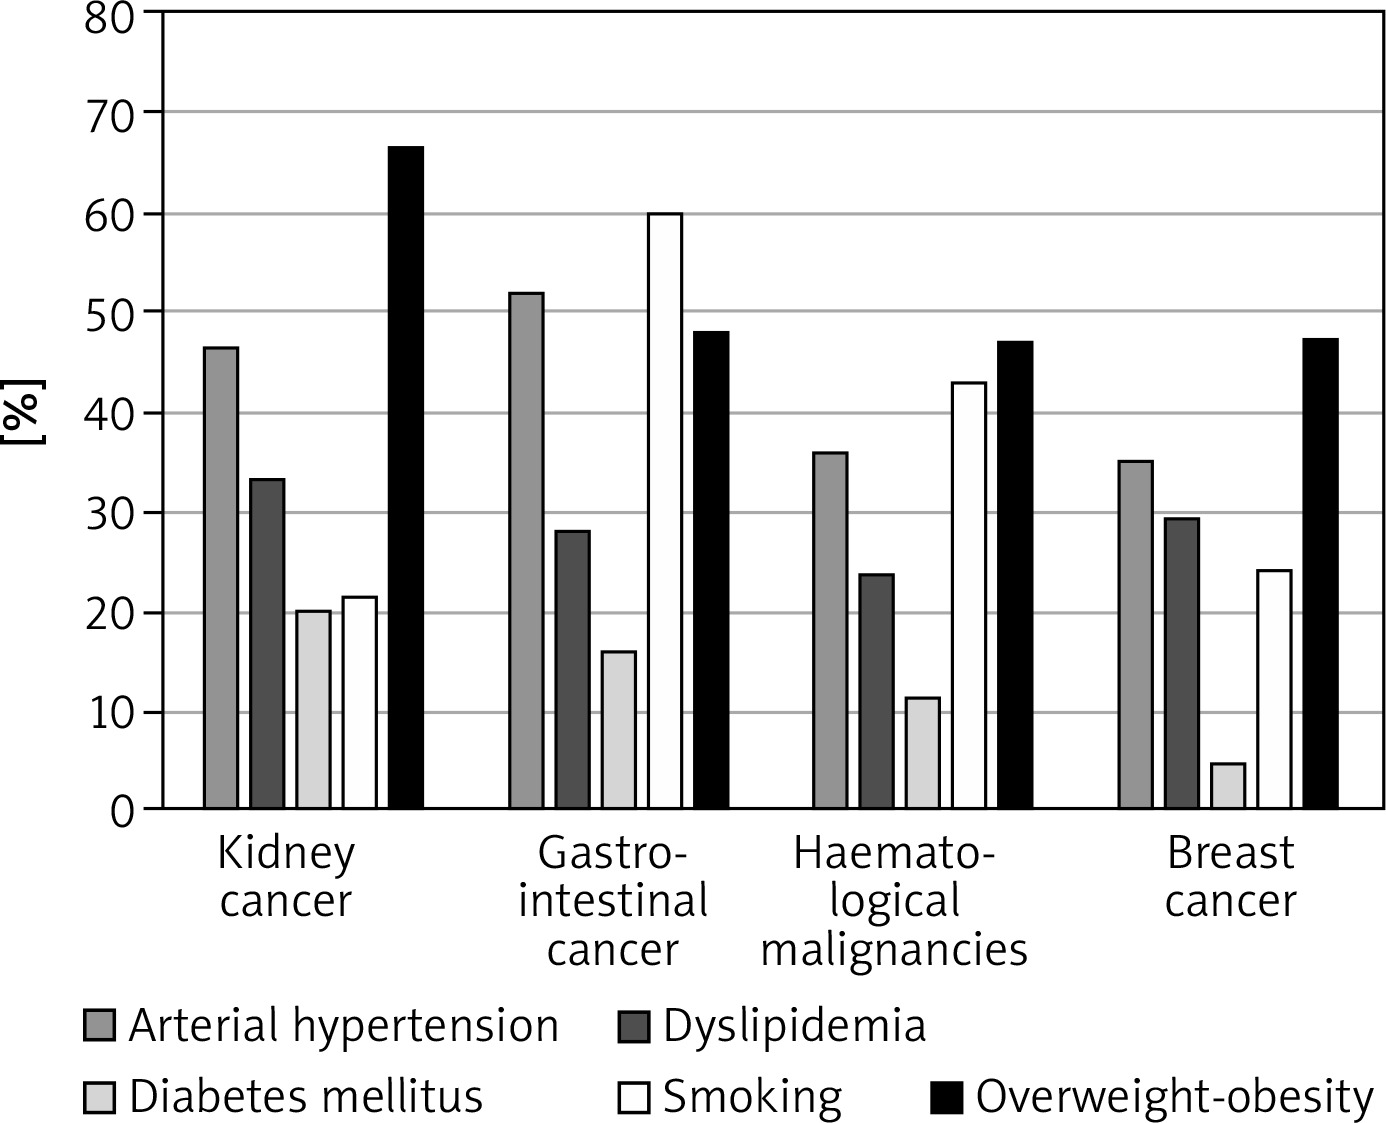
The most prevalent CV risk factors in our group were arterial hypertension (37.3% of pts), dyslipidaemia (27.8%), and diabetes mellitus (8.3%). 31.7% (108) of patients were smokers. The mean BMI value was 26.4 ±4.8 kg/m<sup>2</sup>, and in the whole group 7.5% of patients were underweight, 36.3% had normal weight, 35.6% patients were overweight, and 20.7% were obese. The average value for CV risk estimated by SCORE was 4.6 ±5.1% for the whole group. 13.8% of patients had low (SCORE < 1%), 46.6% moderate (< 5%), 25.9% high (< 10%), and 13.8% had very high CV risk (≥ 10%). The SCORE risk estimate correlated with BMI in the whole group of patients. More obese persons had higher SCORE risk value (p = 0.004), similarly to the patients with lower estimated GFR (p = 0.012). We took two approaches to test for relationship between SCORE and type of cancer, either using the calculated SCORE as a continuous variable using ANOVA test or a discrete variable according to the risk categories (Figure 2). Both approaches revealed statistically significant differences between the groups. In the ANOVA tests we identified the relationship between the group of cancer and SCORE (p = 0.001), and using post-hoc Tukey’s test we infer that the breast cancer had significantly lower CV risk than that with haematological malignancies (Δ = –3.49 ±0.95%; p = 0.002). When we analysed SCORE classes as ranks using nonparametric tests, the patients with kidney cancer had significantly higher risk than patients with breast cancer. In both cases, breast cancer patients appeared to be less affected by CV risk factors as compared to the other cancer types, even though the latter had much lower representation in our group. The distribution of major risk factors (diabetes, arterial hypertension, smoking, dyslipidaemia, overweight, and obesity) across the cancer types is shown in Figure 3, and only 19% were free of any of the factors.
Figure 2
The relationship between the group of cancer and SCORE divided into four groups (numbers denote the incidence)
Within the study group, age was correlated with glycaemia (p = 0.005; r = 0.18), BMI (p < 0.0005; r = 0.2), SCORE (p < 0.0005; r = 0.79) and, as expected, risk of comorbidities: arterial hypertension, diabetes mellitus, and dyslipidaemia (p < 0.00005).
Comparing the two largest subgroups, breast cancer patients were younger (mean age: 53.8 vs. 56.8 years; p = 0.0004), had lower BMI (p = 0.03), and were more likely to receive ACEI than HM patients. The latter presented with lower haemoglobin and haematocrit (p < 0.001 and p = 0.006, respectively), and higher concentrations of natriuretic factors and creatinine as compared to the breast cancer group (p < 0.001 and p = 0.008, respectively). There were fewer smokers in the subgroup of breast cancer as compared to HM pts (24.1% vs. 42.8%, respectively), possibly related to female predominance.
In the absence of overt heart failure, natriuretic peptides were elevated in a subset of our patients, representing subclinical left ventricular abnormalities. In dichotomic analysis of normal vs. abnormal BNP/Nt-proBNP patients we found a positive relationship with CV risk estimated by the SCORE algorithm when we considered the continuous raw values (3.29 ±3.27% vs. 5.6 ±4.77%) p = 0.0044 as well as when we considered the categorical SCORE result (low, moderate, high, very high; p = 0.004).
Finally, we compared the data of all patients and, separately, the two largest subgroups of patients (HM and breast cancer) with epidemiology data derived from the NATPOL 2011 study population, conducted on a representative sample from the Polish population of 18–79-year-olds [4]. The oncology patients in our whole group had more prevalent arterial hypertension (37.3% vs. 32%; p = 0.035), diabetes mellitus (8.3% vs. 5%; p = 0.005), were often smokers (31.7% vs. 27%; p = 0.049), but had less dyslipidaemia (27.8% vs. 61%; p < 0.0001) than the NATPOL 2011 population. Breast cancer patients were more similar to the general population studied in NATPOL 2011– the only statistically significant difference was lower risk of hypercholesterolaemia (29.4% vs. 61%, p < 0.0001). There were significantly more smokers (42.8% vs. 27%; p = 0.0007) and diabetics (11.2% vs. 5%; p = 0.0067) but less hypercholesterolaemia (23.6% vs. 61%; p < 0.0001) and obesity (8.8% vs. 22%; p = 0.0024) in the HM sub-group than in the general NATPOL 2011 cohort. Details on gender and age subgroups are shown in Tables IV and V. Differences were found between groups in the oldest age range – 60–79 years – in the percentage share of arterial hypertension (51.1% in cancer group vs. 67.8% in NATPOL 2011; p < 0.0005) and smoking (30.2% per cancer vs. 17.1% per NATPOL 2011; p < 0.0005) – Table IV. Both women and men with cancer were older than those in NATPOL 2011. Additionally, the women in the cancer cohort had higher prevalence of arterial hypertension than those in NATPOL 2011 – Table V. In the group of men with cancer the percentage share of smokers was higher than in NATPOL 2011 (p = 0.002). At the same time the NATPOL 2011 population had more prevalent dyslipidaemia in all age ranges.
Table IV
Comparison between cancer and NATPOL 2011 populations in age ranges
Table V
Comparison between cancer and NATPOL 2011 populations between sexes
Discussion
The main finding of our study is the identification of patients initiating chemotherapy for the new diagnosis of cancer as the population carrying a high-risk CV profile. Most patients had at least one CV risk factor and about 41% had two or more, in the absence of a significant CV disease diagnosis. We identified CV risk factors in the vast majority of the patients, and in more than 1/3 their CV risk calculated by general SCORE calculator was high or very high. Importantly, we screened our patients before the initiation of systemic therapy, unlike only cancer survivors, as done in some other studies. It must be noted that SCORE was not designed for cancer patients, and some other algorithms were created to predict cardiac events in the group of oncological patients. However, many risk factors including smoking, obesity, unhealthy diet, and physical inactivity are shared both for CV diseases and cancers [5, 6]. In the general population, components of metabolic syndrome such as smoking, obesity, arterial hypertension, hypercholesterolaemia, and glucose intolerance contribute to the development of coronary artery disease and heart failure, but they could have an influence also on increasing risk of neoplasia, for example colorectal [7]. A high prevalence of metabolic syndrome has been reported in the group of patients with prostate cancer [8], whereas in colorectal cancer, coexisting metabolic syndrome and plasma leptin were associated with more aggressive tumour phenotype in males [9]. Many oncological patients may present with subclinical or overt CV disease at the time of cancer diagnosis. Mast et al. showed higher coronary artery calcium scores in a cohort of asymptomatic breast cancer patients than in an age-matched control group [10]. The coexistence both of these diseases leads to increased mortality and worse results of oncological treatment. In addition, CV risk factors also increase the probability of cardiotoxicity in cancer patients. In two large studies Szmit et al. demonstrated that arterial hypertension in a lymphoma group [11] and hypercholesterolaemia in metastatic breast cancer patients [12] increased the risk of developing left ventricle systolic dysfunction. Arterial hypertension and diabetes mellitus are well known as risk factors for anthracycline-induced cardiotoxicity [13]. Wierzba et al. showed correlation between different types of cancers and diabetes both in urban and rural areas [14]. In elderly and middle-aged patients, diabetes mellitus increased the risk of hospitalisation due to cancer [15]. In our study we found a high frequency of traditional CV risk factors, which could lead to cancer but also CV complications. The antineoplastic treatment accelerates the occurrence of CV disease, especially in the case of coexistence of traditional risk factors. Data regarding estimates of CV risk are sparse for oncological patients, especially when limited to patients without preceding CV disease. Toggweiler et al. showed in a heterogeneous group of 187 patients (breast cancer, malignant lymphoma, sarcoma) at baseline, before chemotherapy, the presence of arterial hypertension in 13% and coronary artery disease in 3%. Additionally, patients with these factors more often developed systolic heart failure [16]. In our whole group arterial hypertension was remarkably more frequent, at 34%. Singh et al. were looking for a relationship between metformin and the likelihood of chemotherapy-related adverse events in grade 3 or higher colon cancer patients and found a 13.6% prevalence of diabetes mellitus among 1958 patients undergoing chemotherapy [17]. Phipps et al. identified 52.5% of smokers in a group of 1959 colorectal patients. Smoking was associated with shorter disease-free survival and time to recurrence [18]. In our small subgroup of colorectal patients, diabetes mellitus occurred with similar frequency – 16%, and the proportion of smokers was very close 60%.
Willemse et al. assessed 10-year CV risk using the Framingham Risk Score (FRS) and Systemic Coronary Risk Evaluation (SCORE) in a group of 255 testicular germ cell tumour survivors (GCT). These cancer survivors had a significantly higher prevalence of obesity, hypercholesterolaemia, and hypertriglyceridaemia compared with age-matched healthy subjects. Patients treated with combination chemotherapy also had the highest prevalence of metabolic syndrome (all NCEP--ATPIII criteria) compared with healthy subjects. Surprisingly, CV risk estimated by FRS (3.0%) and SCORE (1.7%) algorithm was low [19]. Importantly, the survivors of the testicular cancer were much younger (median age: 38.7 years) than our population, and the mean value of SCORE in our cohort was estimated at 4.56%.
The searching of CV complications led Hanrahan et al. to show that patients with early detected breast cancer (T1a,bN0M0) have excellent prognosis, but patients with age at least 50 years old are four times more likely to die of non-cancer conditions [20]. Later, Bardia et al., in a study of postmenopausal women with hormone receptor-positive, non-metastatic breast cancer, assessed the 10-year predicted cancer recurrence risk and CV risk estimated as composite index heart age, calculated by modified Framingham risk score. The authors discovered that 43% of patients had a 10-year predicted risk of CV complications corresponding to breast cancer recurrence. Furthermore, 37% had even higher risk of heart events than of tumour recurrence. Moreover, 80% of postmenopausal women with breast cancer within 10 years had equal or even higher risk of CV disease than of cancer recurrence [21]. The main subgroup in our population consisted of breast cancer patients, and 64.6% of them were at baseline at age above 50 years. We did not obtain information about their postmenopausal status, but 31% of them were above 60 years old. The exceeding of this age is regarded by some authors as one of the definitions of the postmenopausal state. This cohort of patients should be carefully assessed in order to reduce the risk of complications. It is important to recommend at least healthy lifestyle and introduction of therapy of non-breast cancer-related health problems [10].
A study by Patel et al. reported on patients with small renal cancer with CV risk stratified based on the Framingham Heart Study Score. High risk was identified in the case of the presence of the following: congestive heart failure, cerebrovascular disease, history of myocardial infarction, or peripheral vascular disease. Arterial hypertension or diabetes mellitus did not have any influence on risk stratification in this study. Patients with low CV risk benefited from surgery treatment, while the cohort with higher risk had similar cancer survival independently of treatment strategy [22]. The study suggests the potential importance of CV risk stratification at different stages of cancer management. There is growing interest in the prediction of adverse CV effects of cancer drugs.
The SCORE algorithm might be helpful in identifying high-risk patients, who could benefit from cardiologist opinion prior to initiating systemic treatment, especially potentially cardiotoxic. In that group of patients primarily the reduction of CV risk should be obtained, and cardioprotective treatment (especially angiotensin-converting-enzyme inhibitors or angiotensin receptor blockers) should be considered. The comparison of our group with the NATPOL 2011 population showed that the frequency of some traditional risk factors among patients with cancer is increased (for example arterial hypertension for women). While others, for example dyslipidaemia, were more often found in the NATPOL 2011 population. Our study showed that especially patients with haematological malignancies had a high prevalence of traditional risk factors for CV diseases, higher risk estimated by SCORE algorithm, and elevated heart failure markers. These findings identify cancer patients without overt CV disease as a potential target for effective prevention, along with improving long-term outcomes of anti-cancer therapies.
Several limitations warrant mention. The ONCOECHO study was not designed as population-based epidemiologic research; therefore, the prevalence data must be viewed with caution. This study was conducted in cardiology centres, and its primary aim was to evaluate the CV consequences of systemic treatment applied in selected neoplasms. Therefore, several types of cancer were represented with uneven distribution, similar to the gender proportion (female prevalence due to the biggest subgroup with breast cancer). As our study belongs to a complex multicentre project, the completeness of CV risk data is less than 100%, which is a significant limitation of this study. We decided to use the SCORE algorithm, which does not contain all important risk factors for CV diseases, but is common and easily accessible.
Although we recruited patients with their first cancer diagnosis, the study included both patients in early and advanced stage. Finally, in this manuscript we do not assess the follow-up outcomes of our patients.
In conclusion, patients classified as suitable for antineoplastic chemotherapy often present with clusters of typical CV risk factors. Eighty-one percent of our patients had at least one classical risk factor and 41% of them two or more, leading to high values in SCORE. Thus, even before the initiation of the chemotherapy, many of them had very high risk for CV mortality. According to our findings, the patients with haematological malignancies may carry the highest risk for CV complications. Whereas the implications of CV risk factors regarding the success of complication-free cancer therapy remain to be studied, the patients entering chemotherapy are at elevated CV risk and therefore represent a valid target for CV prevention. We suggest that all newly diagnosed oncological patients should be considered for evaluation by a multidisciplinary team including a standard cardiological approach before the initiation of oncological treatment.