Introduction
Hashimoto’s thyroiditis (HT) is a common endocrine disease characterized by infiltration of the thyroid gland by large numbers of immune cells, which produce autoantibodies targeting thyroid-specific antigens, including thyroglobulin (TG) and thyroperoxidase (TPO) [1]. The precise pathogenesis of HT is not fully understood but it is currently believed that, under certain genetic backgrounds, environmental factors (e.g., iodine, virus) and epigenetic modifications together lead to thyroid autoimmune intolerance [2]. The contribution of genetics to the etiology of HT has been demonstrated by several linkage and association studies and at least five specific loci, i.e. HLA-DR, TG, CTLA-4, PTPN22 and ARID5B, have been suggested to be associated with HT [3]. The risk of disease is not, however, significantly associated with genetic susceptibility, suggesting that other factors, such as epigenetic modification, may be involved in the development of the disease.
Epigenetic changes, defined as stably heritable alterations in gene expression without changes in nucleotide sequence, have been associated with many diseases. Mechanisms involved in epigenetic regulation of gene expression include DNA methylation, histone modification (acetylation, methylation, phosphorylation and ubiquitination) and non-coding RNAs. Histone methylation is a dynamic process that is mainly achieved by methyltransferases and demethyltransferases. In mammals, there are at least 10 known or predicted methyltransferases that methylate histone H3 on lysine 4 (H3K4). The best characterized of these are the mixed lineage leukemia (MLL) family (MLL1-4, SETD1A and SETD1B), which are homologues of the first methyltransferase to be identified, SET1 [4].
Trimethylated H3K4 (H3K4me3) is currently attracting much interest because it is specifically enriched at the 5’ end of the open reading frame (ORF) of genes and the degree of H3K4 trimethylation at the transcriptional start sites (TSSs) is closely associated with gene transcription [5]. At TSSs, marked H3K4me3 enrichment was detected immediately downstream from the DNase I hypersensitive sites in promoter regions following DNase I cleavage, and this precise relationship can even be used for annotation of TSSs [6].
Thyrocytes, the target cells in HT, express the thyroid-specific antigens, TG and TPO, as well as many cytokines and adhesion molecules under stimulation by iodine and proinflammatory factors [7]. Although there has been extensive research into the involvement of thyroid cells in autoimmune thyroid disease ( AITD) over the past years, the extent of genome-wide H3K4me3 has not yet been elucidated in thyroid follicular cells (TFCs) of HT patients. Here, we aimed to identify differences in H3K4me3 distribution on a genome-wide scale as well as global H3K4me3 levels in primary thyrocytes and thyroid tissues from HT patients.
Material and methods
Subjects
This study was approved by the Ethics Committee of the First Affiliated Hospital of China Medical University. Thyroid specimens were obtained from the non-affected lobes of patients who underwent thyroidectomy. Serum samples were also obtained to detect thyroid antibodies and measure thyroid function using an electrochemiluminescence method. All subjects were female and were euthyroid at the moment of surgery, with no thyroid hormone replacement therapy or anti-thyroid drugs and with no history of systemic autoimmune disease or any severe illnesses. Patients in the HT group were positive for at least one thyroid antibody (TG-Ab, TPO-Ab) and had pathologically confirmed HT during surgery. Subjects in the control group were age-matched and were both negative for thyroid antibody and pathological diagnosis of HT. Signed informed consent was obtained from all donors before surgery. The clinical characteristics of patients and controls are listed in Table I.
Table I
Clinical characteristics of patients with Hashimoto’s thyroiditis and controls
| Variable | HT | Control | Reference ranged | P-value |
|---|---|---|---|---|
| Number | 40 | 40 | – | – |
| Agea | 49.23 ±2.25 | 53.45 ±1.94 | – | 0.15 |
| TSH [mIU/l]b | 2.66 (1.89–3.78) | 2.14 (1.40–3.86) | 0.35–4.94 | 0.229 |
| FT4 [pmol/l] | 12.96 ±1.74 | 14.44 ±2.33 | 9.01–19.05 | 0.069 |
| FT3 [pmol/l] | 3.88 ±0.62 | 4.55 ±1.02 | 2.63–5.70 | 0.200 |
| TPOAb [IU/ml] | 124 (55.15–552.98) | 0.37 (0.26–0.84) | 0–5.61 | < 0.001 |
| TgAb [IU/ml] | 99.6 (25.46–558) | 1.22 (0.88–1.66) | 0–4.11 | < 0.001 |
Primary cultures of human thyroid cells
Thyroid tissue was cut into small pieces, washed with Hanks’ balanced salt solution, and then incubated with collagenase type IV (1.25 mg/ml) (Sigma Aldrich , St. Louis, MO, USA) in RPMI 1640 medium for 2 h at 37°C. The cells were then filtered and centrifuged at 1,000 rpm for 5 min. The cells were finally resuspended in a complete medium consisting of RPMI 1640 medium, supplemented with 10% fetal calf serum (FCS) (Gibco, Grand Island, NY, USA), bovine insulin (1 μg/ml), transferrin (5 μg/ml), hydrocortisone (10–8 mM), thyroid stimulating hormone (30 μU/ml, non-essential amino acids (1 mM) and 1% penicillin-streptomycin (Sigma).
Chromatin immunoprecipitation sequencing (ChIP-seq) using deepTools
Chromatin immunoprecipitation was performed using a ChIP-IT High Sensitivity Kit (Active Motif, Carlsbad, CA, USA). After fixation with formaldehyde, the cells were collected by scraping into a 15 ml centrifuge tube, incubated with micrococci nuclease (Active Motif) at 37°C for 20 min. The nuclei were resuspended and sonicated to obtain the appropriate chromatin. Each chromatin sample was incubated overnight at 4°C with H3K4me3 antibody (CST, Beverly, MA, USA), and then incubated with protein G beads in a shaker for 2 h at 4°C and separated using a magnetic stand. After de-crosslinking and purification, the qualified DNA was used for second-generation sequencing.
Bioinformatics analyses
We sequenced 12 samples (including 6 inputs) for hg19 species using Chip-seq technology, on average generating 32272581 raw reads and 32109156 clean reads, which were mapped to the human hg19 reference genome using SOAPaligner/soap2 [8]. Only alignments within two mismatches were considered in peak calling, based on a defined analysis using Model-based Analysis of ChIP-Seq (MACS), and MAnorm was used to identify differential peaks between the HT and control groups [9]. For one of the ChIP-ed control samples, the mapping rate was much lower than for the others and this sample did not qualify for further analysis.
Western blotting
The total protein extraction was performed using Protein Extraction Kit (KeyGEN, Jiangsu, China). Immunoblotting was performed according to the standard protocol and the proteins were transferred to PVDF membranes (Millipore, Burlington, MA, USA), blocked with TBST + 5% skimmed milk, incubated overnight at 4°C with the antibodies anti-H3K4me3 (Abcam, Cambridge, MA, USA), anti-β-actin (Abcam) and anti-MLL1 (CST), then washed three times with TBST and incubated with HRP-conjugated IgG antibody. Immunoblot bands were quantified relative to β-actin using Image Pro Plus software (Media Cybernetics, Inc.) [10].
Real-time RT-PCR
Total RNA was extracted using TRIzol (Gibco). Reverse transcription was carried out using a PrimeScript RT Reagent Kit with gDNA Eraser (Takara, Bio Inc., Shiga, Japan). cDNA amplification was then performed using SYBR Premix Ex Taq (Takara) with a Light Cycler 480 instrument (Roche, Basel Switzerland). mRNA expression for each sample was analyzed using glyceraldehyde 3-phosphate dehydrogenase (GAPDH) as an internal control. Primer sequences are listed in Table II.
Table II
Primer sequences used for RT-PCR
Immunohistochemistry
After dewaxing and hydration, paraffin sections were incubated with 3% H2O2 for 15 min, placed in a microwave oven for 10 min for antigen retrieval, blocked with goat serum for 20 min, and then incubated overnight with MLL1 antibody (CST). The sections were then dehydrated in gradient alcohol, sealed and observed using a microscope (Olympus BX51, Tokyo, Japan).
Statistical analysis
Statistical analyses were performed using SPSS Software 20.0 (SPSS, Inc., Chicago, IL, USA). Results are shown as means ± standard deviation and an independent sample t-test was used to determine whether differences between the patient group and the control group were statistically significant. P-values < 0.05 are viewed as statistically significant.
Results
Differences in H3K4me3 patterns between HT patients and control subjects
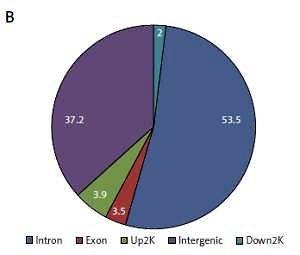
Based on their location (UCSC annotation data), peaks were classified and assigned to the following genomic regions: intergenic, introns, downstream, upstream and exons. In agreement with the previously described canonical H3K4me3 pattern [11], all of our samples showed clear enrichment of H3K4me3 at the TSSs, suggesting that the genomic profiles were highly reproducible and that the average depth of H3K4me3 showed a bimodal distribution, from 1,000 bp upstream to 1,000 bp downstream, of the TSSs. The profiles of H3K4me3 identified in this study varied between the HT and control groups. Most of the sites with differential enrichment were located in intergenic and intron regions (Figure 1).
Figure 1
Genomic pattern of H3K4me3 peaks detected in six samples. A – H3K4me is mainly enriched around TSSs; B – Differential peak distribution on gene elements between Hashimoto’s thyroiditis group and age-matched control group. For one of the ChIP-ed control samples, the mapping rate was much lower than for the others and this sample did not qualify for further analysis
HT – Hashimoto’s thyroiditis, N – age- and sex-matched controls, TSS – transcriptional start site, H3K4me3 – trimethylated histone 3 lysine 4.
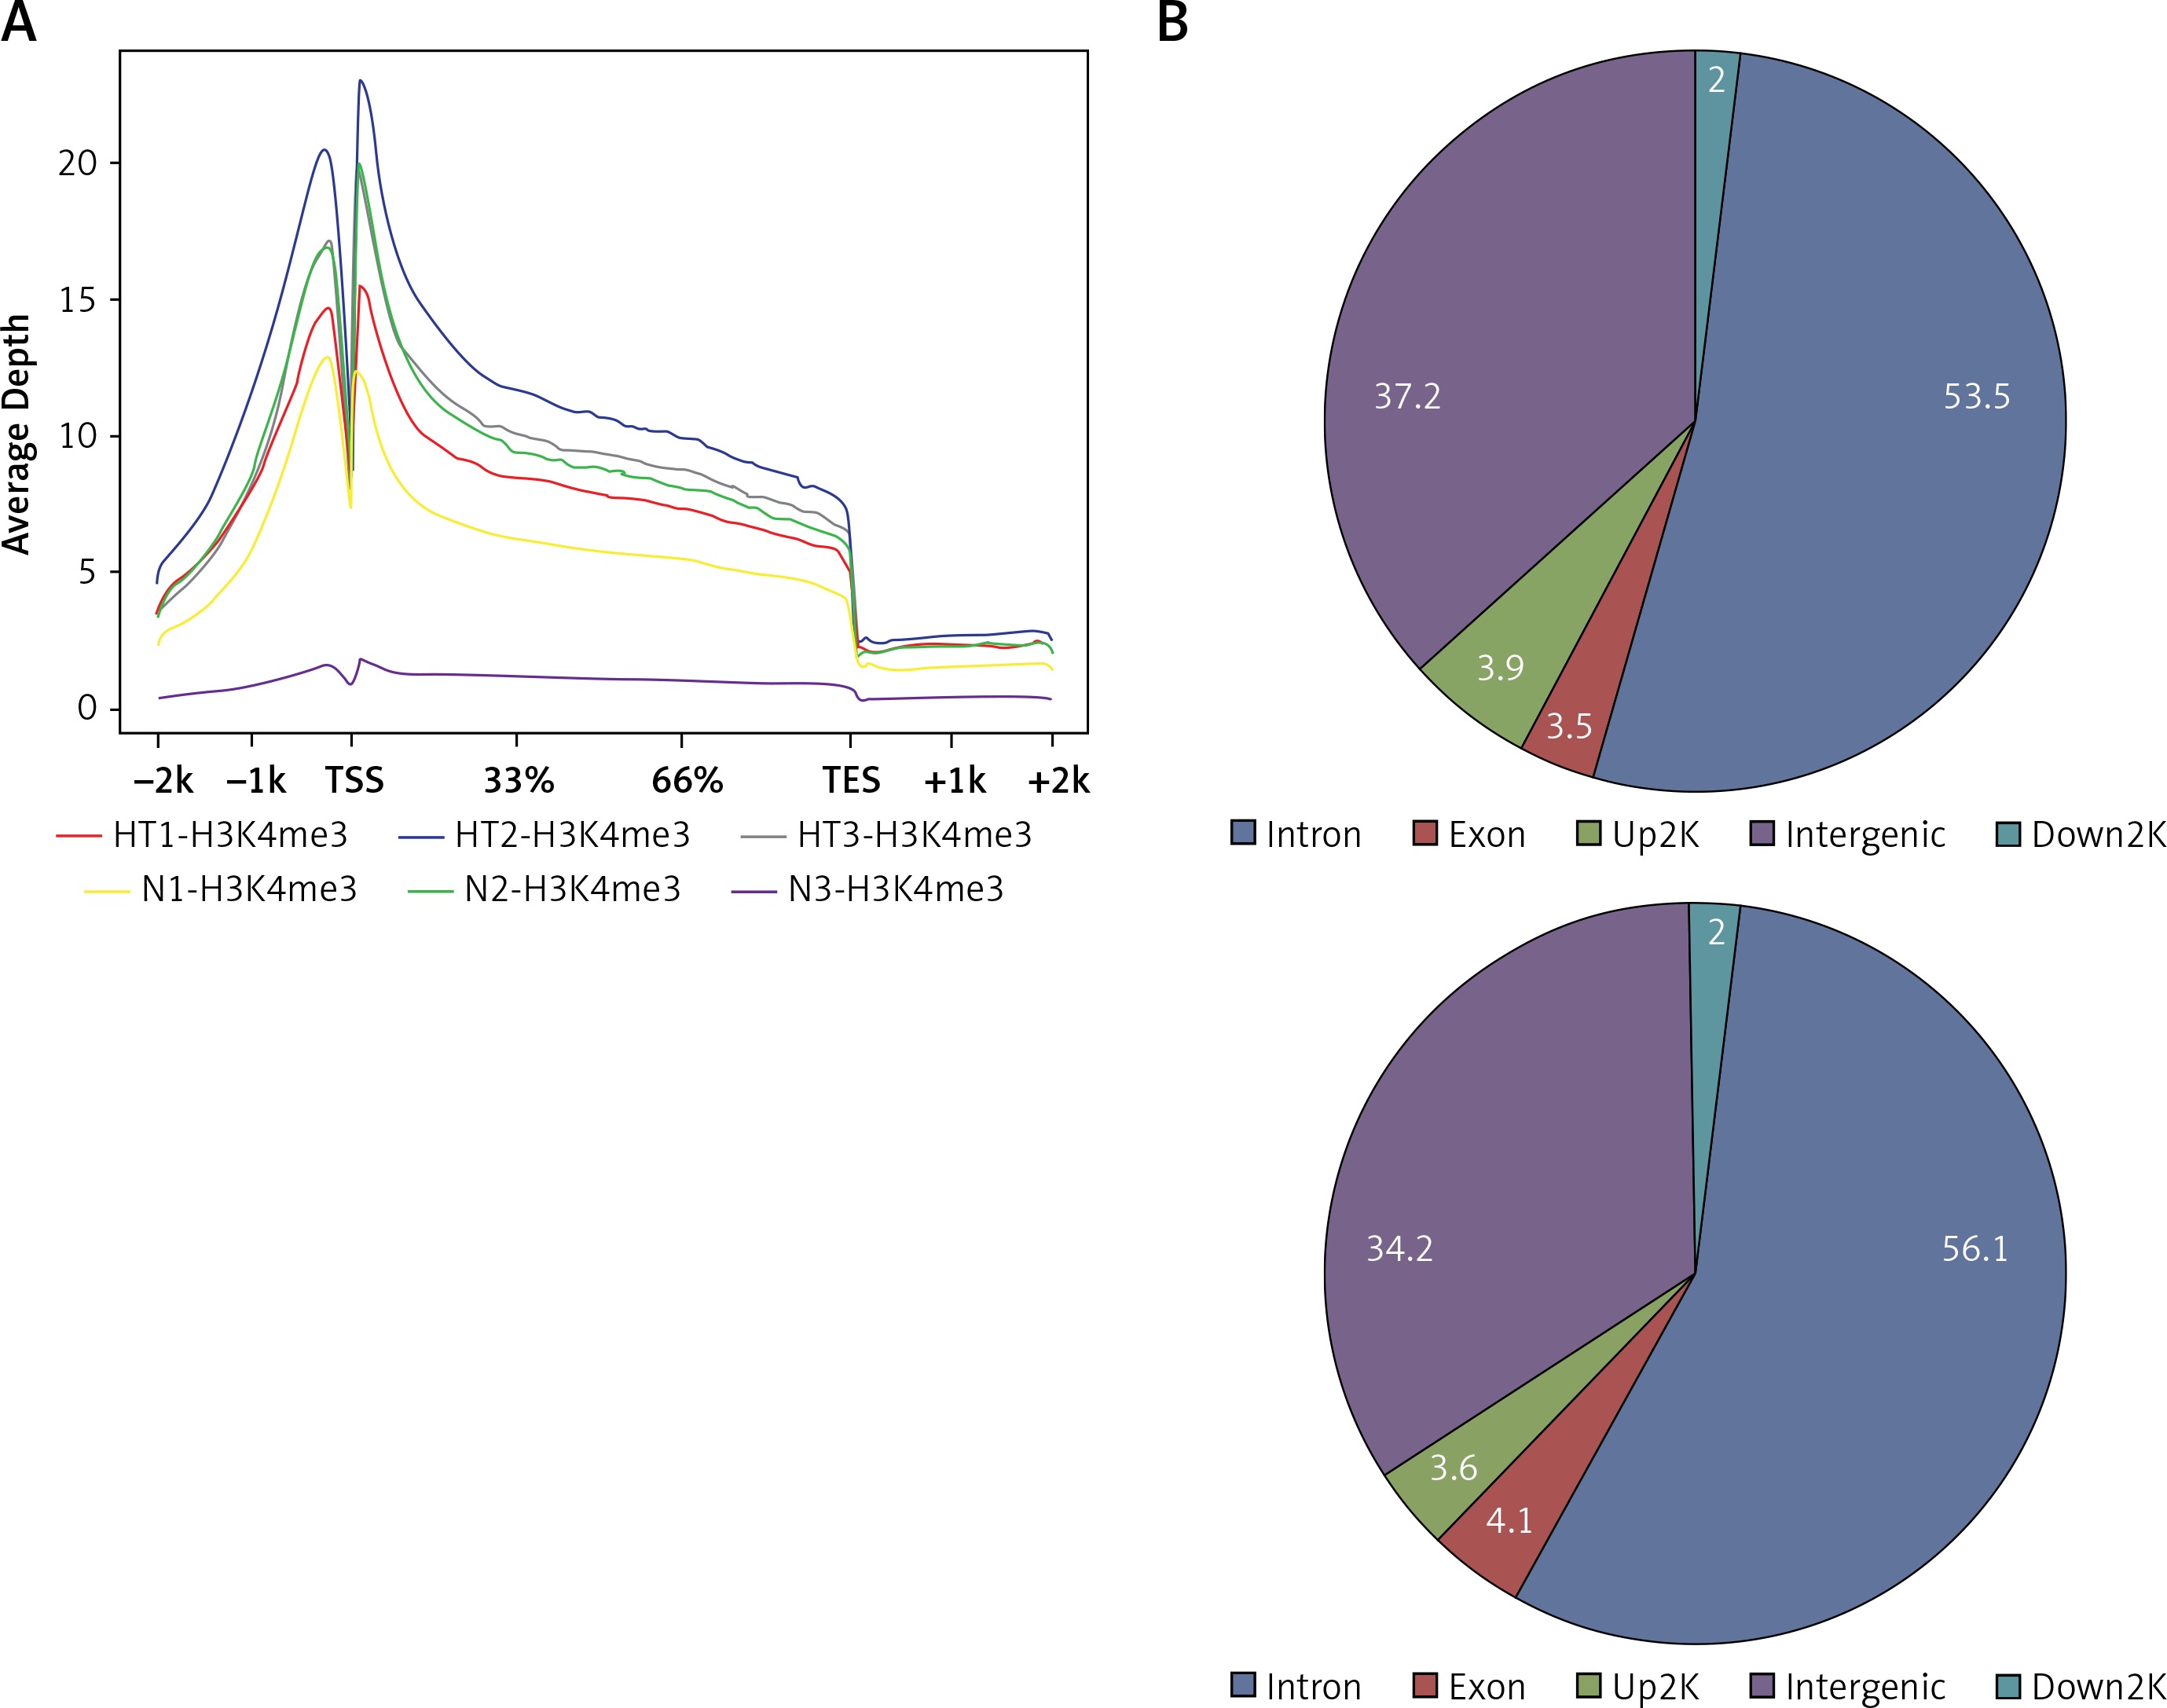
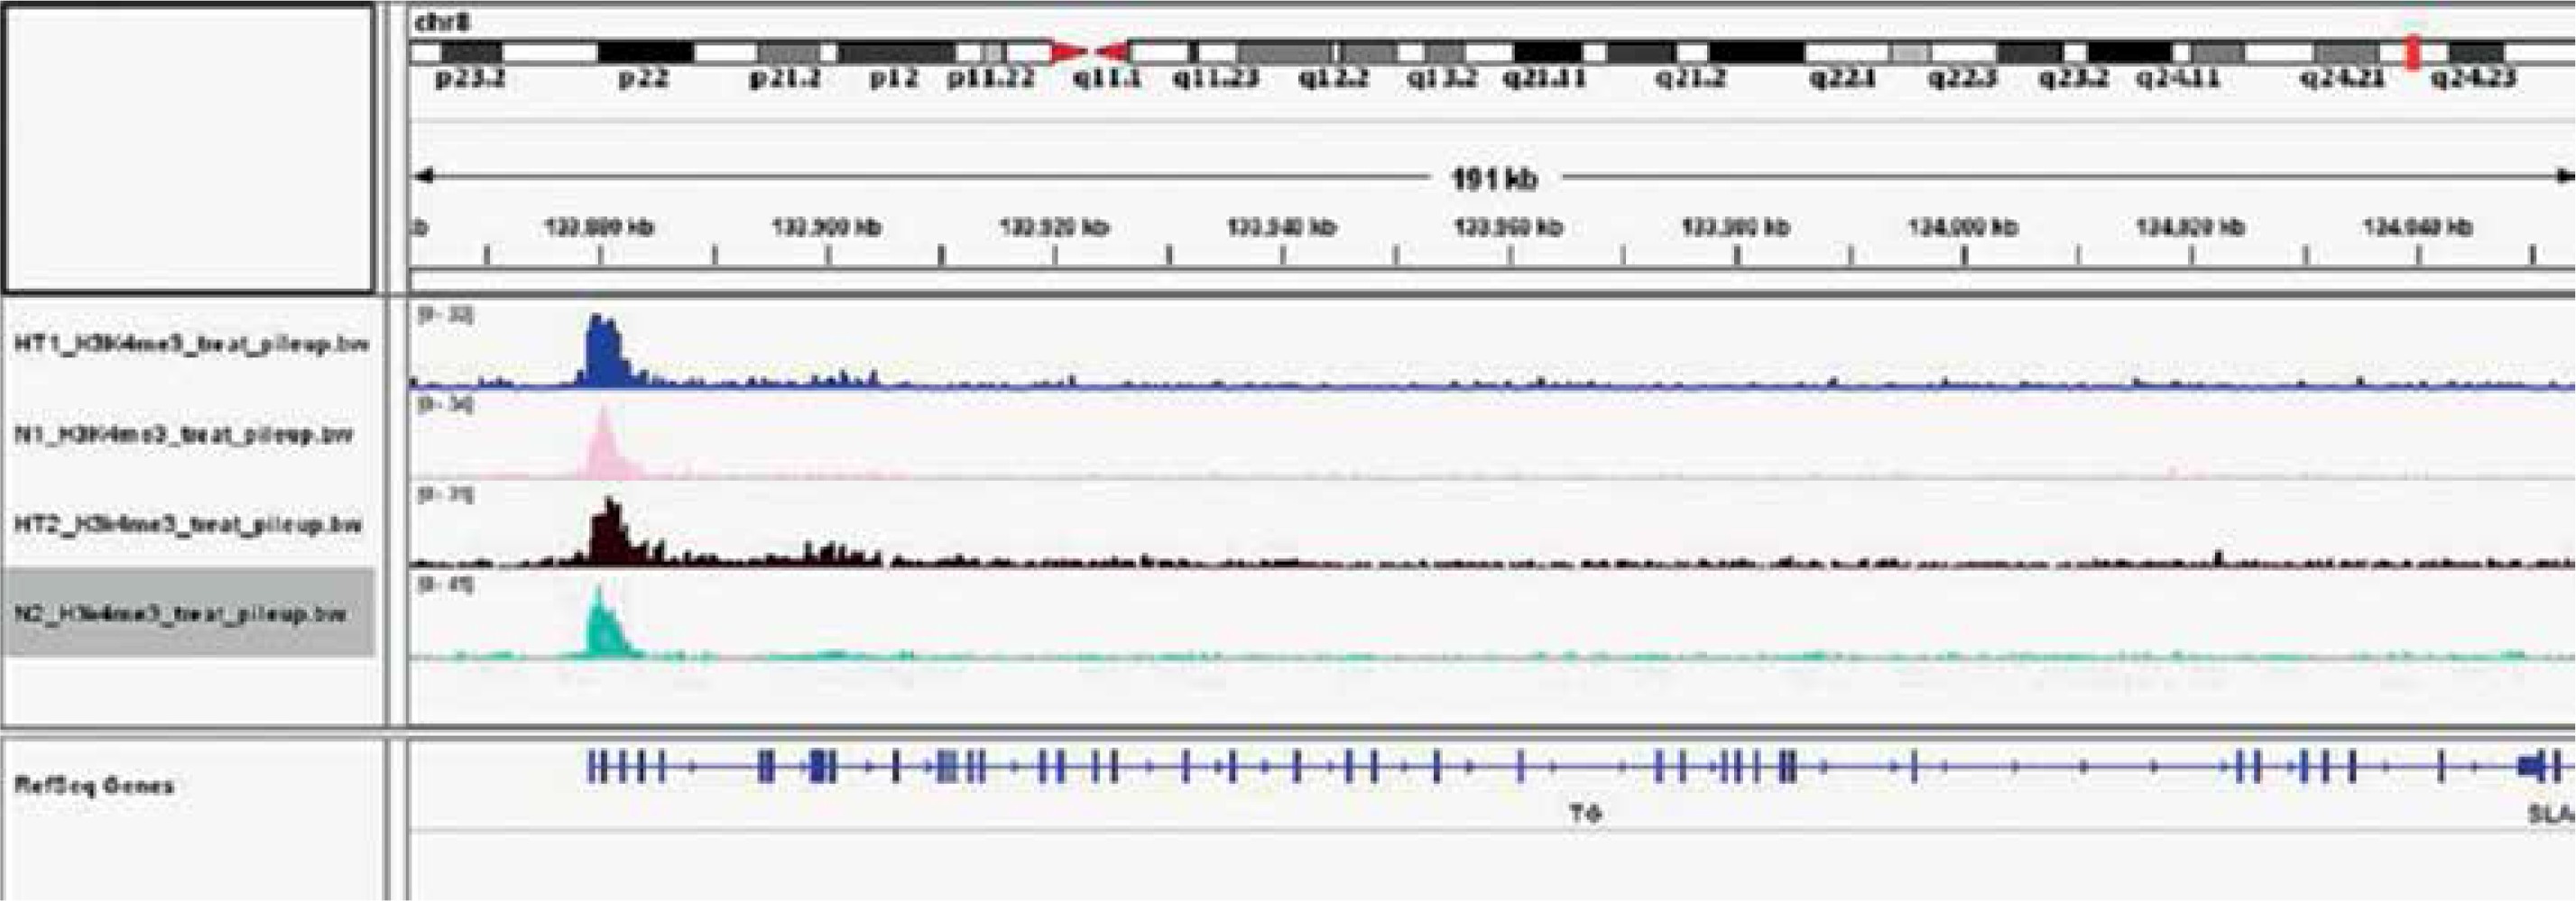
Gene ontology (GO) annotation and KEGG pathway analysis were used to further explore the function of the genes. The GO analysis showed that the differential peak-related genes were mainly involved in biological processes such as responses to stimuli and regulation of cell adhesion. KEGG pathway analysis suggested that these genes were remarkably enriched in cell adhesion molecules, AITD, pathways in cancer and the Ras signaling pathway (Table III). The most important differential genes with higher signals for H3K4me3 peaks in the HT group were those enriched in the AITD pathway, including TG, TSHR, MHCII, CTLA, CD80/86 and Fas/Fasl. It is noteworthy that the TG promoter of TFCs from HT patients had, on average, a much greater enrichment signal for H3K4me3 compared with the control group. The Integrative Genomics Viewer (IGV) was used to visualize H3K4me peaks in the TG promoter (Figure 2). Chemokines, including CCL2 (C-C motif chemokine ligand 2), CXCL8 (C-X-C motif chemokine ligand 8), CXCL10 (C-X-C motif chemokine ligand 10) and IL-18 (interleukin-18), adhesion molecules, including ICAM1 (intercellular adhesion molecule 1) and ITGA4 (integrin subunit α4), and apoptosis factors, including FASLG (Fas ligand) and TRAIL (TNF superfamily member 10), also showed increased H3K4me3 enrichment in the promoter region around the TSSs (Figure 3).
Table III
KEGG pathway terms (Top 10) and Gene Ontology terms (Top 5) related to the genes that are associated with differential H3K4me3 peaks
Gene expression
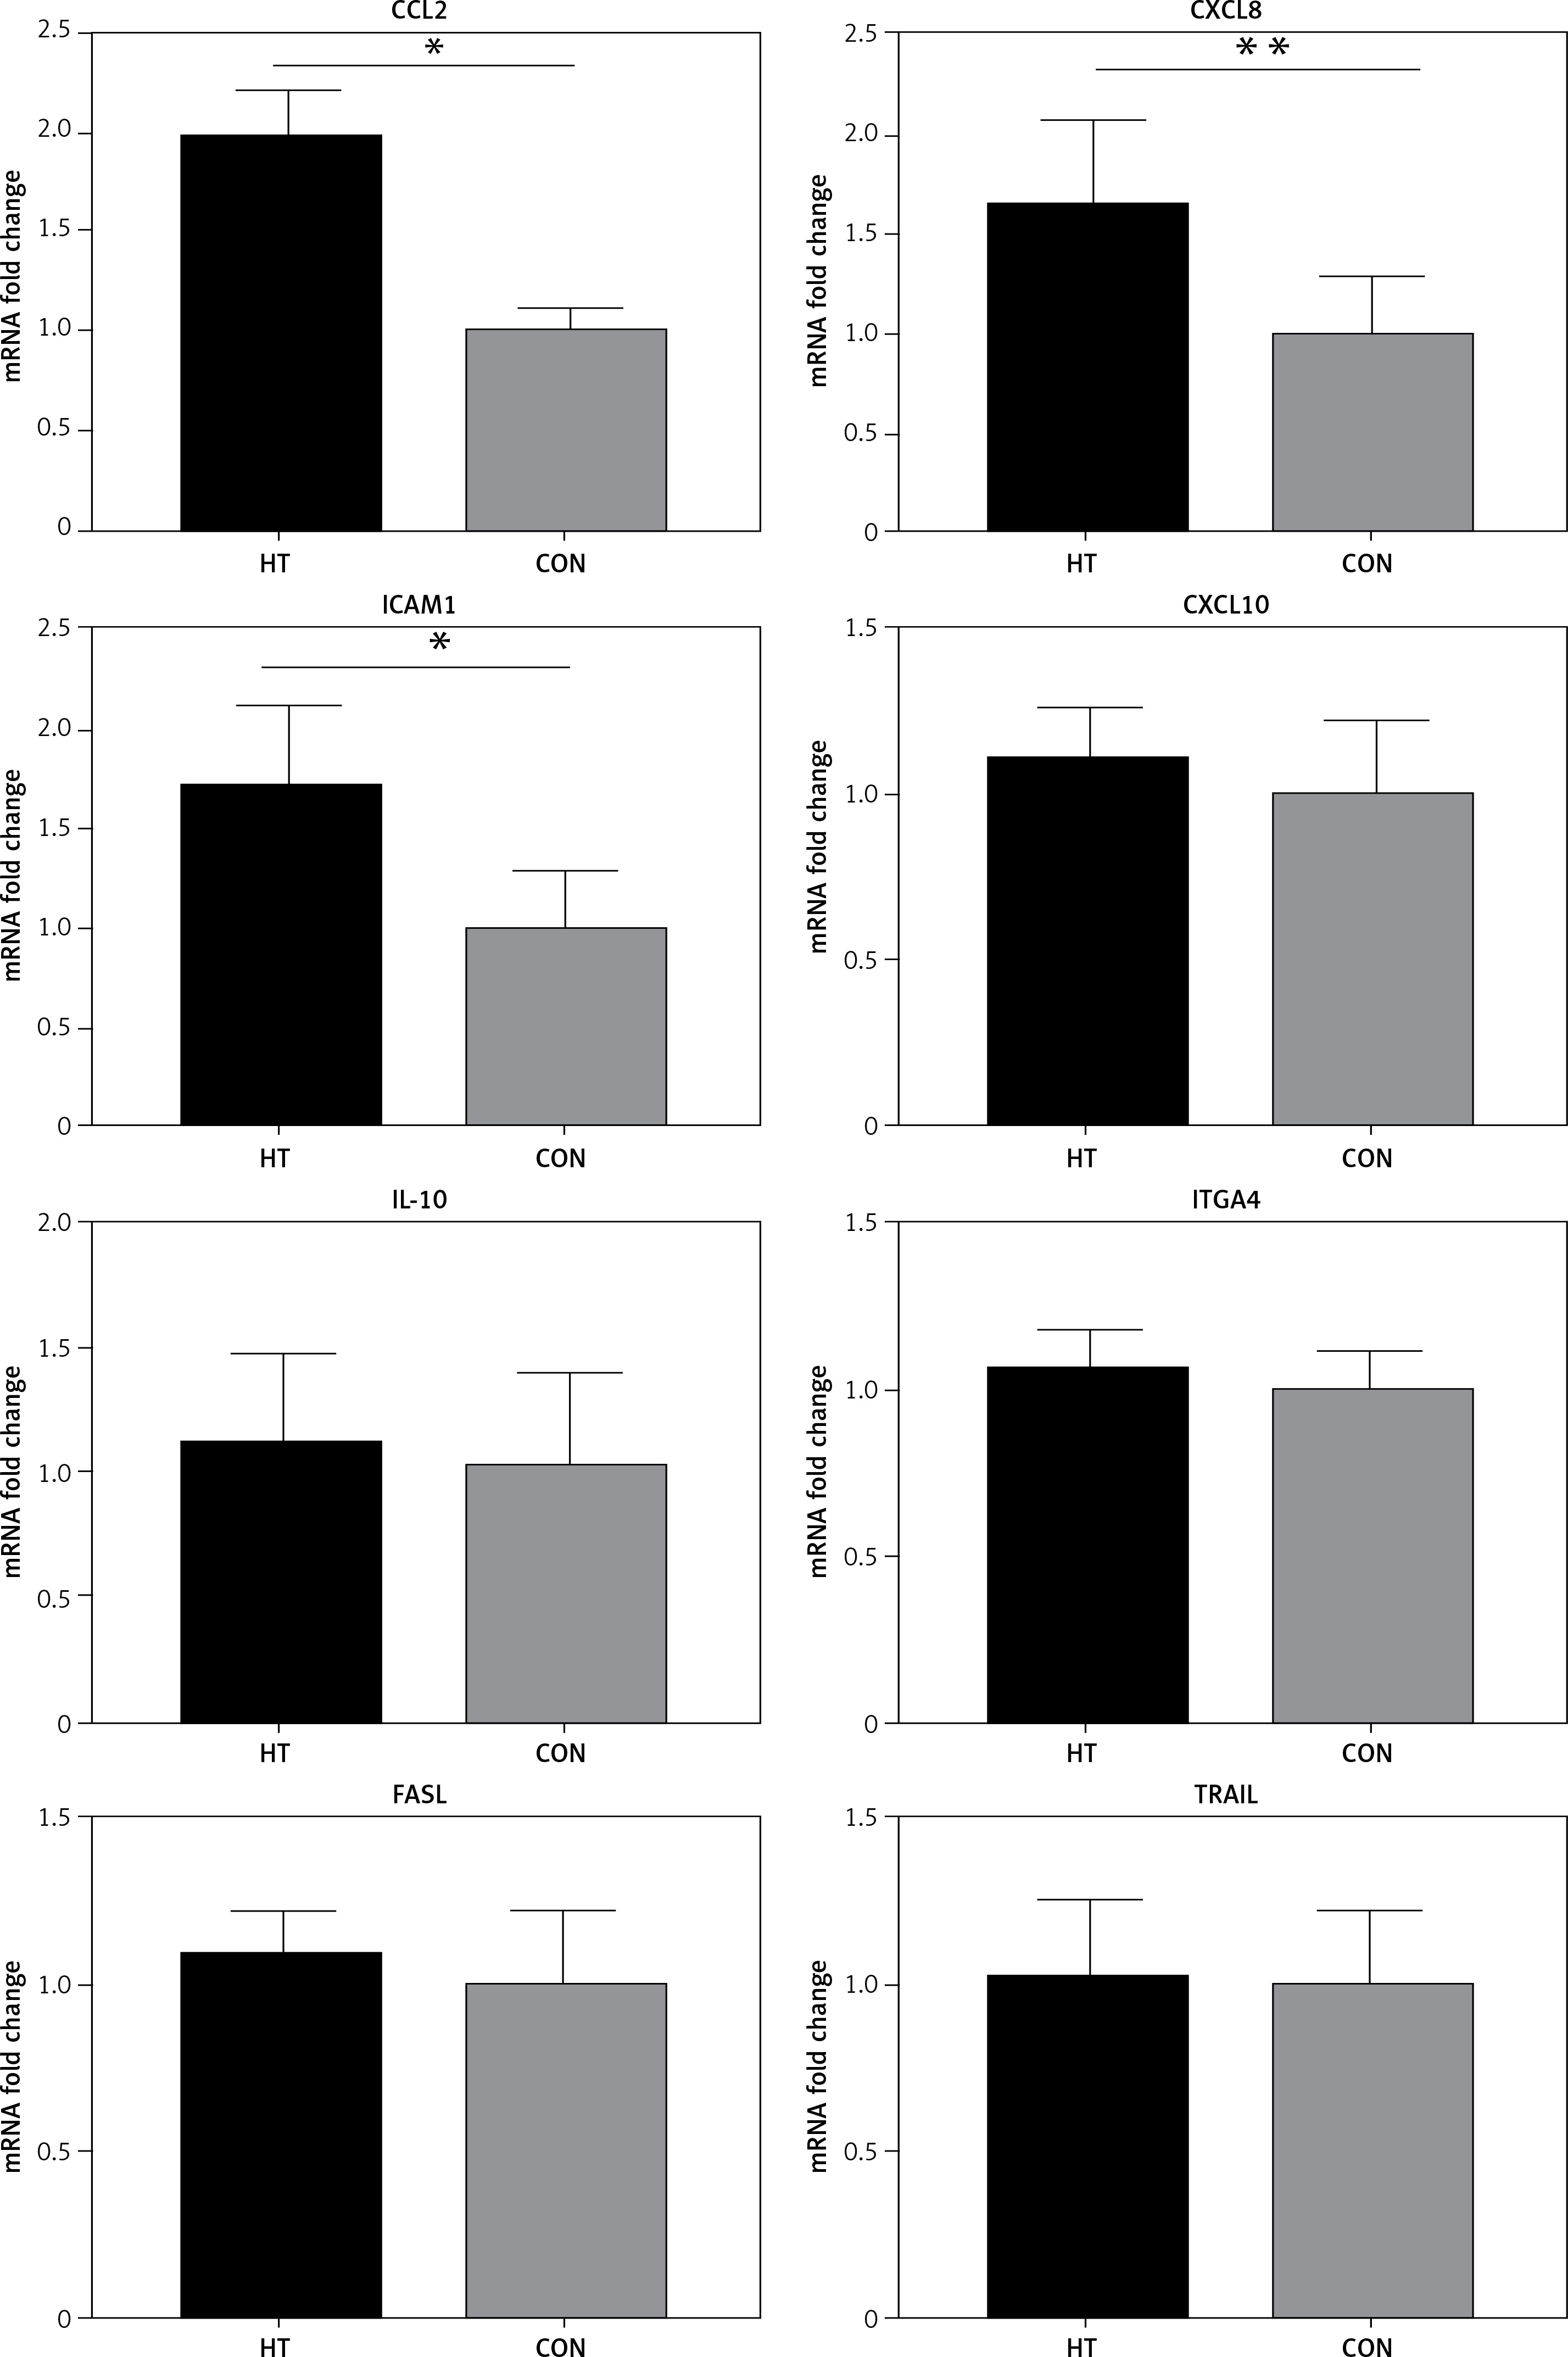
It is accepted that H3K4me3 is broadly associated with RNA polymerase II occupancy at the TSSs of active gene expression [12] and H3K4me3 was thought to regulate gene transcription [13]. Here, RT-PCR was used to determine the expression of eight HT-associated genes from our gene list (CCL2, ICAM1, CXCL8, CXCL10, IL-18, TRAIL, ITGA4 and FASLG), all of which showed H3K4me3 enrichment in the promoter. The mRNA expression of three genes (ICAM1, CCL2 and CXCL8) was elevated in primary thyrocytes from HT patients (n = 16, p < 0.05). No significant difference of mRNA expression was seen for the remaining five genes (p > 0.05) (Figure 4).
Figure 4
RT-PCR validation for transcriptional expression of eight genes with increased H3K4me3 enrichment. mRNA level normalized to control group (n = 16). Statistically significant differences are shown as *p < 0.05, **p < 0.01. Fold-changes for CCL2, CXCL8 and ICAM1 were 1.81, 1.67 and 1.71, respectively. No differences in expression were found for the other five genes (p > 0.05)
HT – Hashimoto’s thyroiditis, CON – age- and sex-matched controls.
Global H3K4me3 expression in thyrocytes and thyroid tissues
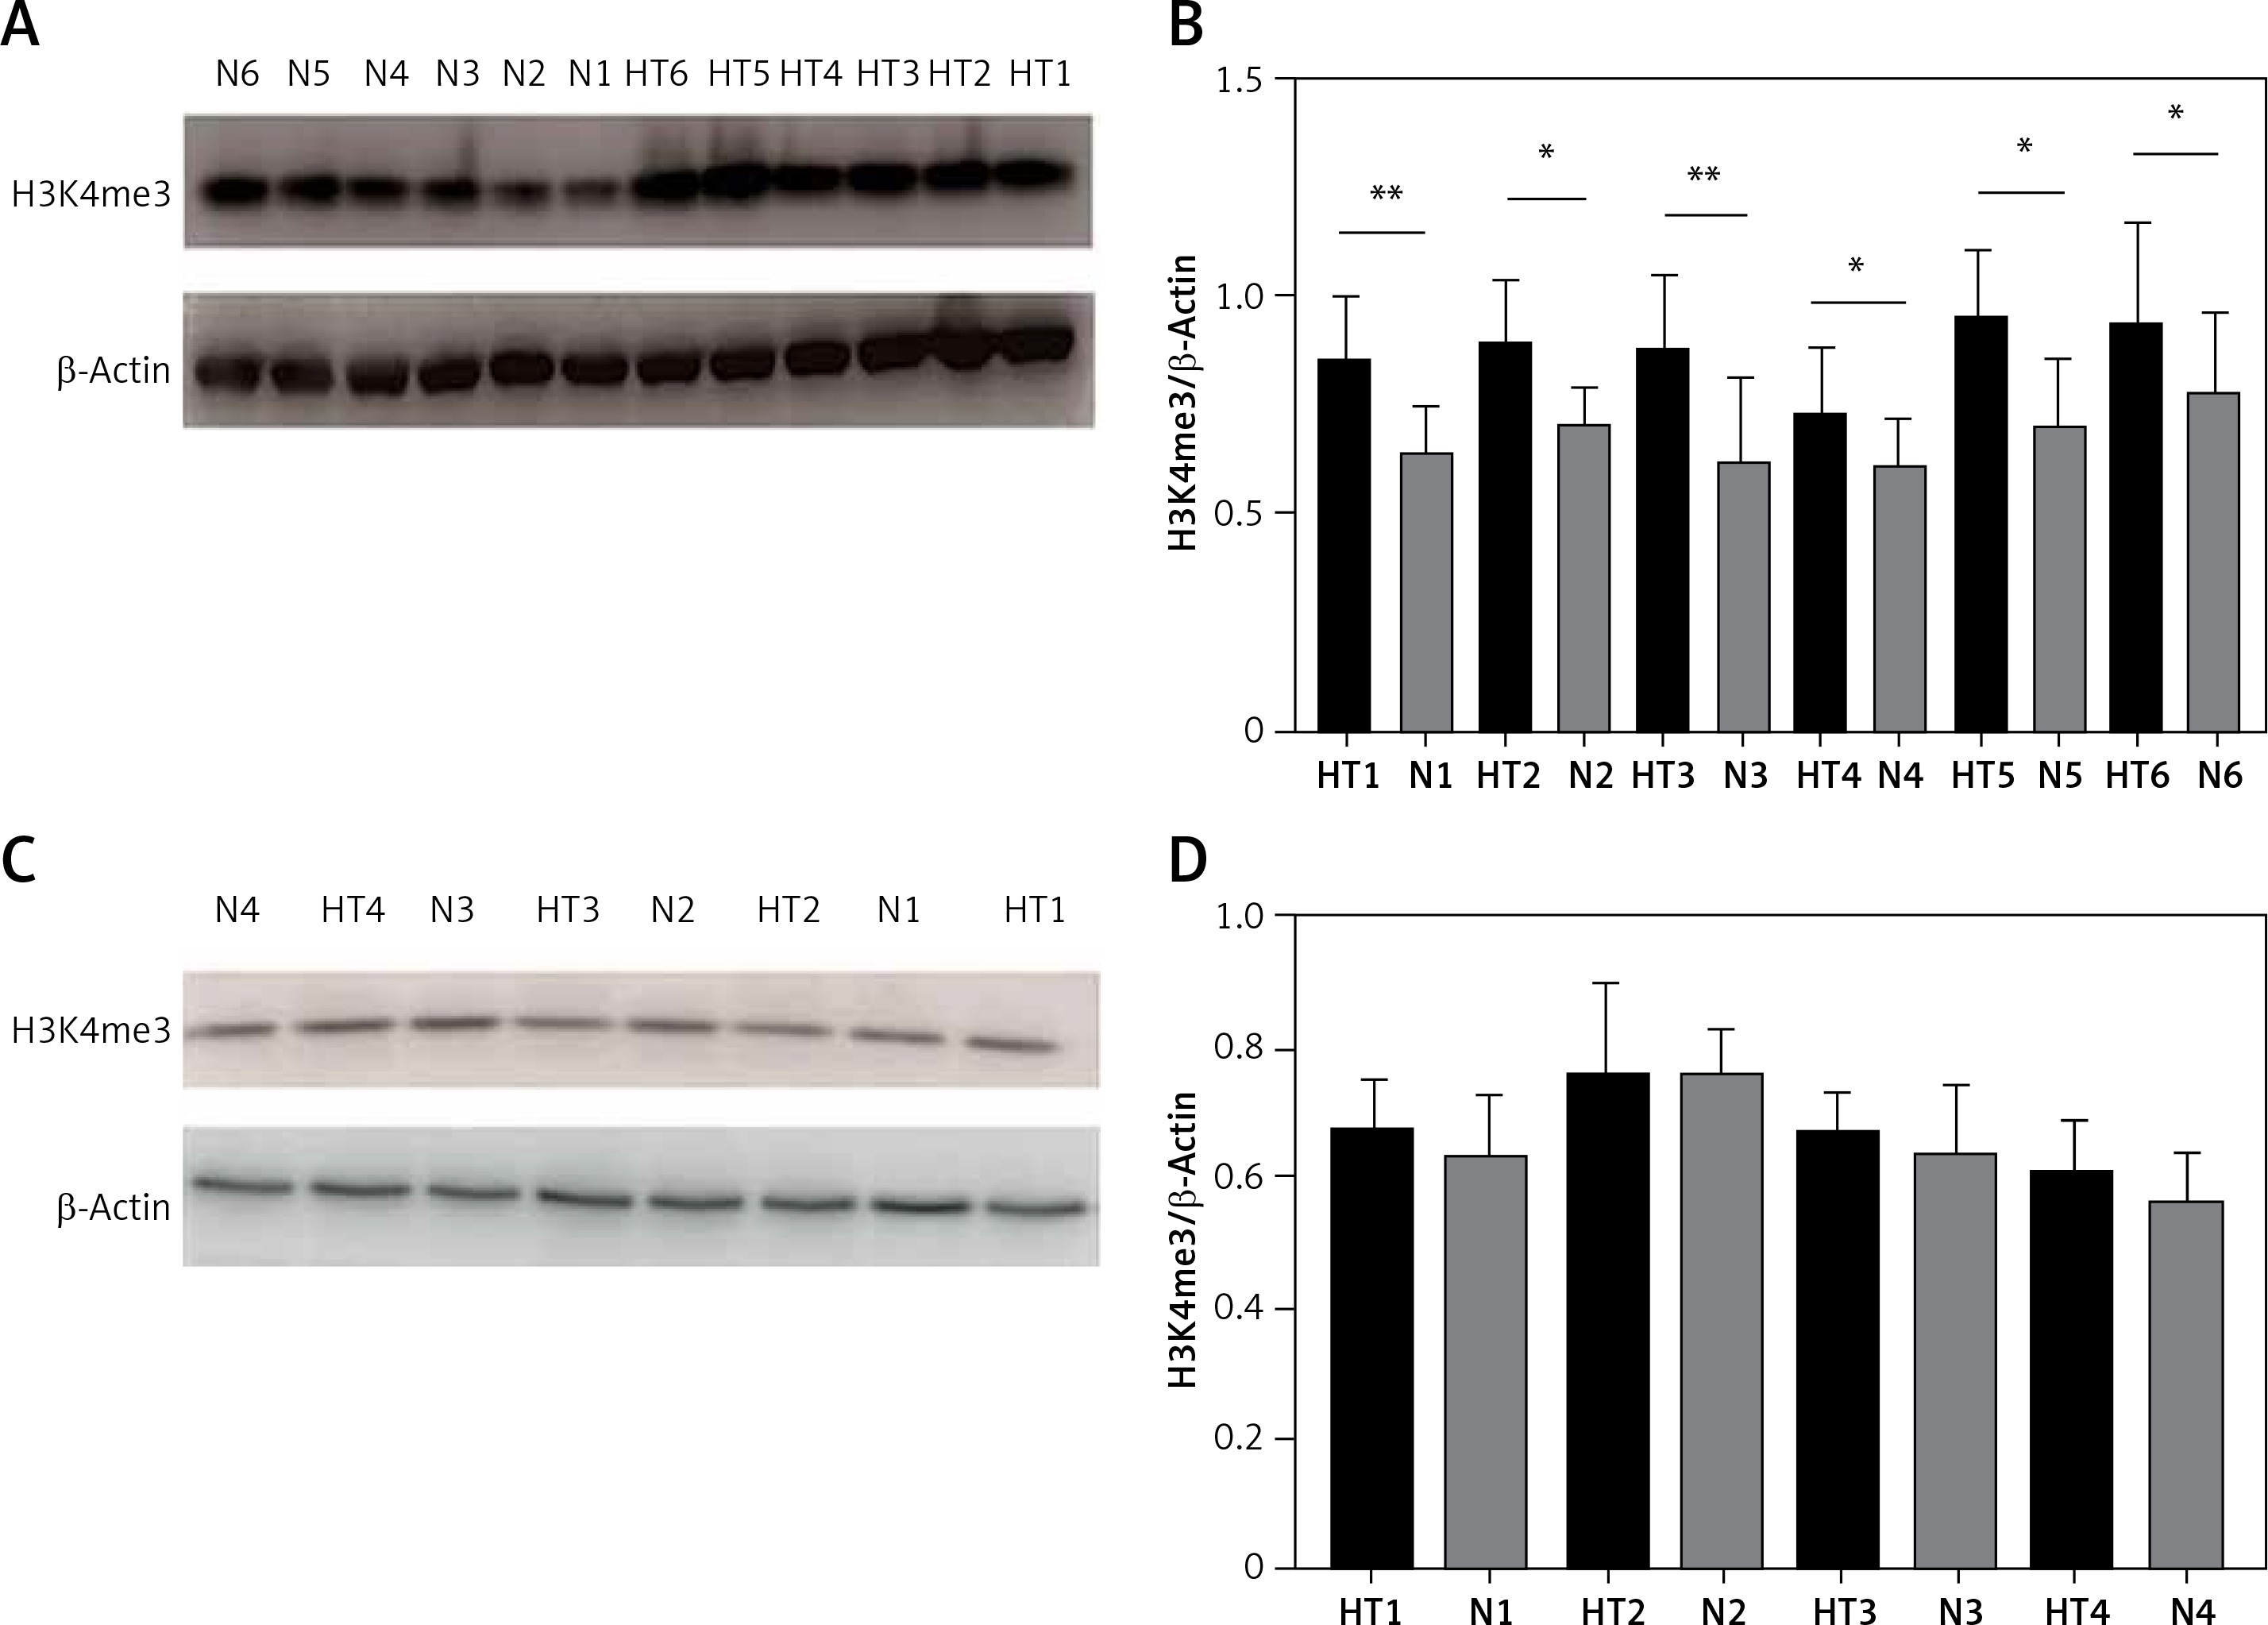
We next investigated global H3K4me3 levels of TFCs (n = 8) and thyroid tissues (n = 12). Global H3K4me3 protein levels were slightly, but not significantly (p > 0.05), higher in primary cultured thyrocytes from HT patients (Figure 5). The difference in H3K4 trimethylation of TFCs was focused mainly on certain genes, whereas overall methylation was unchanged. Compared with the control group, however, global H3K4me3 protein levels were significantly elevated in thyroid tissues from HT patients (p < 0.05).
Figure 5
Detection of global H3K4me3 protein expression by immunoblotting. A – Global H3K4me3 protein expression was markedly enhanced in HT thyroid tissues (n = 12). B – Bar graphs depicting global H3K4me3 protein expression from tissues. C – Global H3K4me3 protein expression of primary cultured thyrocytes in HT was slightly, but not significantly, higher (n = 8). D – Bar graphs depicting global H3K4me3 protein expression in thyrocytes (p > 0.05)
Statistically significant differences are shown as *p < 0.05, **p < 0.01. HT – Hashimoto’s thyroiditis, N – age- and sex-matched controls.
Detection of H3K4 methyltransferases
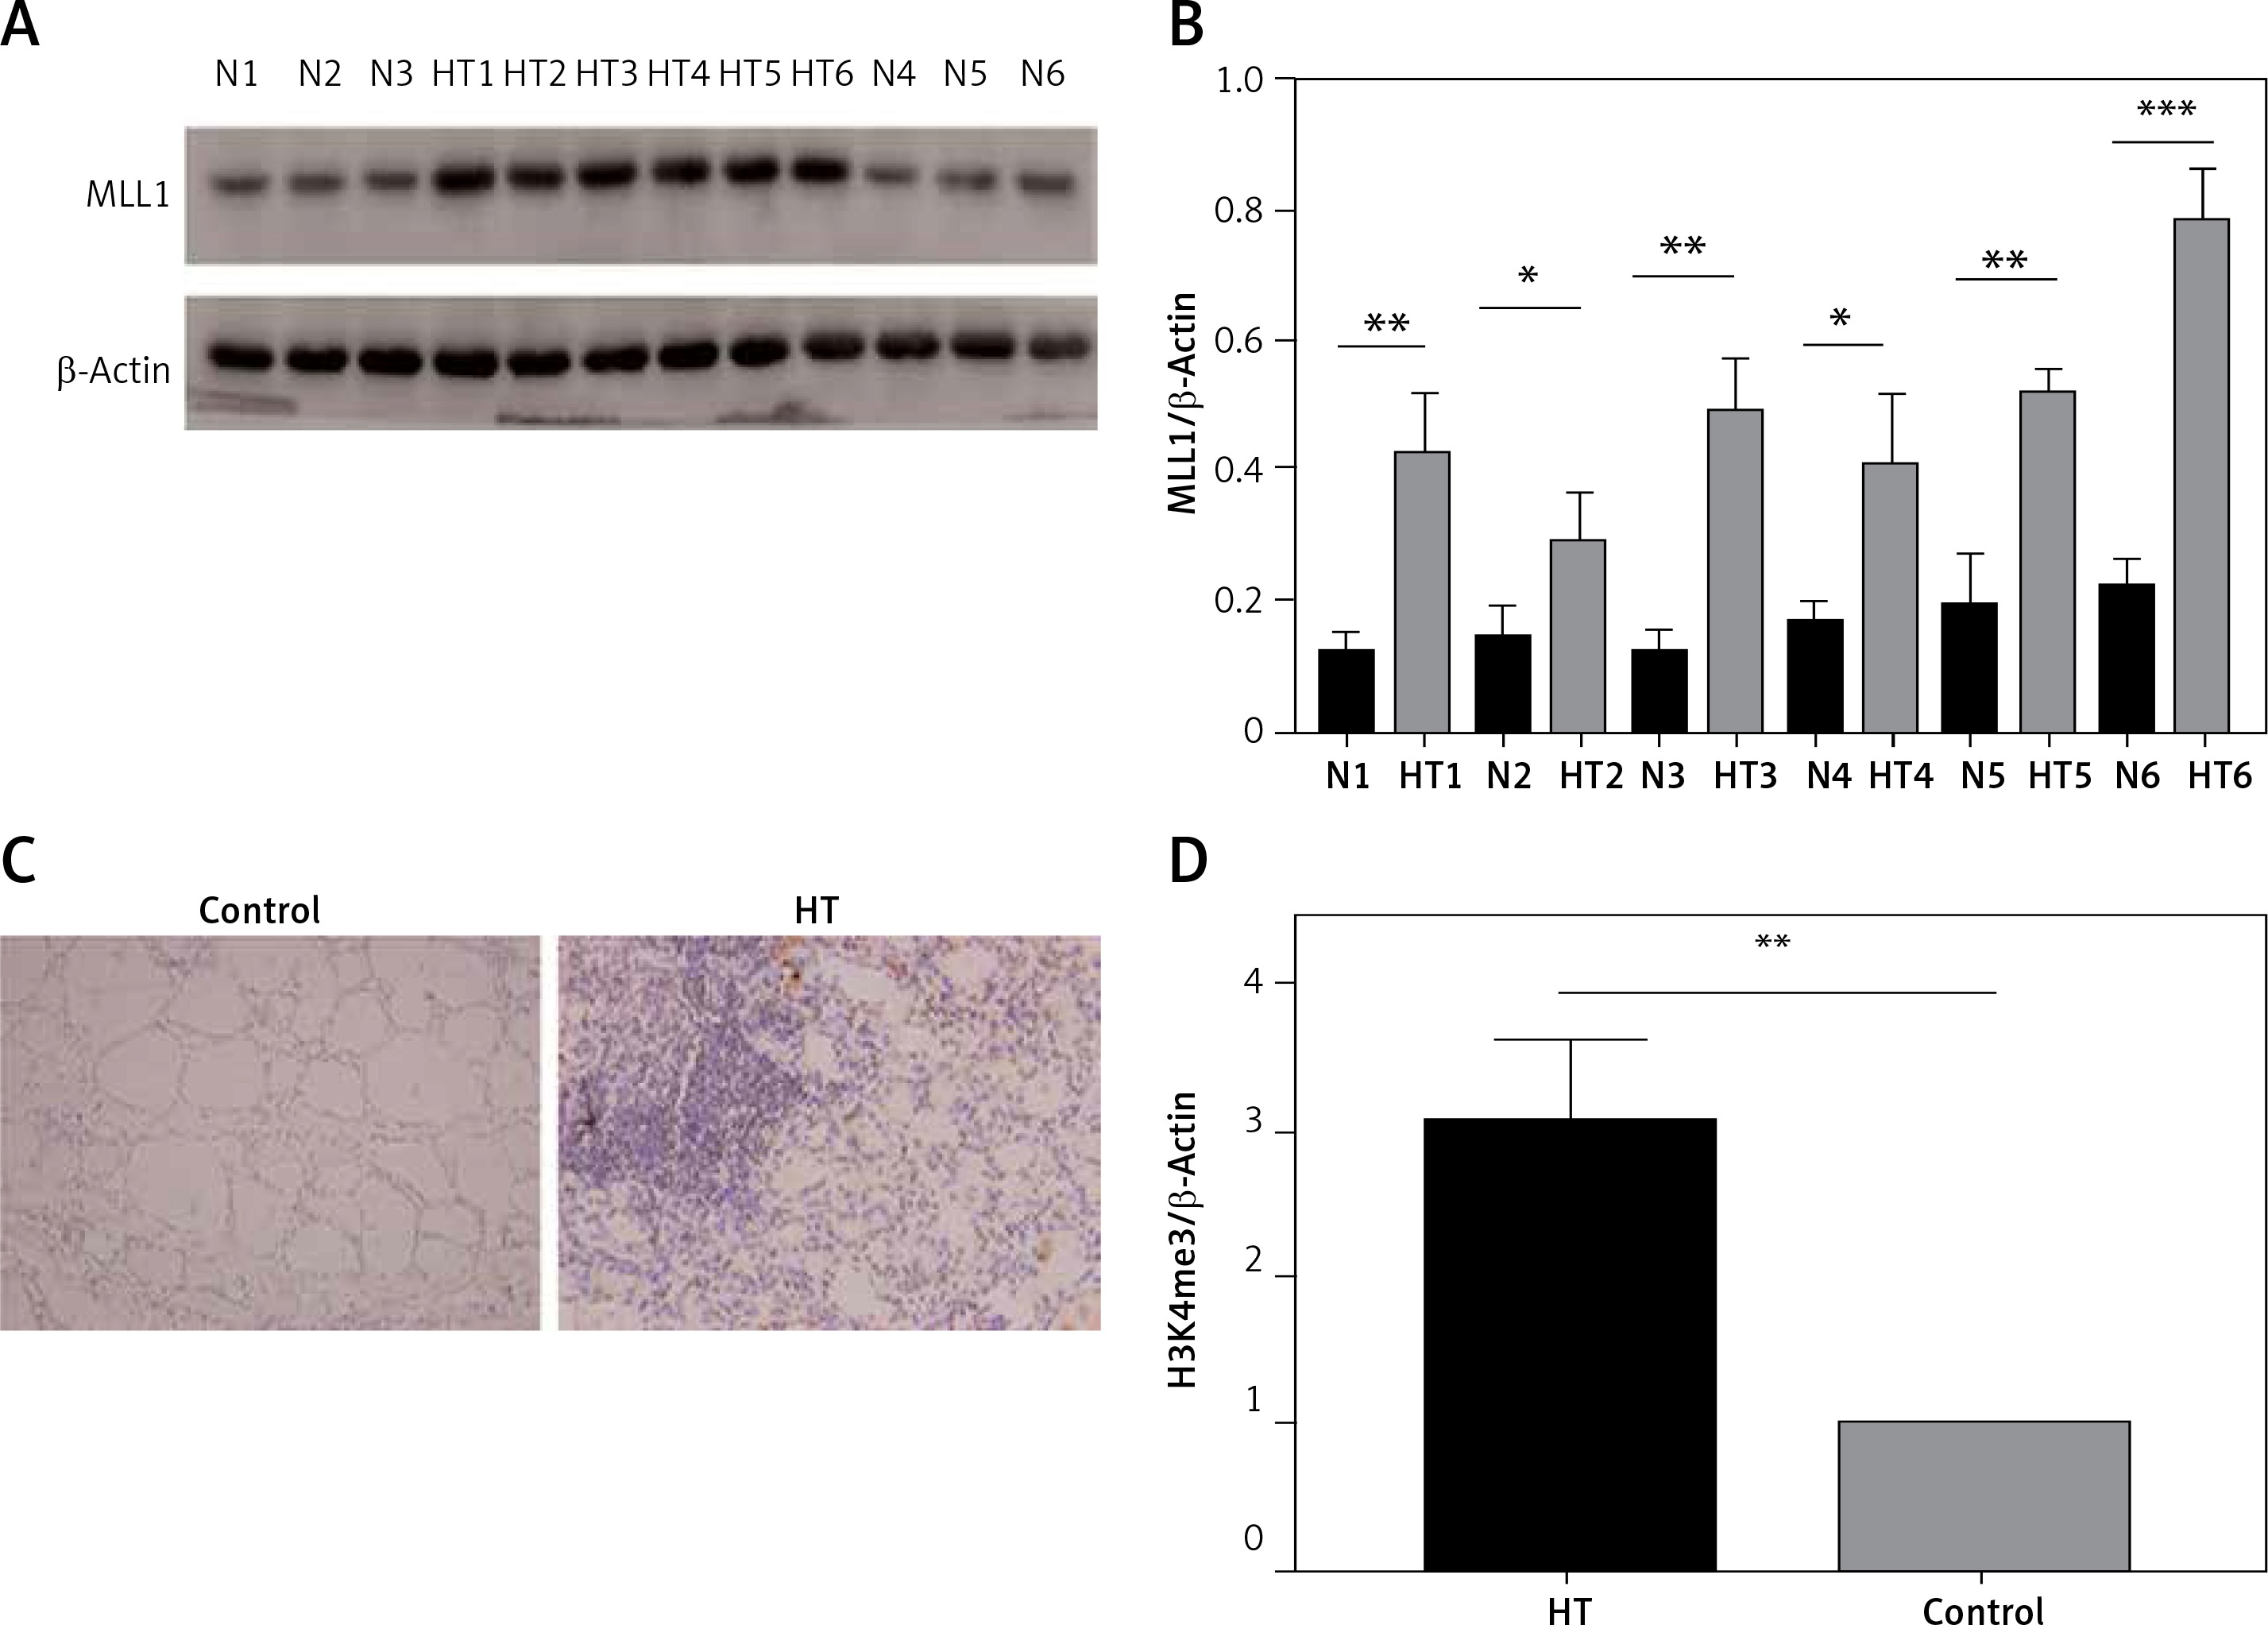
Because the MLL family of methyltransferases is known to be mainly responsible for methylation of H3K4 to influence genome transcription, we next investigated whether family members, including MLL1, LL2, MLL3, MLL4 and other methylation state-modifying enzymes, including SET7/9 (SET domain containing 7) and ASH1L (ASH1-like histone lysine methyltransferase), are associated with H3K4 trimethylation in thyroid tissues. We found that mRNA expression of MLL1 was markedly increased (n = 60, p < 0.05) (Figure 6). Immunoblotting and immunohistochemistry were then used to examine protein levels of MLL1 from a small number of samples (n = 16). Consistent with mRNA expression levels, protein expression of MLL1 was significantly increased in thyroid tissues from HT patients (p < 0.05) (Figure 7).
Figure 6
mRNA levels of H3K4 methyltransferases in thyroid tissues from HT patients and controls. Transcriptional expression of MLL1 was elevated in thyroids from HT patients (n = 60). GAPDH was used as an endogenous reference
Statistically significant differences are shown as *p < 0.05. HT – Hashimoto’s thyroiditis, CON – age- and sex-matched controls.
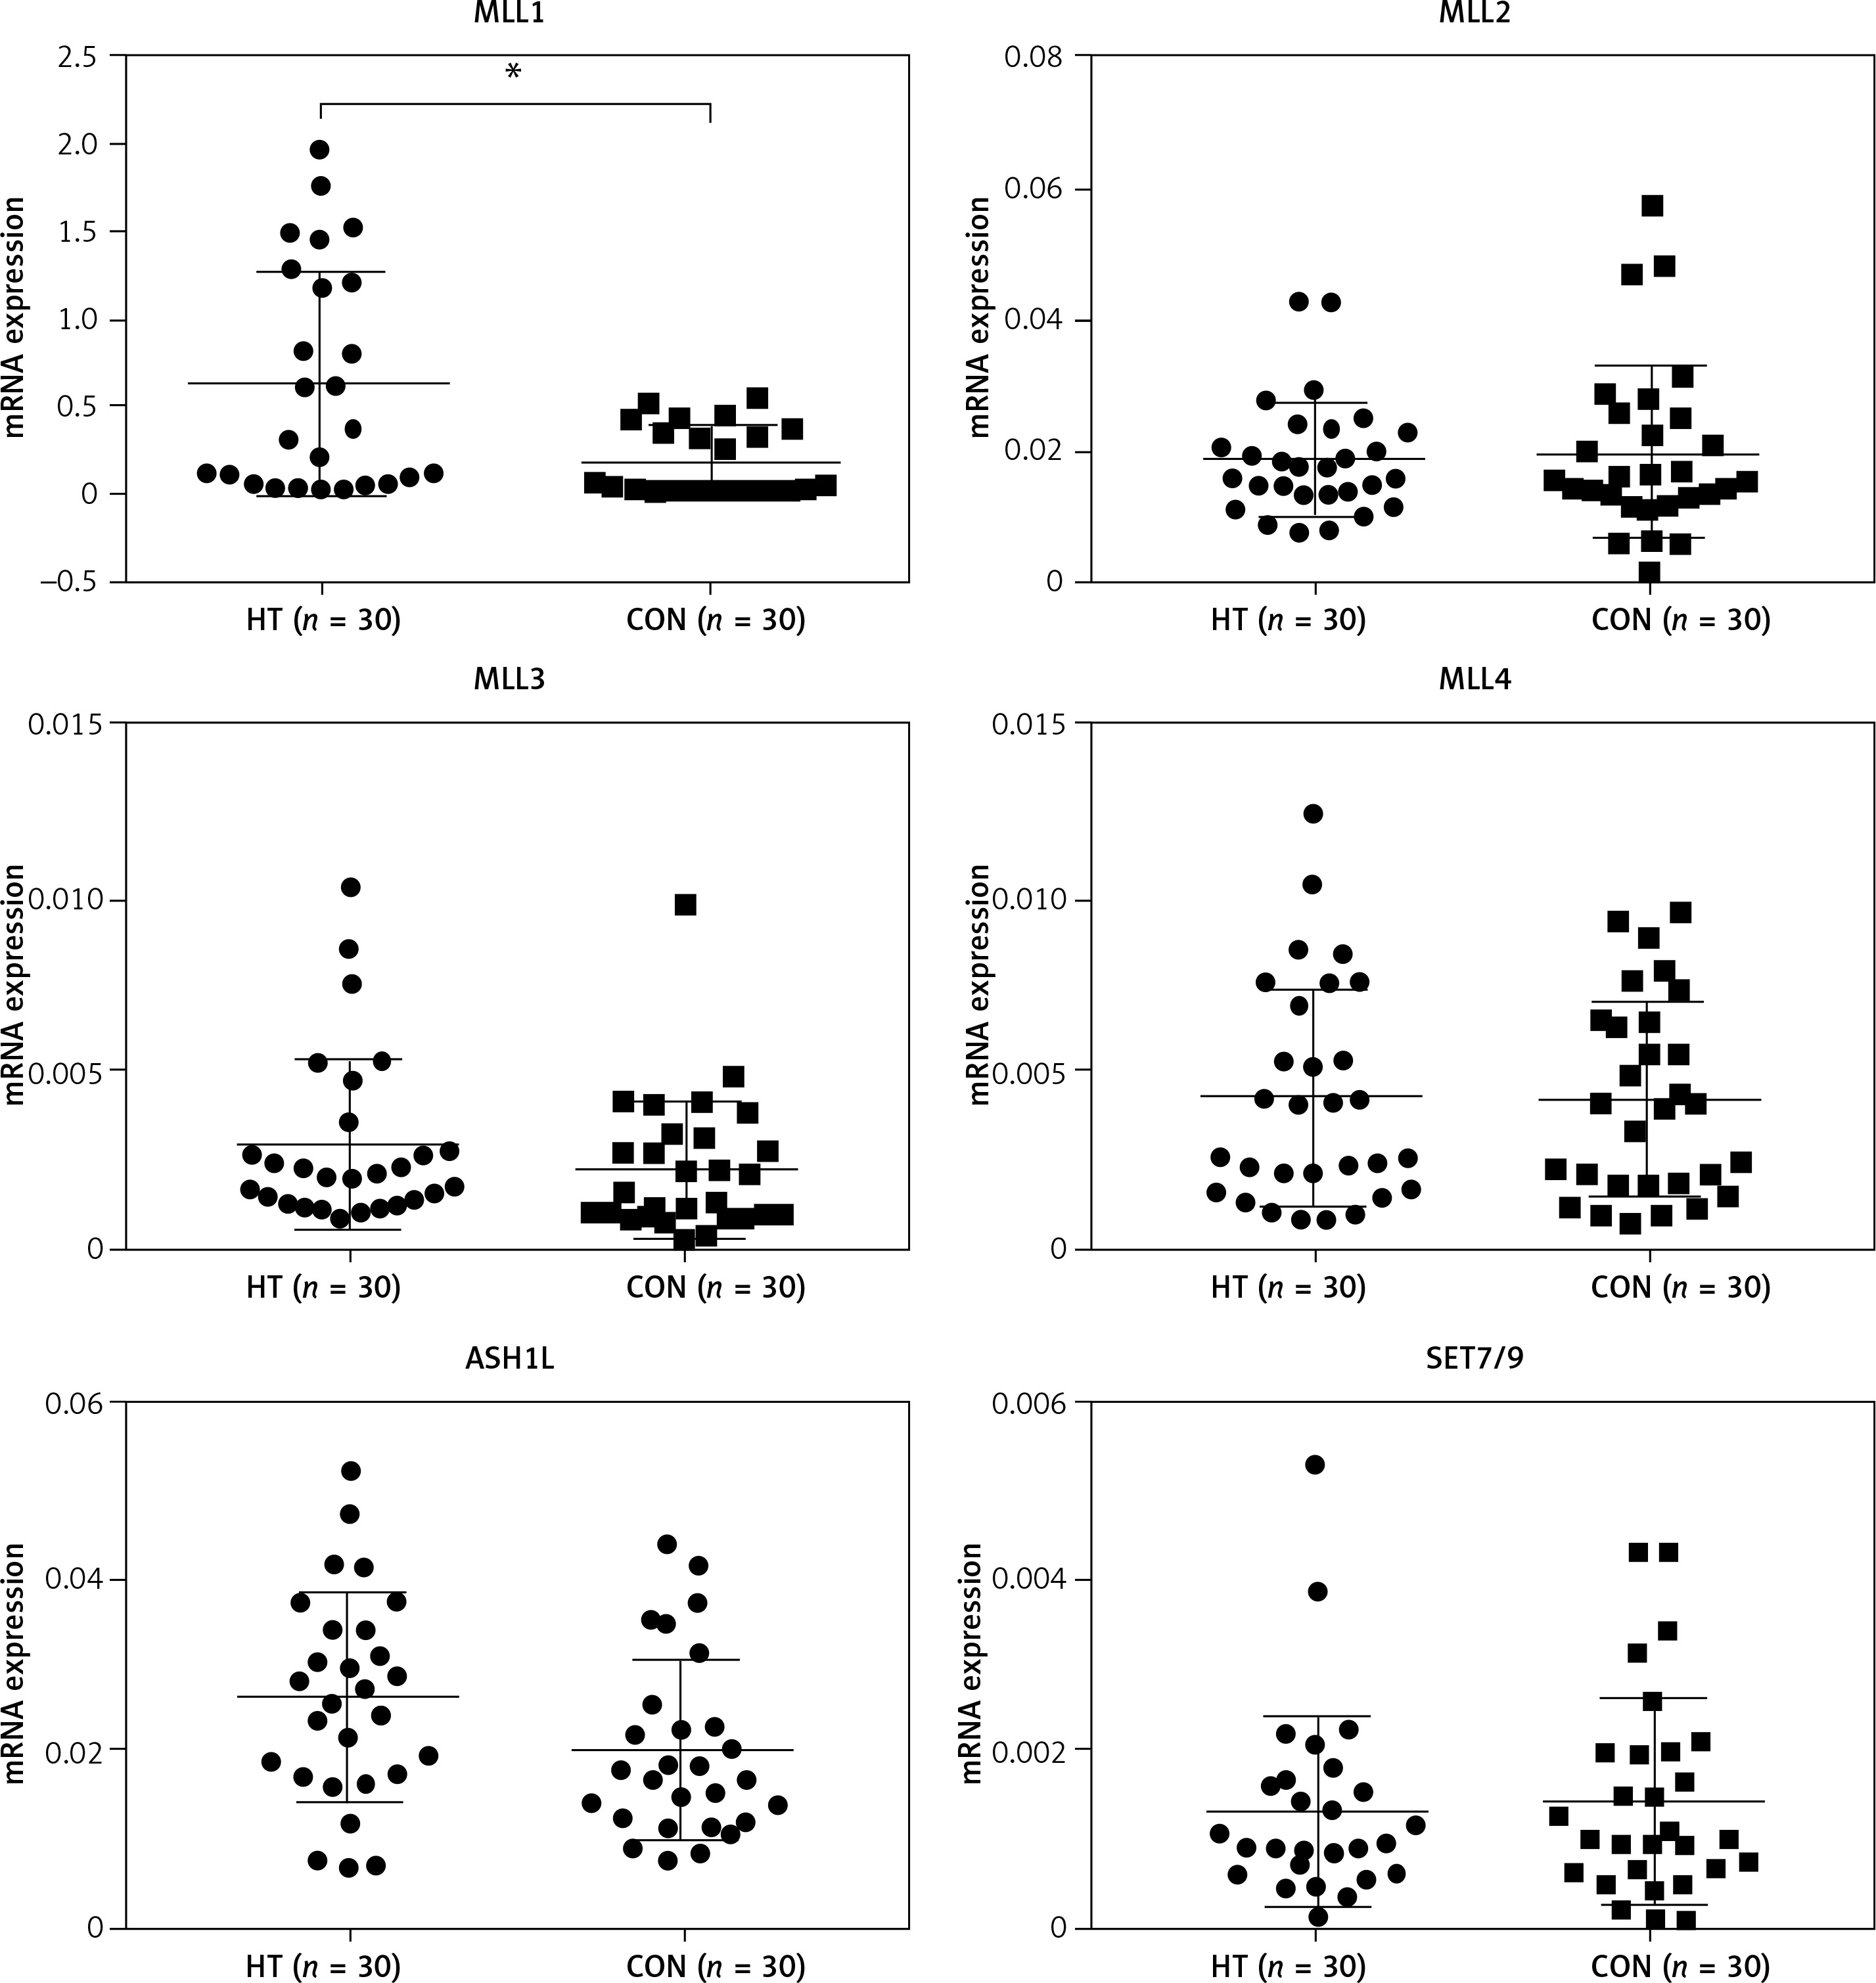
Figure 7
Protein expression of MLL detected in thyroid tissues from HT patient and controls. A – Protein expression of MLL1 in thyroid tissue from HT patients and controls (n = 12); B – bar graphs depicting MLL1 protein expression by immunoblotting; C – protein expression of MLL1 in thyroid tissue from HT patients and controls (n = 16); D – bar graphs depicting protein expression of MLL1 by immunohistochemistry
Statistically significant differences are shown as *p < 0.05, **p < 0.01, ***p < 0.01. HT – Hashimoto’s thyroiditis, N – age- and sex-matched controls.
Discussion
To the best of our knowledge, this is the first study to explore the role of H3K4me3 in primary cultured thyrocytes and thyroid tissues from HT patients, from a genomic and overall perspective. H3K4me3 is specifically located at the 5′ end of the ORF and is considered to be a marker of gene activation [14]. We found that genes with increased H3K4me3 in primary thyrocytes from HT patients were mainly focused on the adhesion molecule pathway and the autoimmune thyroiditis pathway. We identified six genes, i.e. TG, TSHR, CTLA4, MHCII, FASLG and CD80/86, in the pathway of autoimmune thyroiditis, four of which were already confirmed to be closely related to AITD [3].
TG is thought to be a crucial antigen and apparent target gene in thyroid autoimmunity. Recently, single nucleotide polymorphism of A/G present in the TG promoter region was found to be associated with the transcription factor IRF-1 binding with enrichment in histone H3 acetylation and H3K4 mono-methylation at the same site [15]. Our ChIP-seq found increased H3K4me3 enrichment in the TG promoter region, providing a possible connection between epigenetic modification and genetic background. Furthermore, we found enhanced H3K4me3 enrichment in the promoter regions of genes encoding inflammation-associated molecules, including ICAM1, CCL2 (MCP-1), CXCL8, IL-8, CXCL10 (IP10), IL-18 and ITGA4, together with genes involved in apoptosis, including the apoptosis-related genes TRAIL and FASLG. mRNAs of CCL2, ICAM1 and CXCL8 were also highly expressed in thyroid cells of HT patients.
Cytokines play an important role in regulating immune cells and targeting the TFCs. Cytokine produced by TFCs can be augmented by proinflammatory factors in vitro, and this may be important in enhancing the activity of the infiltration in vivo, creating a vicious cycle that perpetuates the inflammatory reaction [16]. CCL2 (MCP-1), a cytokine that attracts monocytes as well as T-lymphocytes, is expressed in cultured human thyrocytes and can be upregulated by stimulation with inflammatory cytokines [17]. The expression of CCL2 in HT thyroid tissues has been confirmed by others [18]. CCL2 has also been reported to be regulated by H3K4me3 in the promoter region after stimulation by TNF-α [19], which is consistent with our own results. It has been suggested that ICAM1 is expressed on thyrocytes from patients with AITD and from NOD.H2h4 mice, and can be enhanced by iodine and IFN-γ [20–22]. A recent study demonstrated decreased DNA methylation in the promoter of ICAM1 at three loci that were positively associated with ICAM1 mRNA expression. H3K4 methylation has been shown to play a role in blocking de novo DNA methylation at specific loci [23]. Our findings of increased H3K4me3 in the ICAM1 promoter suggest avenues for further investigation. CXCL8 (IL-8), a chemoattractant for lymphocytes, was found at higher levels in TFCs from patients with Graves’ disease (GD) [24]. Polymorphisms of MCP1, ICAM1 and IL8 have also been reported to have possible associations with the pathogenesis of AITD [25]. Our research confirmed the expression of these genes and suggested the possibility for transcriptional regulation from an epigenetic perspective.
We failed to find differential expression of the other remaining genes. There is a possibility that RT-PCR experiments with small samples (n = 16 in this study) have weak statistical power to detect minor change in expression or the aberrant H3K4me3 enrichment detected here could not impact gene expression. Moreover, although there is generally a strong genome-wide correlation between H3K4me3 levels and gene expression, the same is not necessarily true for any specific gene, since gene regulation is a complex process regulated by many factors.
The overall protein level of H3K4me3 was significantly elevated in thyroid tissue from HT patients, but this phenomenon was not observed in primary cultured thyroid cells. One of the pathological manifestations of autoimmune disease is massive infiltration of lymphocytes and monocytes into the thyroid gland. The aberrant overall protein levels of H3K4me3 may be explained by changed H3K4 trimethylation in lymphocytes and monocytes from patients’ thyroid tissues. One study suggested that LPS stimulation resulted in enhanced H3K4me3 in macrophages [26]. Recently, H2O2 has been found to cause a decrease in the activity of Fe2+ and α-ketoglutarate-dependent histone lysine demethylases, resulting in an increase in global H3K4me3 levels [27]. The global changes in H3K4me3 could be indicative of some pathological process and further in-depth studies are needed to clarify this.
MLL1 was originally identified for its important role in leukemia and has been shown to have a role in innate immunity. MLL1 can be recruited by NF-κB to the promoters of TNF-α and MMP9, and can regulate genes downstream of NF-κB, including CCL2, by influencing the chromatin, suggesting a role for MLL1 in NF-κB-mediated signaling [28, 29]. Recently, MLL1 was reported to regulate macrophage-mediated inflammation in diabetic wound repair [30]. In this study, we found that MLL1 is enhanced in thyroid tissue from patients with autoimmune thyroiditis, suggesting that it may have an effect on overall H3K4 tri-methylation and may be involved in the development of HT.
In conclusion, our results demonstrated, for the first time, the genome-wide pattern of H3K4me3 in primary thyrocytes from HT patients. Genes enriched in the autoimmune thyroiditis pathway, including the promoter of TG, showed differential H3K4me3 enrichment. ICAM1, CCL2 and CXCL8 also had increased enrichment of H3K4me3 around the TSSs, which was associated with increased gene expression. Protein levels of global H3K4me3 and the methyltransferase MLL1 were found to be elevated in thyroid tissues from HT patients. The present study thus provides a starting point to identify the epigenetic marks and associated genes involved in HT.