

Introduction
The incidence of breast cancer (BC) is increasing, resulting in high mortality and becoming the second leading cause of death among women [1]. The American Cancer Society annually assesses global cancer incidence rates. According to the latest data, in 2019, the estimated BC cases and deaths were 271,270 and 42,260, respectively [2]. Although early diagnosis can reduce BC mortality, BC prevention and control remain a matter of public concern [3]. Breast cancer is a clinically and biologically heterogeneous disease, and accurate prognostic prediction is very important for BC treatment planning [4, 5]. In addition, it is critical to improve overall clinical outcomes for patients. Therefore, it is urgent to establish an effective prognostic model for predicting the overall survival (OS) of BC patients to guide clinical practice.
It was found that leucocytes made a connection between cancer and inflammation. The “lymphoreticular infiltrate” reflects the origin of cancer at sites of chronic inflammation [6]. Since then, the role of inflammation in cancer has become the focus of research [7-9]. Inflammation is an important cause of cancer development. Inflammatory factors and their receptors are associated with the development of BC from multiple aspects [10]. Studies have shown that inflammation promotes and inhibits cancer [7, 11]. By analyzing parameters that are routinely available in blood, we can explore the relationship between cancer and inflammatory molecules. Studies have demonstrated the presence of many features associated with inflammation in patients with liver cancer [12]. The inflammatory infiltrate is a prognostic marker in BC [13]. It is revealed that different inflammatory pathways play a role in preinvasive and invasive BC [10]. Despite progression in the field of BC associated with inflammation, the underlying mechanisms of BC remain largely unknown [1].
Herein, we downloaded mRNA expression profiles and corresponding clinical data of BC patients, followed by construction of the prognostic signature using differentially expressed genes (DEGs) associated with inflammatory responses. The model’s stability and reliability were validated in the Gene Expression Omnibus (GEO) dataset. Then, we further performed functional analysis to explore its underlying mechanisms. Furthermore, we analyzed the association between prognostic gene expression and immune infiltration.
Material and methods
Datasets
Expression profiles and corresponding clinicopathological information of 1050 BC tissues and 59 cases of normal breast tissue were obtained from the TCGA dataset (http://cancergenome.nih.gov/). Similarly, data of 1050 BC tissues were downloaded from GEO (http://www.ncbi.nlm.nih.gov/geo/) and data of 200 inflammation-related genes were downloaded from the MSigDB database (https://www.gsea-msigdb.org/gsea/msigdb/). For the dataset in TCGA, RNA sequencing data (FPKM value) and clinical information were downloaded from University of California Santa Cruz (UCSC) Xena (https://gdc.xenahubs.net). The DEGs between tumor tissue and healthy tissue were identified by the “limma” R package.
Construction and evaluation of prognostic inflammatory-related gene signature
Univariate Cox analysis was utilized to screen inflammatory-related genes with prognostic value. LASSO Cox regression analysis was used to construct the prognostic model. The risk score based on the expression level of inflammatory-related genes and its corresponding regression coefficient was calculated:
Based on the median risk score, patients were divided into high- and low-risk groups, and survival analysis was performed using the “survminer” R package to analyze the OS. The “survminer” R package and “timeROC” R package were used for time-dependent receiver operating characteristic (ROC) curve analysis to evaluate the predictive value of prognostic features.
Functional analyses of the inflammatory-related differentially expressed genes
To explore the enriched possible biological function and pathways of the inflammatory-related DEGs, we performed Gene Ontology (GO) and Kyoto Encyclopedia of Genes and Genomes (KEGG) enrichment analysis utilizing the DAVID tool with a statistical threshold of p < 0.05.
Estimate of tumor immune microenvironment cell infiltration
We utilized the single sample Gene Set Enrichment Analysis (ssGSEA) algorithm to quantify the relative abundance of each cell infiltration in BC tumor immune microenvironment (TIME). From Charoentong’s research, we obtained a gene set that marks the types of TIME infiltrating immune cells, which included a variety of human immune cell subtypes.
Gene-set variation analysis (GSVA)
We downloaded “c2.cp.kegg.v7.2.symbols” in MSigDB. To uncover pathway enrichment between low- and high-risk patients, we utilized the “GSVA” package in R to assign pathway activity conditions. Moreover, the “limma” package in R was used to display distinctions in pathway activation.
Immune checkpoint blocking genomic and clinical information collection
We conducted a systematic search for immune checkpoint blocking gene expression profiles. An immunotherapy cohort, advanced urothelial cancer (IMvigor210 cohort) intervened with the anti-PD-L1 antibody atezolizumab (atezolizumab), was finally included. Raw count data were normalized with log2 (count+1).
Quantitative real-time polymerase chain reaction (qRT-PCR)
Total RNA was reverse-transcribed into complementary DNA (cDNA). U6 and glyceraldehyde-phosphate dehydrogenase (GAPDH) expression levels served as normal controls. The gene expression was quantified using the 2–ΔΔCt method.
Statistical analysis
All statistical analysis was conducted in R version 3.5.3. The survival curve was generated by the Kaplan-Meier method, and the difference between groups was compared by the log-rank test. The Cox regression model was used for single factor and multivariate analysis, combined with other clinical characteristics to determine the independent prognostic value of the risk score. The ROC curve was utilized to estimate the predictive efficiency of the risk model for 1 year, 3 years, and 5 years. The p-value < 0.05 was considered statistically significant.
Results
Screening for differentially expressed inflammatory response genes related to prognosis
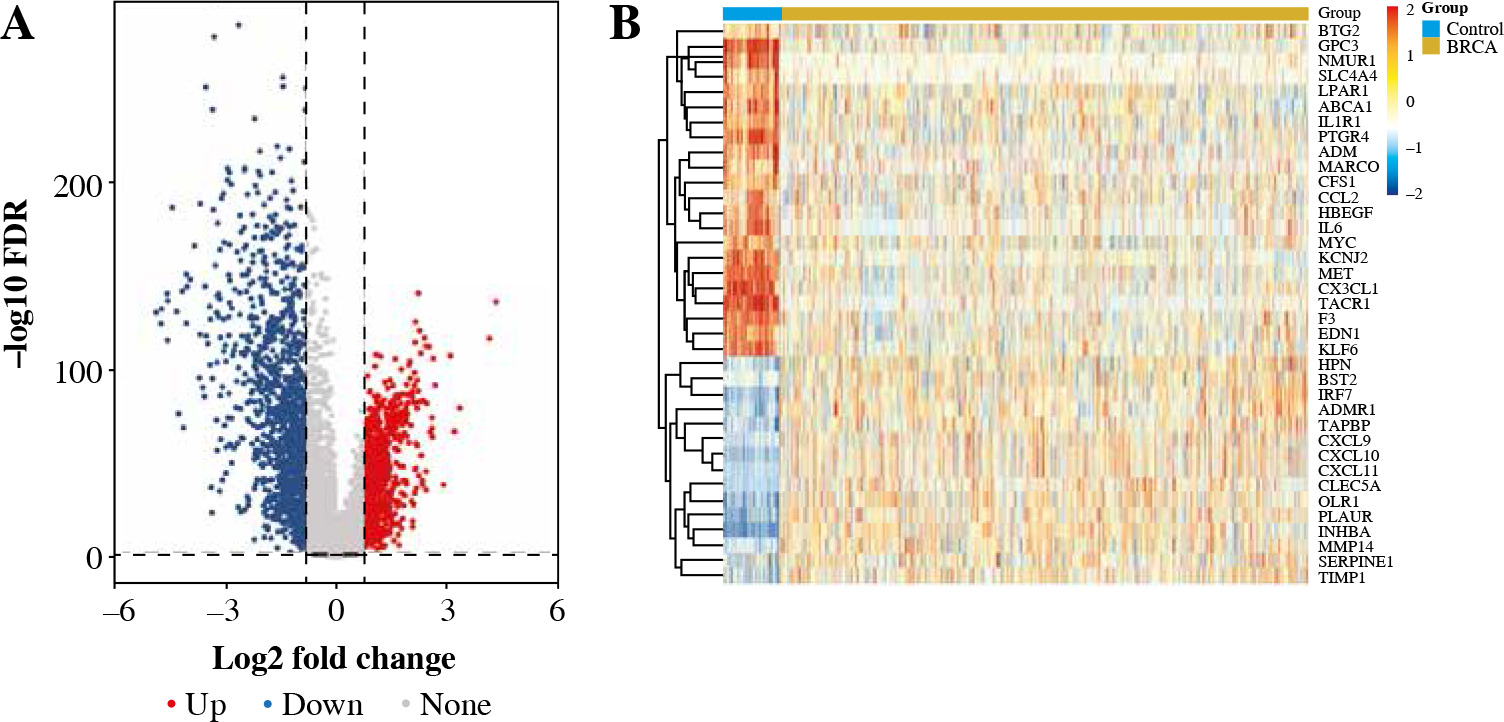
We collected and integrated RNA expression profiles from 1,050 BC samples and 113 healthy tissues included in the TCGA dataset. In total, 2425 genes were differentially expressed in BC tissues and paracancerous tissues. Among these, 37 genes were inflammatory response-related genes, as shown in Figure 1.
Enrichment analysis of DEGs associated with inflammatory response
In Figure 2, the results showed that inflammatory response-related DEGs were mainly distributed on the cell surface and the outer surface of the plasma membrane, and participated in the regulation of the inflammatory response, cell chemotaxis, and immune response through the activities of chemokines, receptor binding, and protein binding. The KEGG enrichment analysis showed that DEGs were mainly enriched in cytokine receptor interaction, the chemokine signaling pathway and Toll-like receptor. Interleukin 6 (IL-6) and chemokine (C-C motif) ligand 2 (CCL2) had more interactions with other genes in the protein-protein interaction (PPI) network analysis. This indicated that IL-6, CCL2 and other inflammatory response-related DEGs may play a crucial role in BC.
Fig. 2
Gene Ontology (GO) enrichment, Kyoto Encyclopedia of Genes and Genomes (KEGG) enrichment analysis and protein-protein interaction (PPI) network of differentially expressed inflammatory response-related genes Gene Ontology (GO) enrichment, Kyoto Encyclopedia of Genes and Genomes (KEGG) enrichment analysis and protein-protein interaction (PPI) network of differentially expressed inflammatory response-related genes

Construction of prognostic models
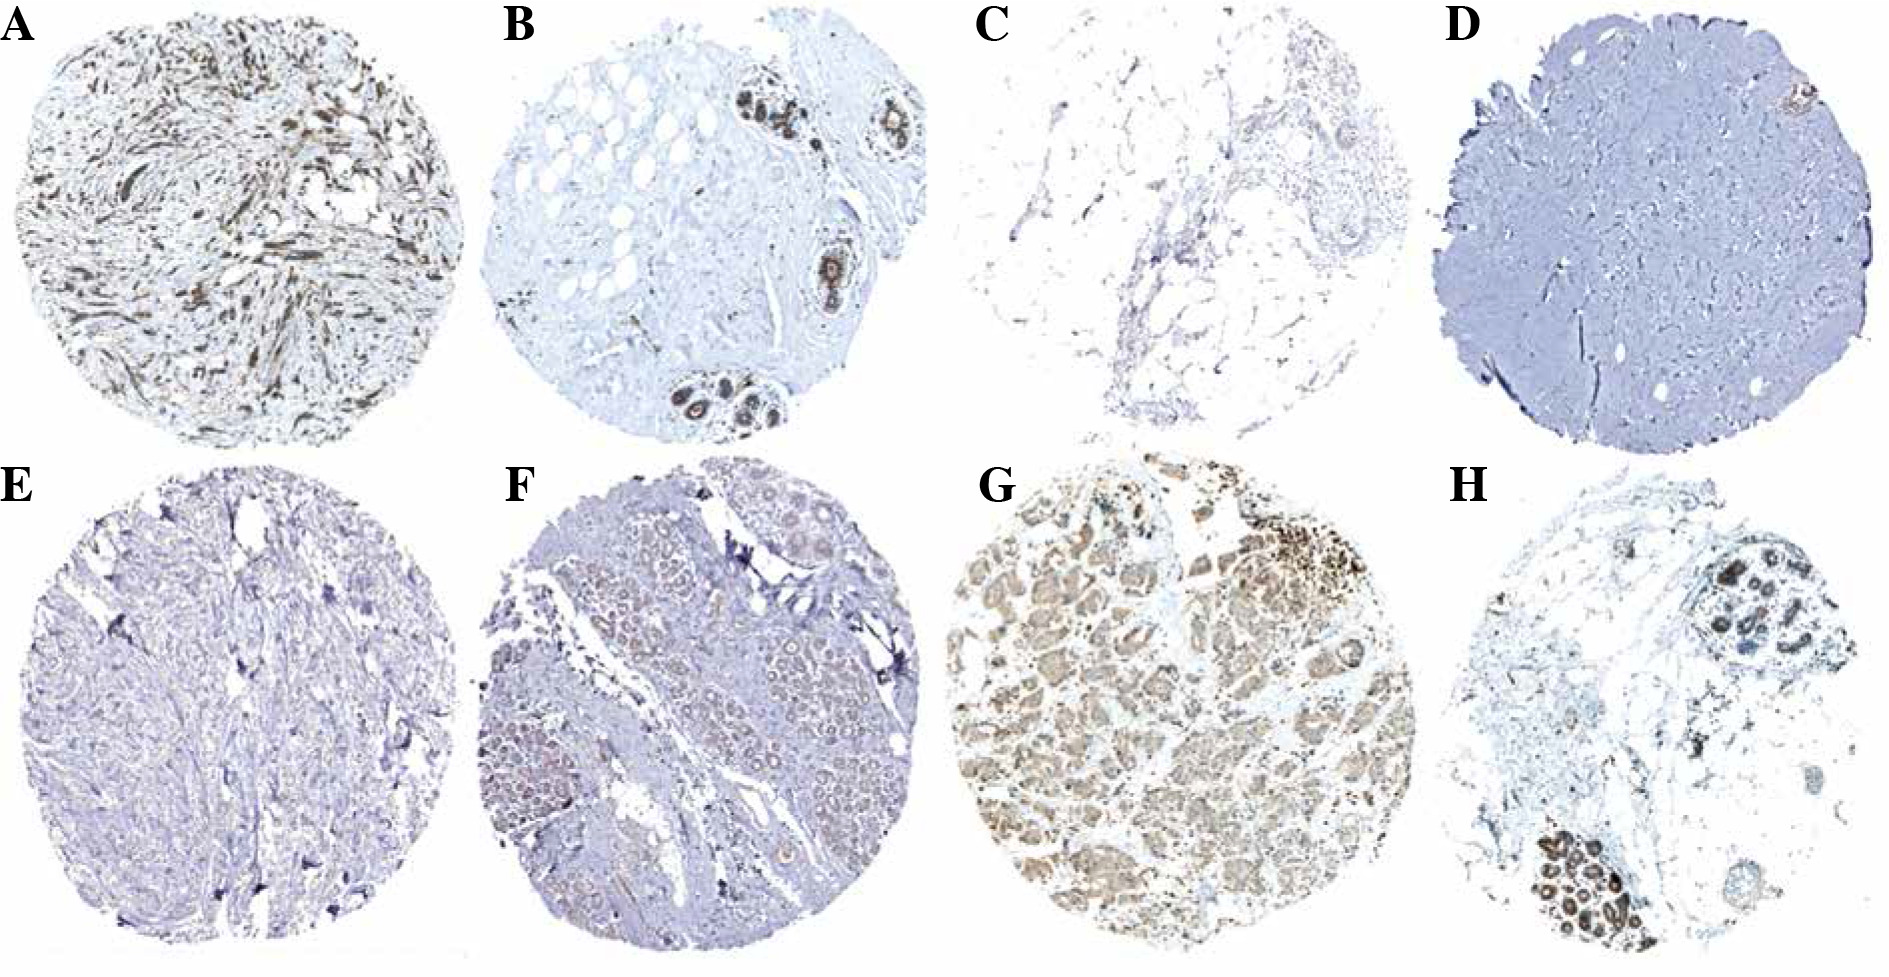
Univariate Cox analysis showed that 6 inflammatory response-related DEGs were associated with OS in BC, as shown in Figure 3A. Then, we used Lasso regression to obtain five candidate prognostic inflammatory response-related genes (Fig. 3B). Kaplan-Meier survival analysis showed that the prediction model possessed powerful capacity to predict the prognosis of BC patients, as shown in Figure 4. Furthermore, the protein levels of TACR1 and BTG2 in BC were lower than those in normal breast tissue, while levels of TAPBP and BST2 were higher than those in normal breast tissue, as shown in Figure 5.
Fig. 3
Construction of 5-inflammatory-gene signature. A) Univariate Cox analysis; B, C) Screening of 5-inflammatory-gene signature
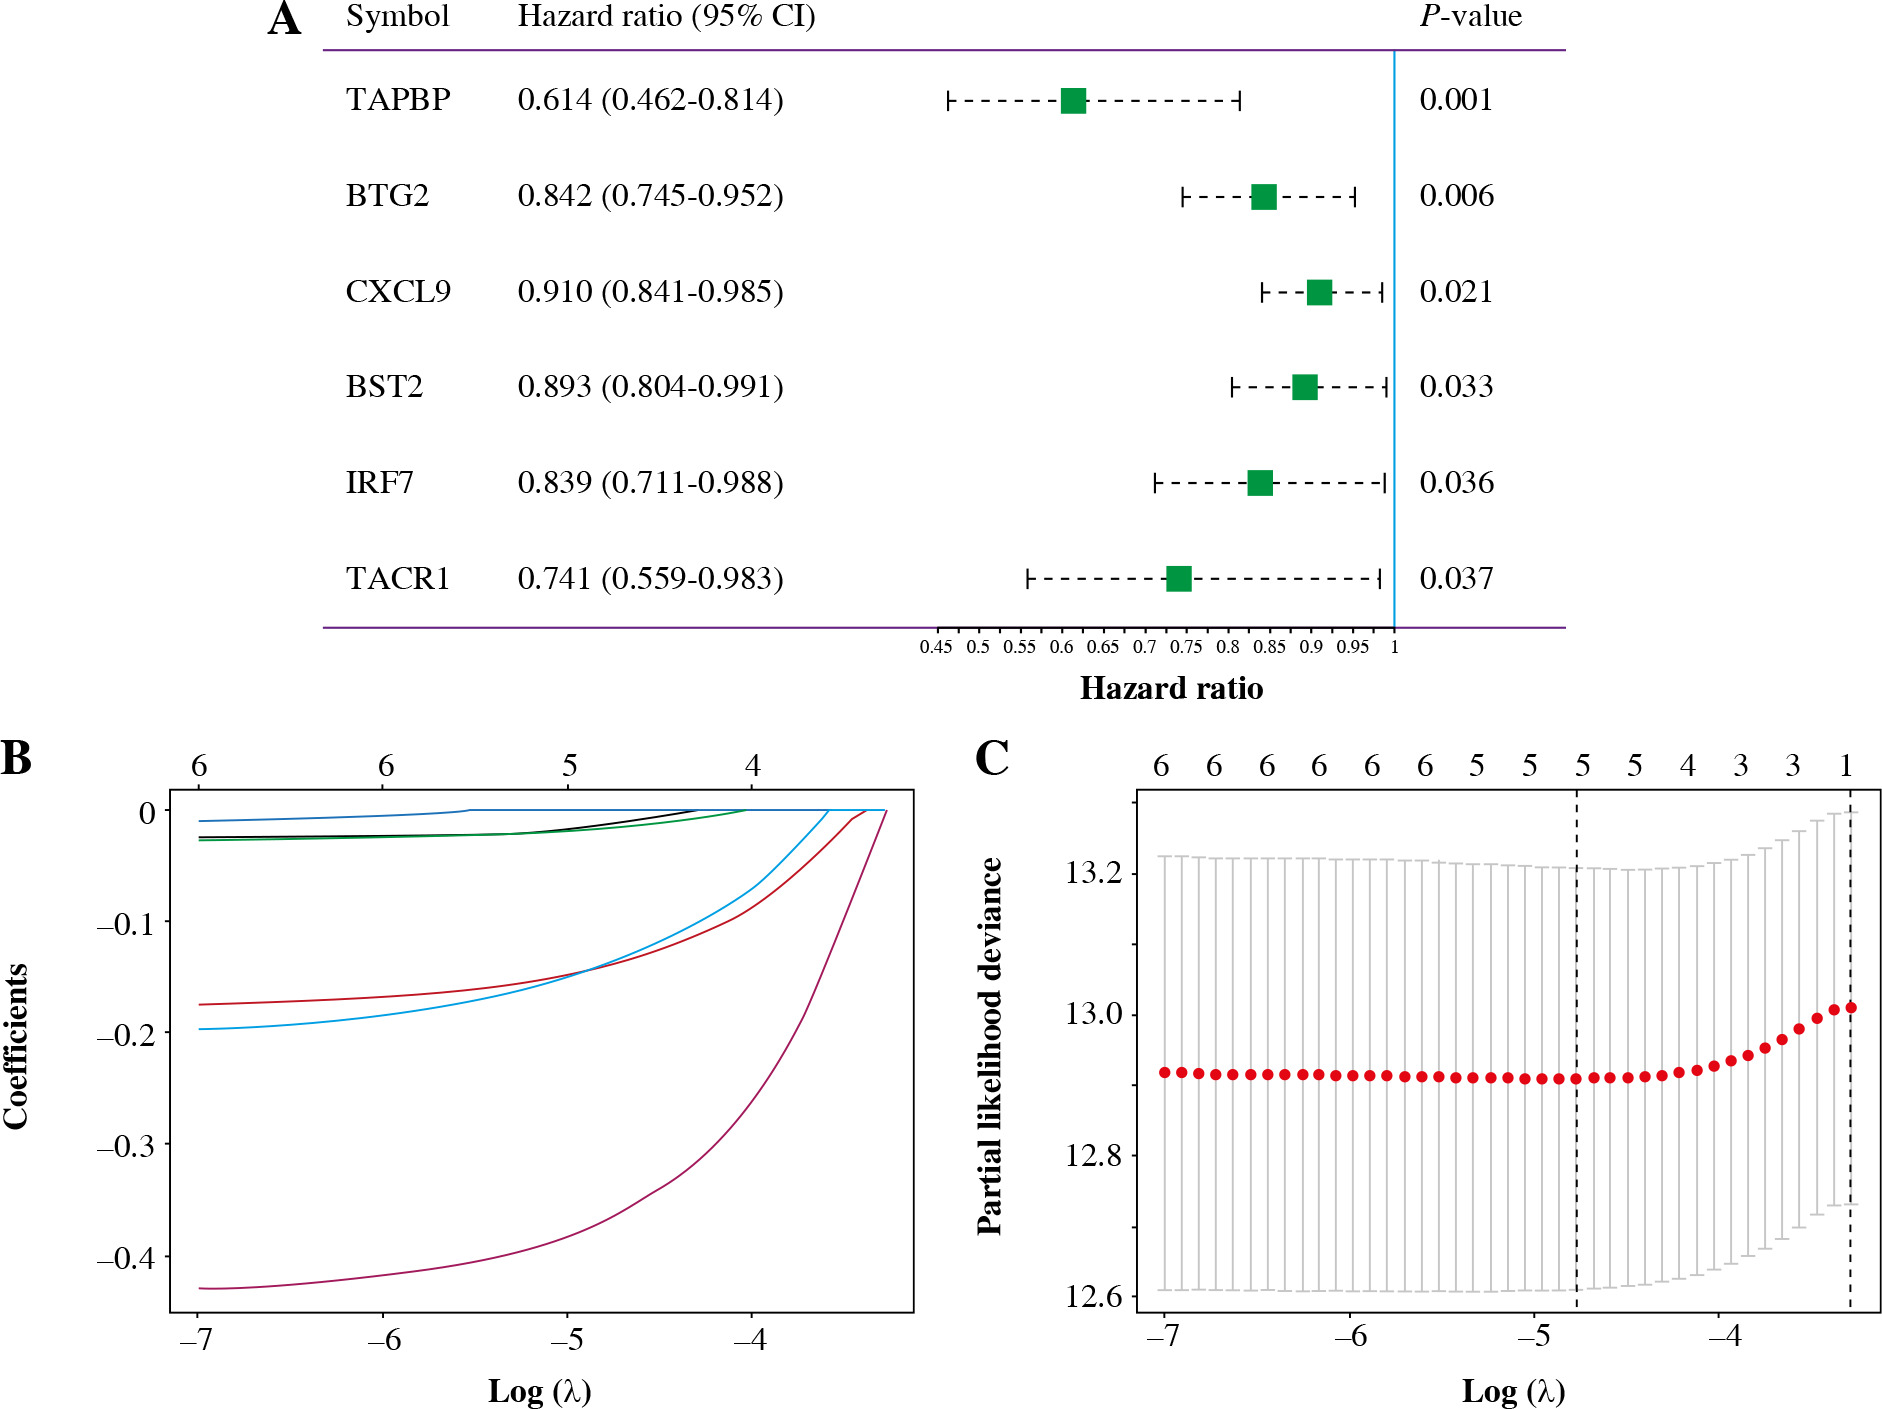
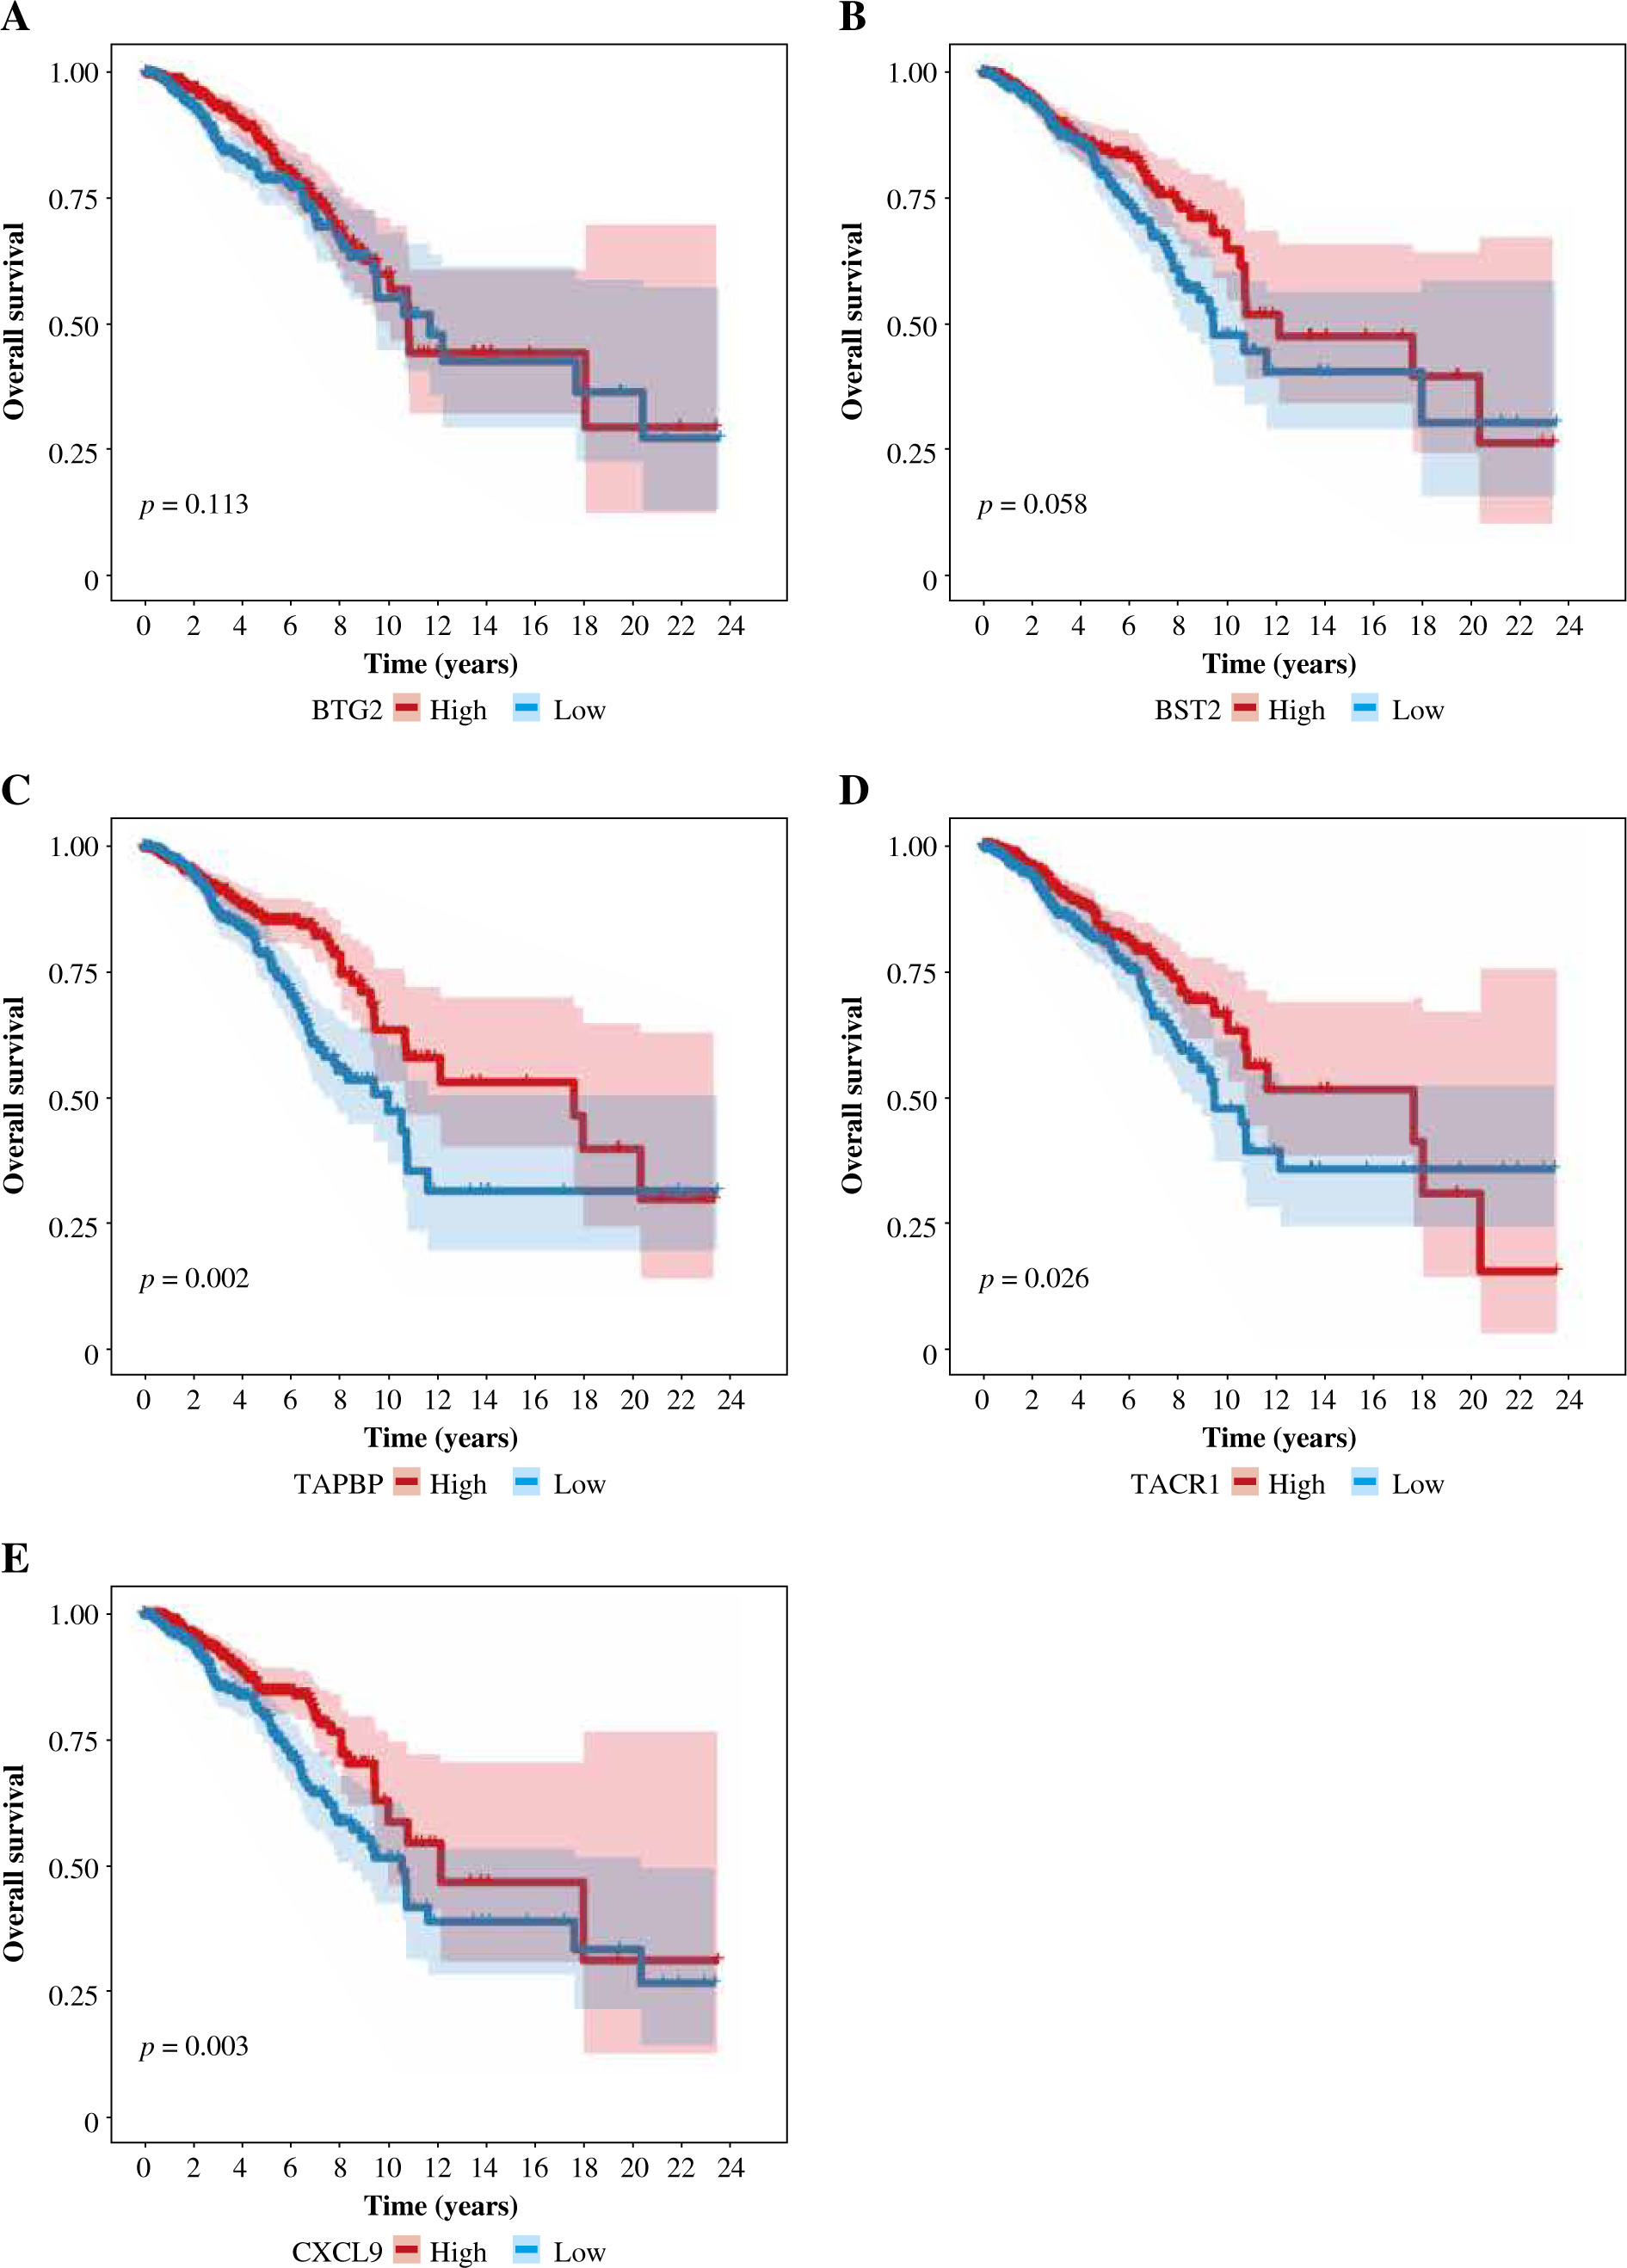
Fig. 5
Protein expression levels of 5-gene signature. A) BST2_BC tissue; B) BST2_Normal breast tissue; C) BTG2_BC tissue; D) BTG2_Normal breast tissue; E) TACR1_BC tissue; F) TACR1_Normal breast tissue; G) TAPBP_BC tissue; H) TAPBP_Normal breast tissue
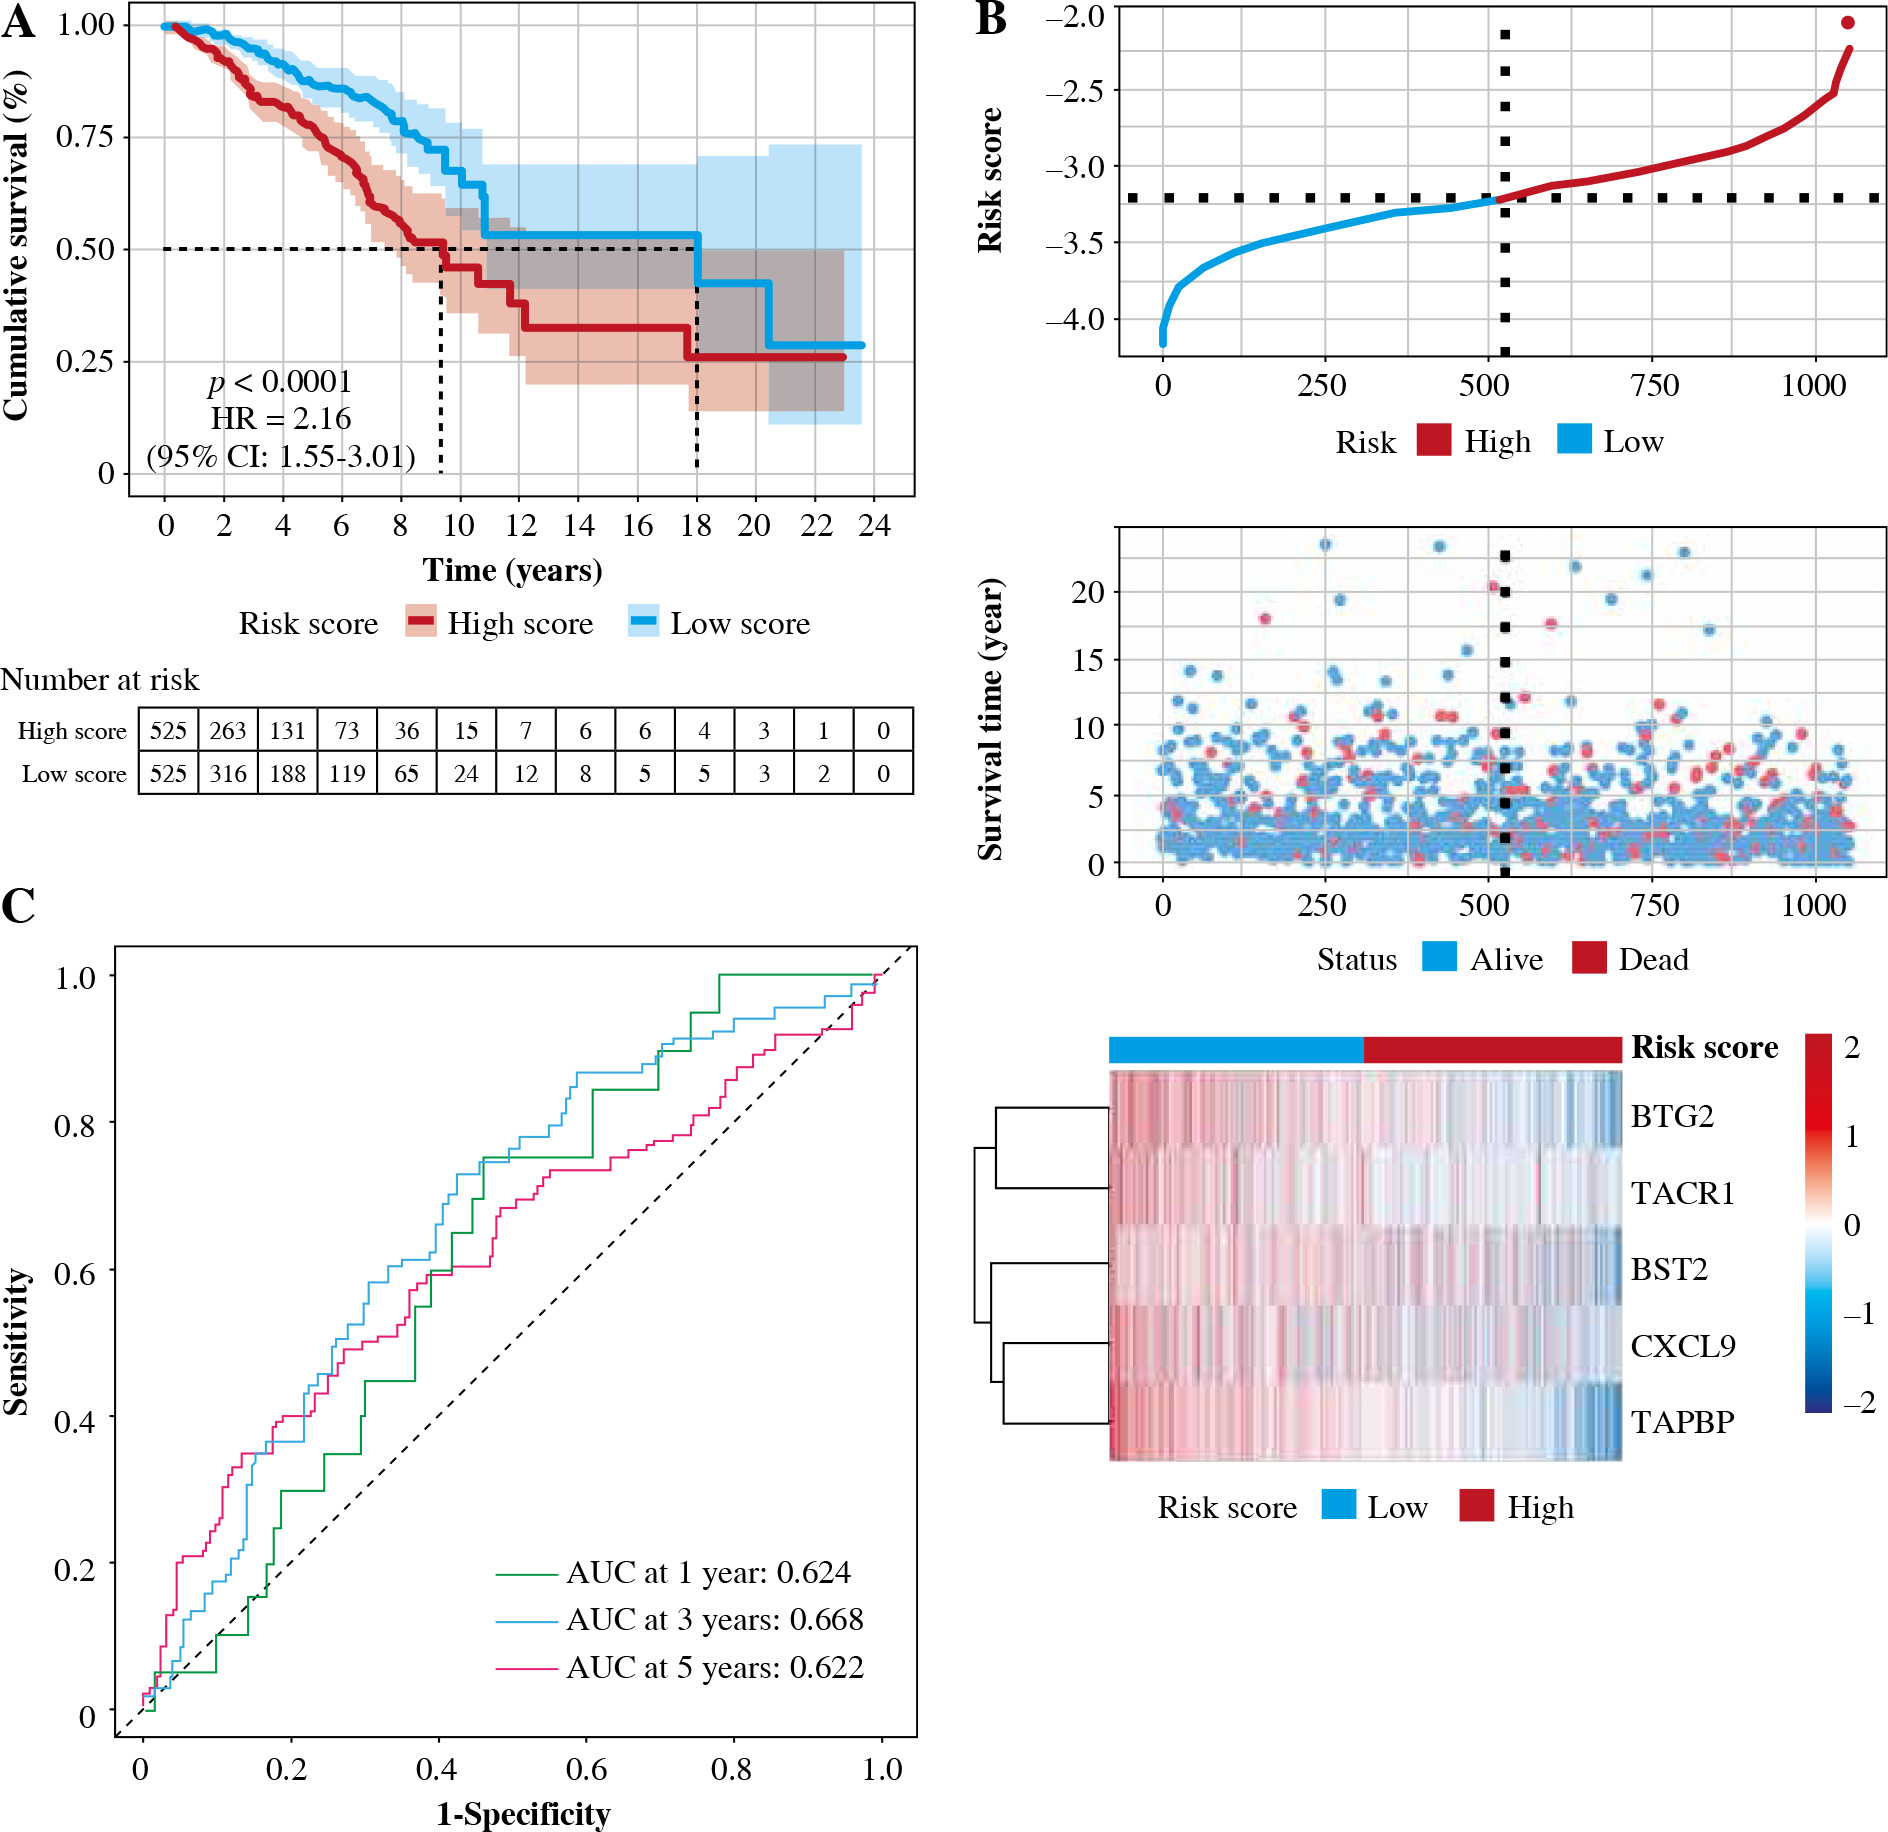
Patients were divided into two groups based on the median risk score. High-risk patients had significantly lower OS than low-risk patients. To assess the predictive efficiency of the prognostic model in 1-, 3-, and 5-year survival, we performed ROC curve analysis. The area under the ROC curve (AUC) was 0.624 at 1 year, 0.668 at 3 years, and 0.622 at 5 years, indicating a satisfactory predictive performance (Fig. 6).
Validation of prognostic models
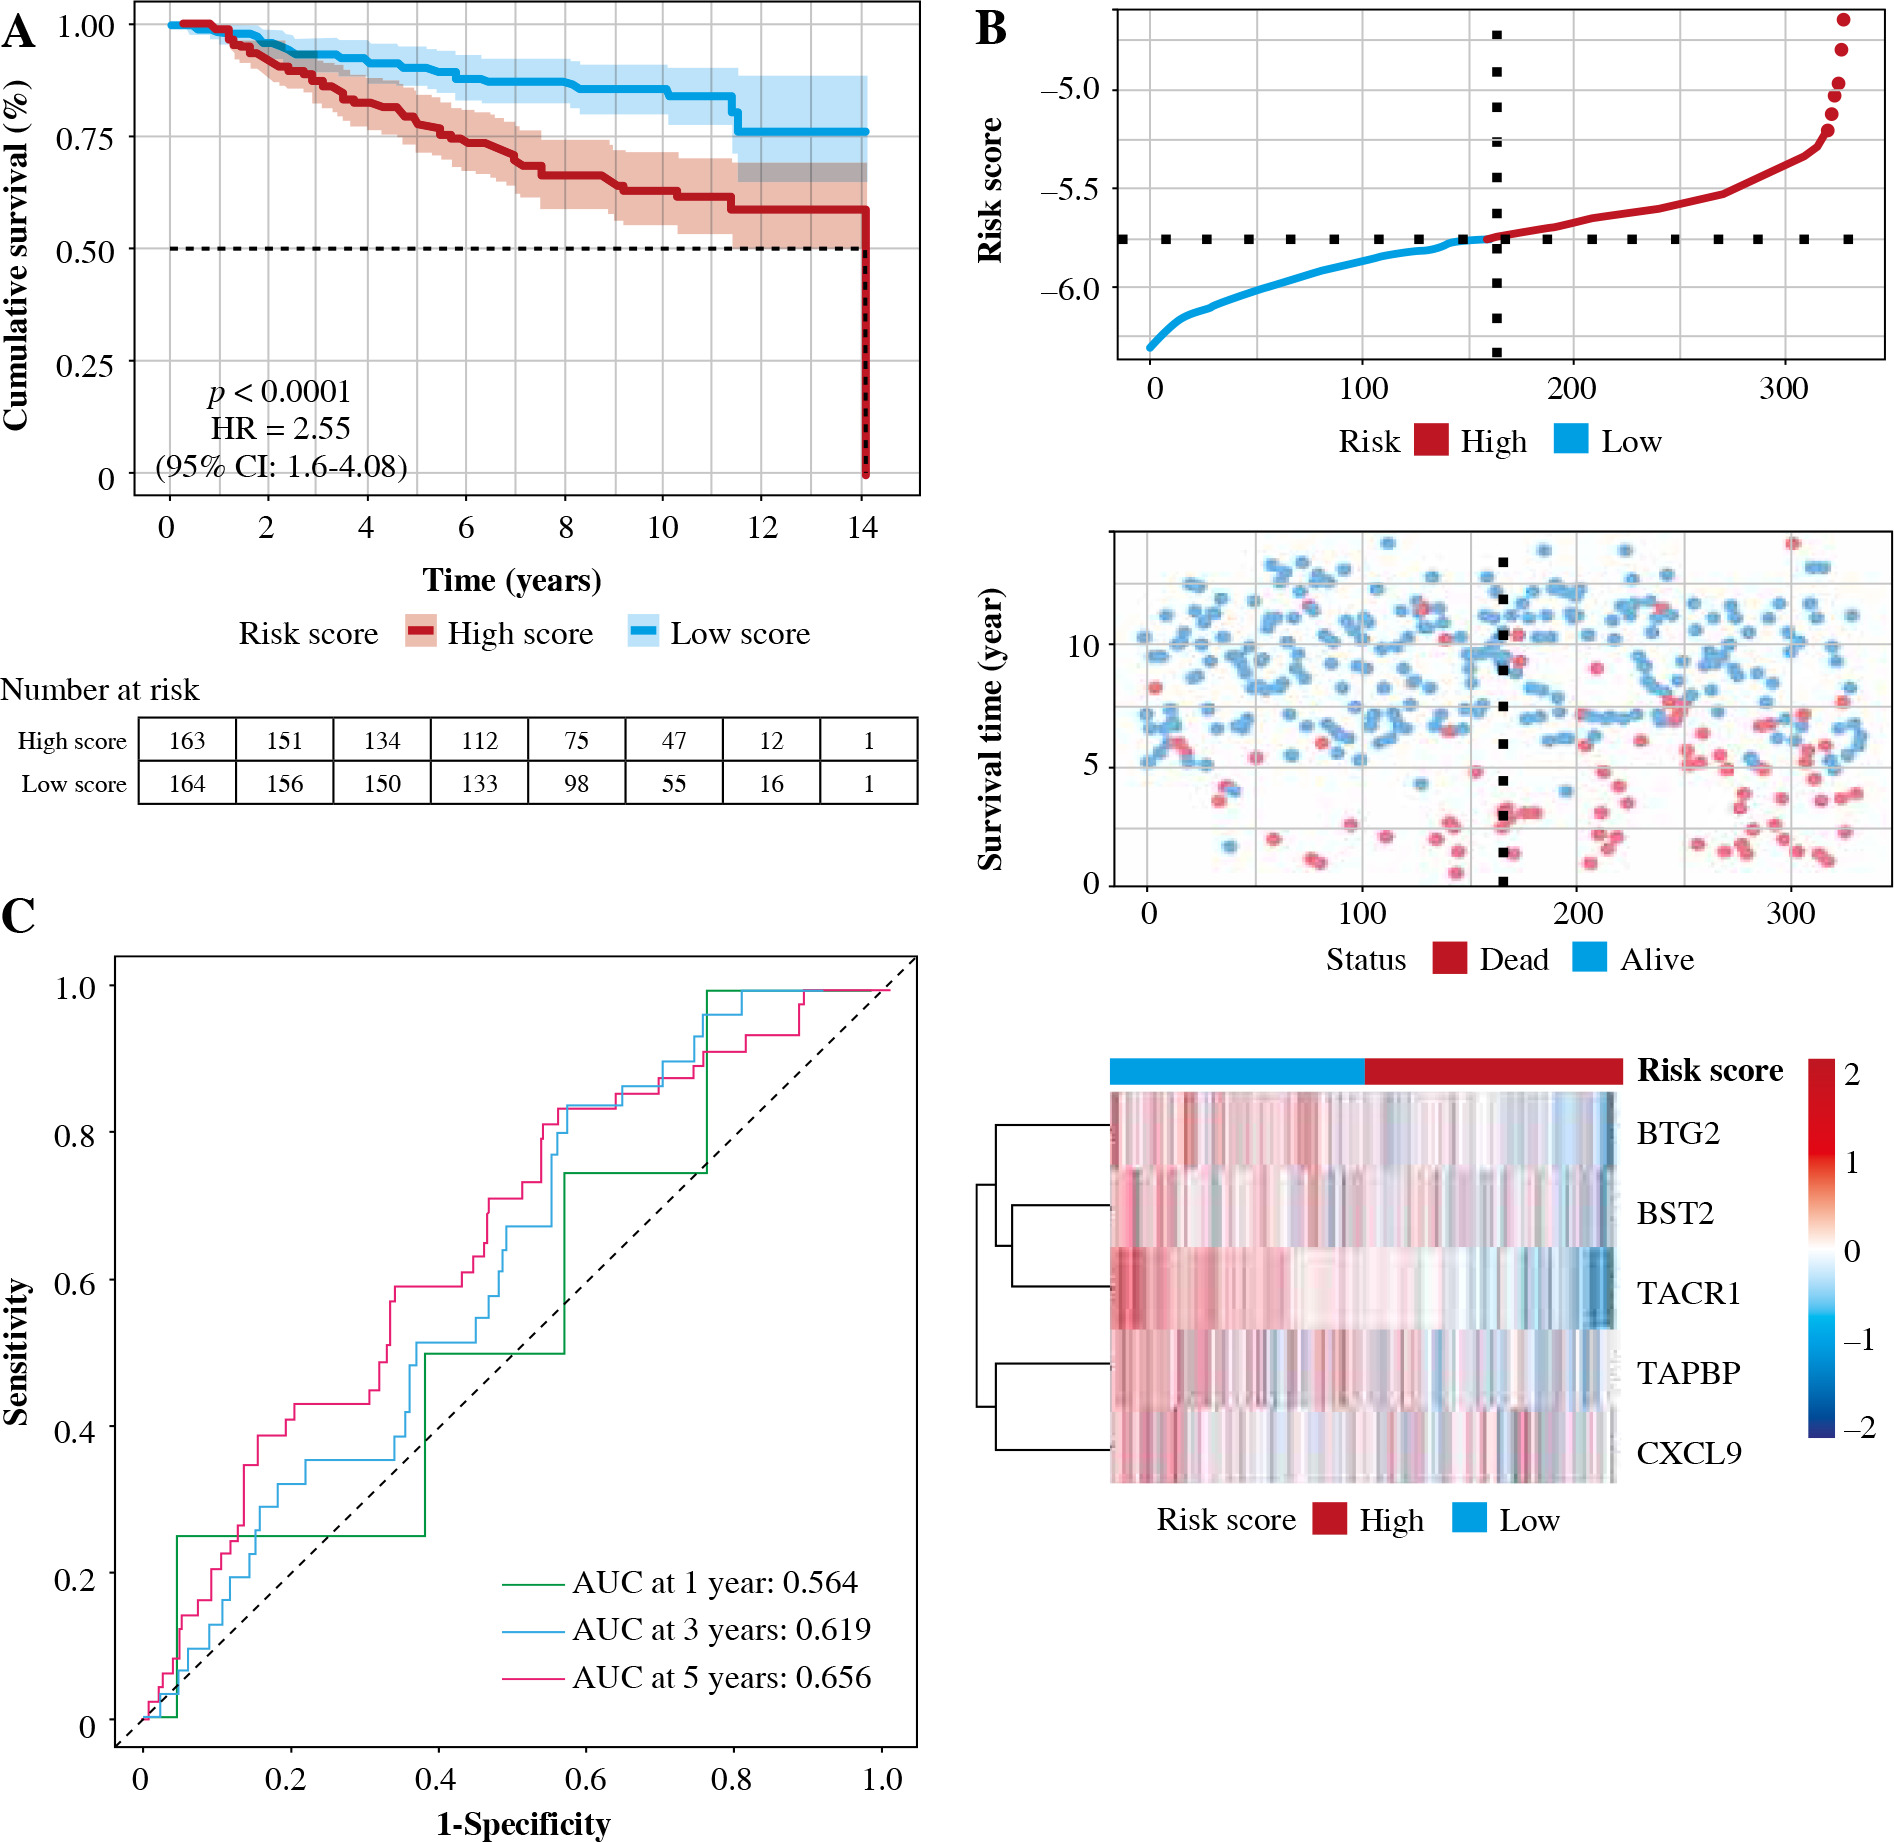
In order to test the stability of the prognostic model constructed based on the TCGA dataset, the risk scores of each sample were also calculated in the GSE20685 dataset. Based on the median of the risk scores, cancer samples were divided into high- and low-risk groups. Similar to the results obtained from the TCGA, patients in the high-risk group had a shorter survival time than those in the low-risk group. In addition, in terms of effective survival prediction of the prognostic model, 1-year AUC was 0.564, 3-year AUC was 0.619 and 5-year AUC was 0.656 in the GSE20685 dataset, as shown in Figure 7. In addition, the prognostic model was validated in the GSE42568 dataset (tissue samples from 17 normal controls and 104 BC cases). Based on the median of the risk scores, cancer samples were also divided into high and low-risk groups. Patients in the high-risk group had a shorter survival time than those in the low-risk group. In terms of effective survival prediction of the prognostic model, 1-year AUC was 0.707, 3-year AUC was 0.608 and 5-year AUC was 0.67, as shown in Figure 8.

Relationship between risk scores and clinical features
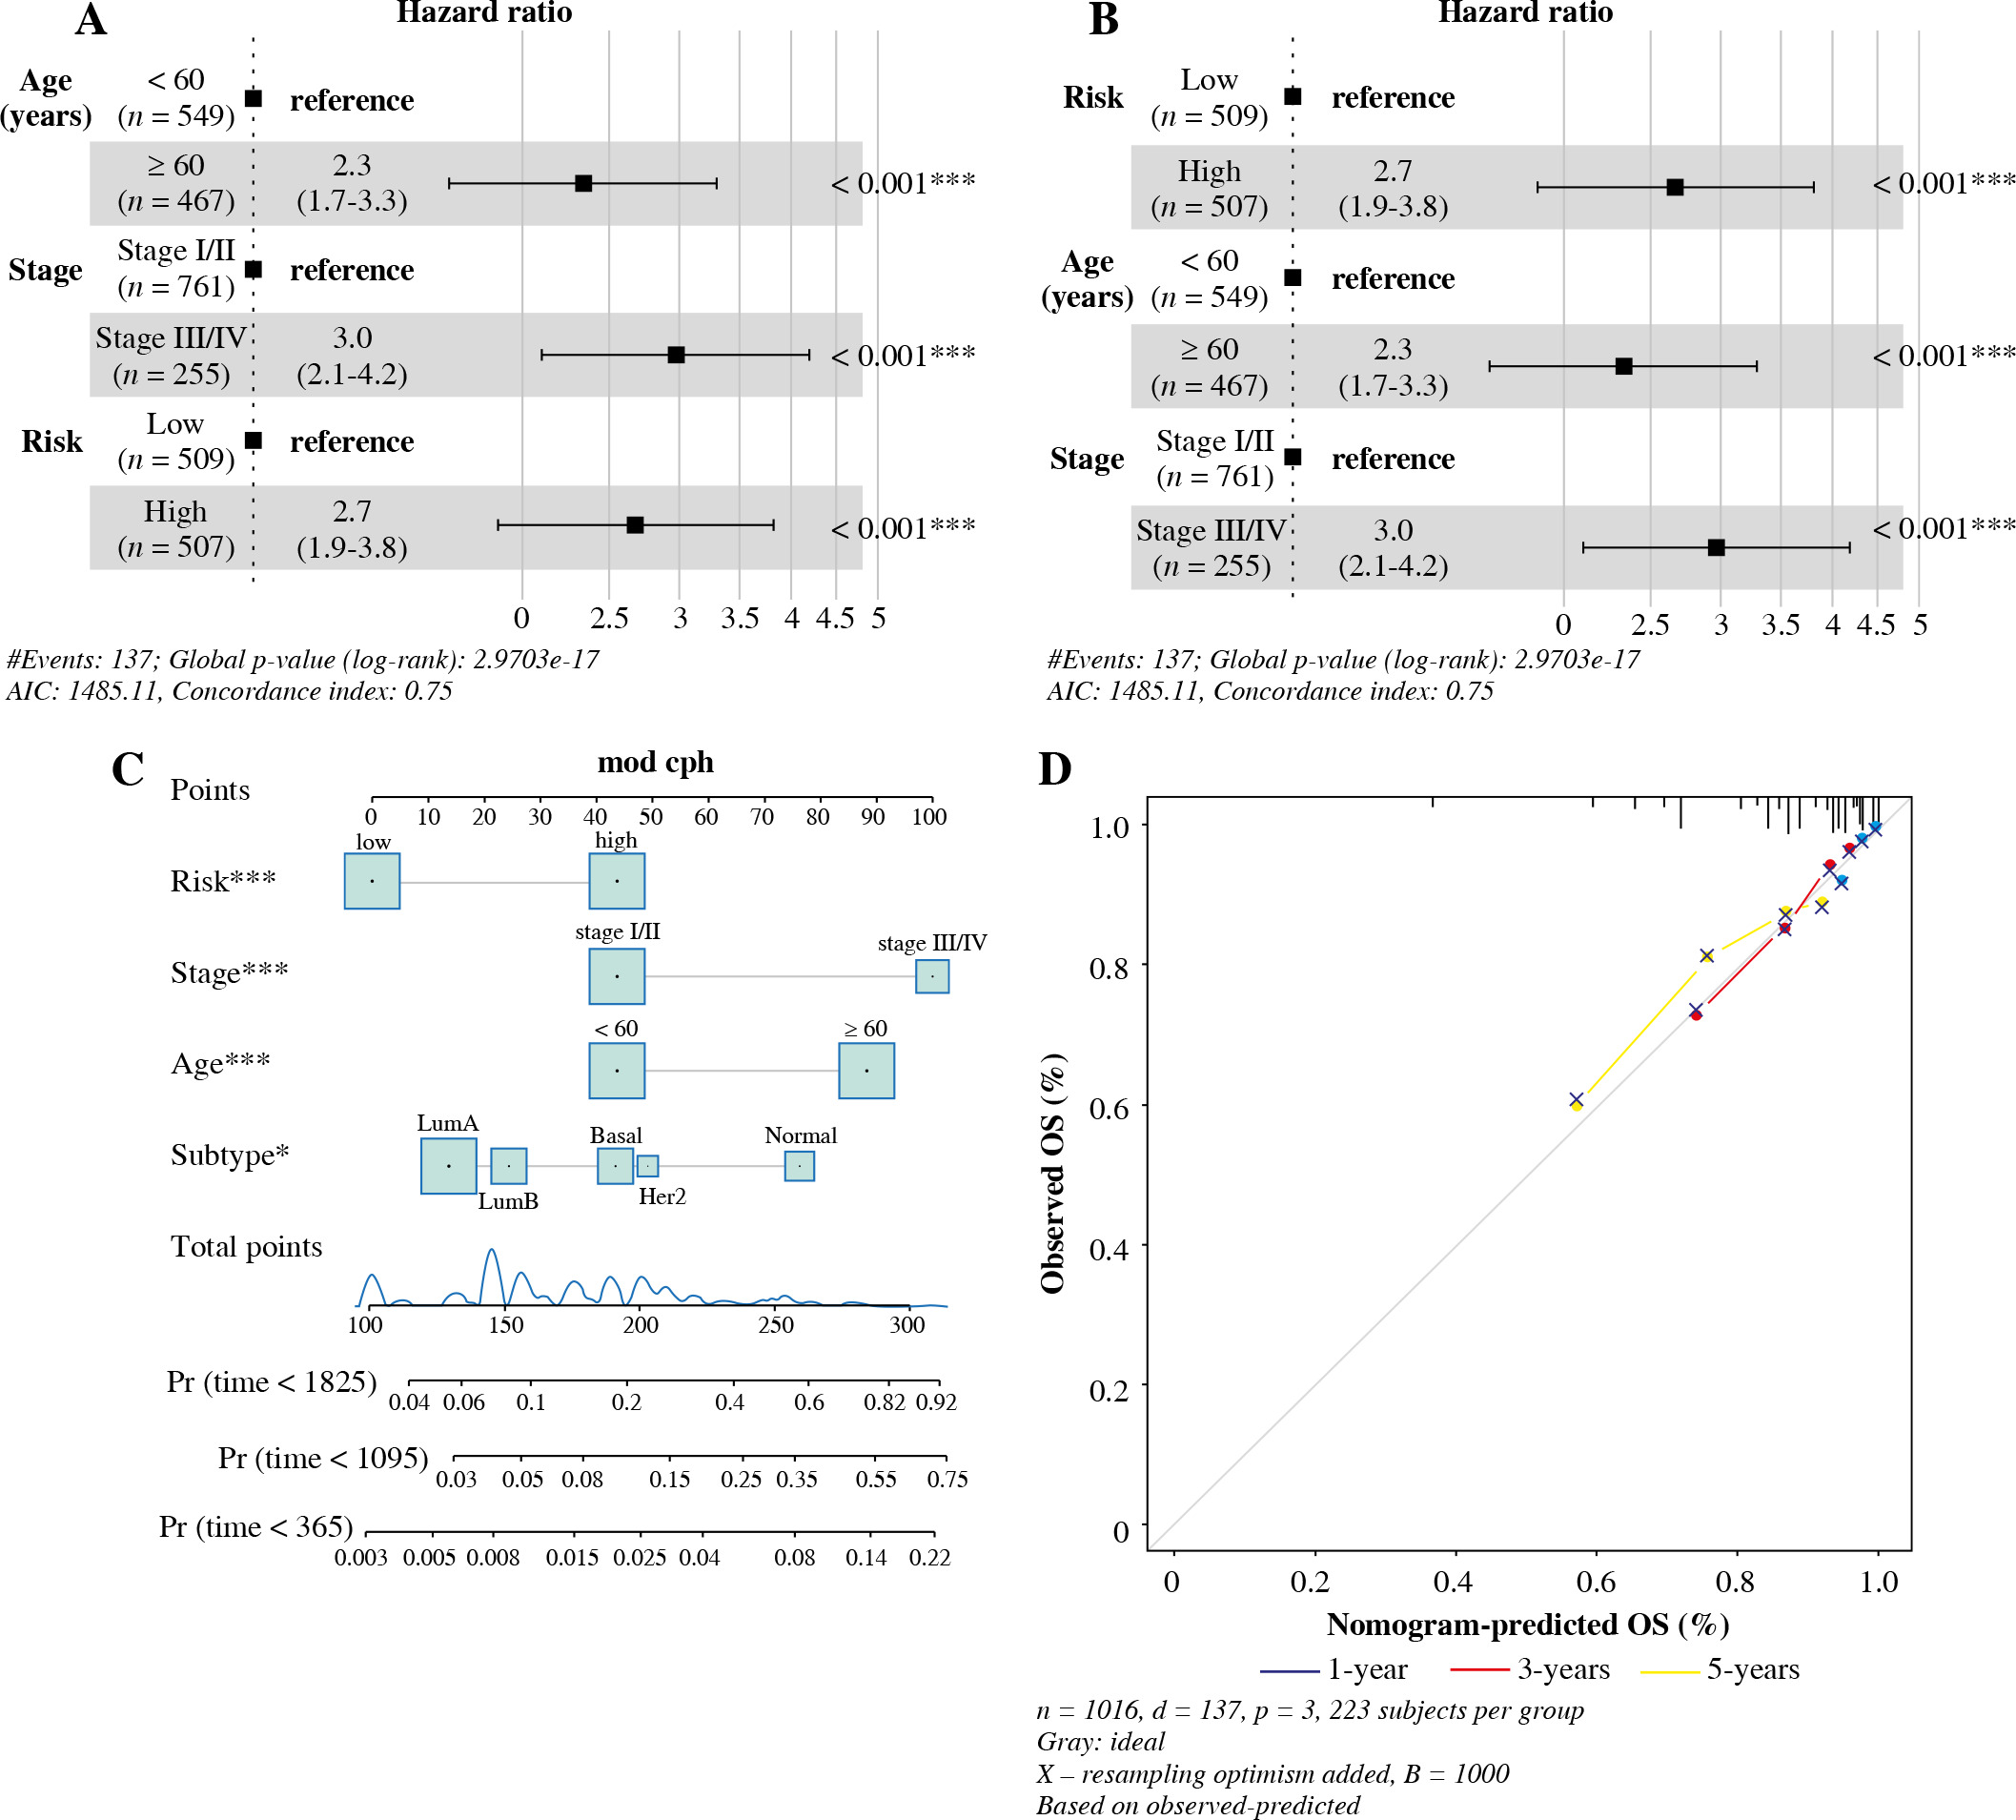
In univariate Cox analysis, TCGA risk score was significantly associated with OS (HR = 2.7, 95% CI = 1.9-3.8, p < 0.001). Furthermore, multivariate Cox analysis showed that risk score was an independent predictor of OS (HR = 3.0, 95% CI = 2.1-4.2, p < 0.001), as shown in Figu-re 9A and B. The risk scores, age and stage were combined to construct a line chart to predict the probability of OS at 1, 3 and 5 years. As shown in Figure 9C and D, each factor was allocated in proportion to its risk contribution to survival. The calibration curves showed that the combined model (the column chart) had high accuracy in 1-, 3-, and 5-year OS. Taken together, these results suggested that a combined model may be a better predictor of BC survival than a single prognostic factor.
Analysis of immune status and tumor microenvironment
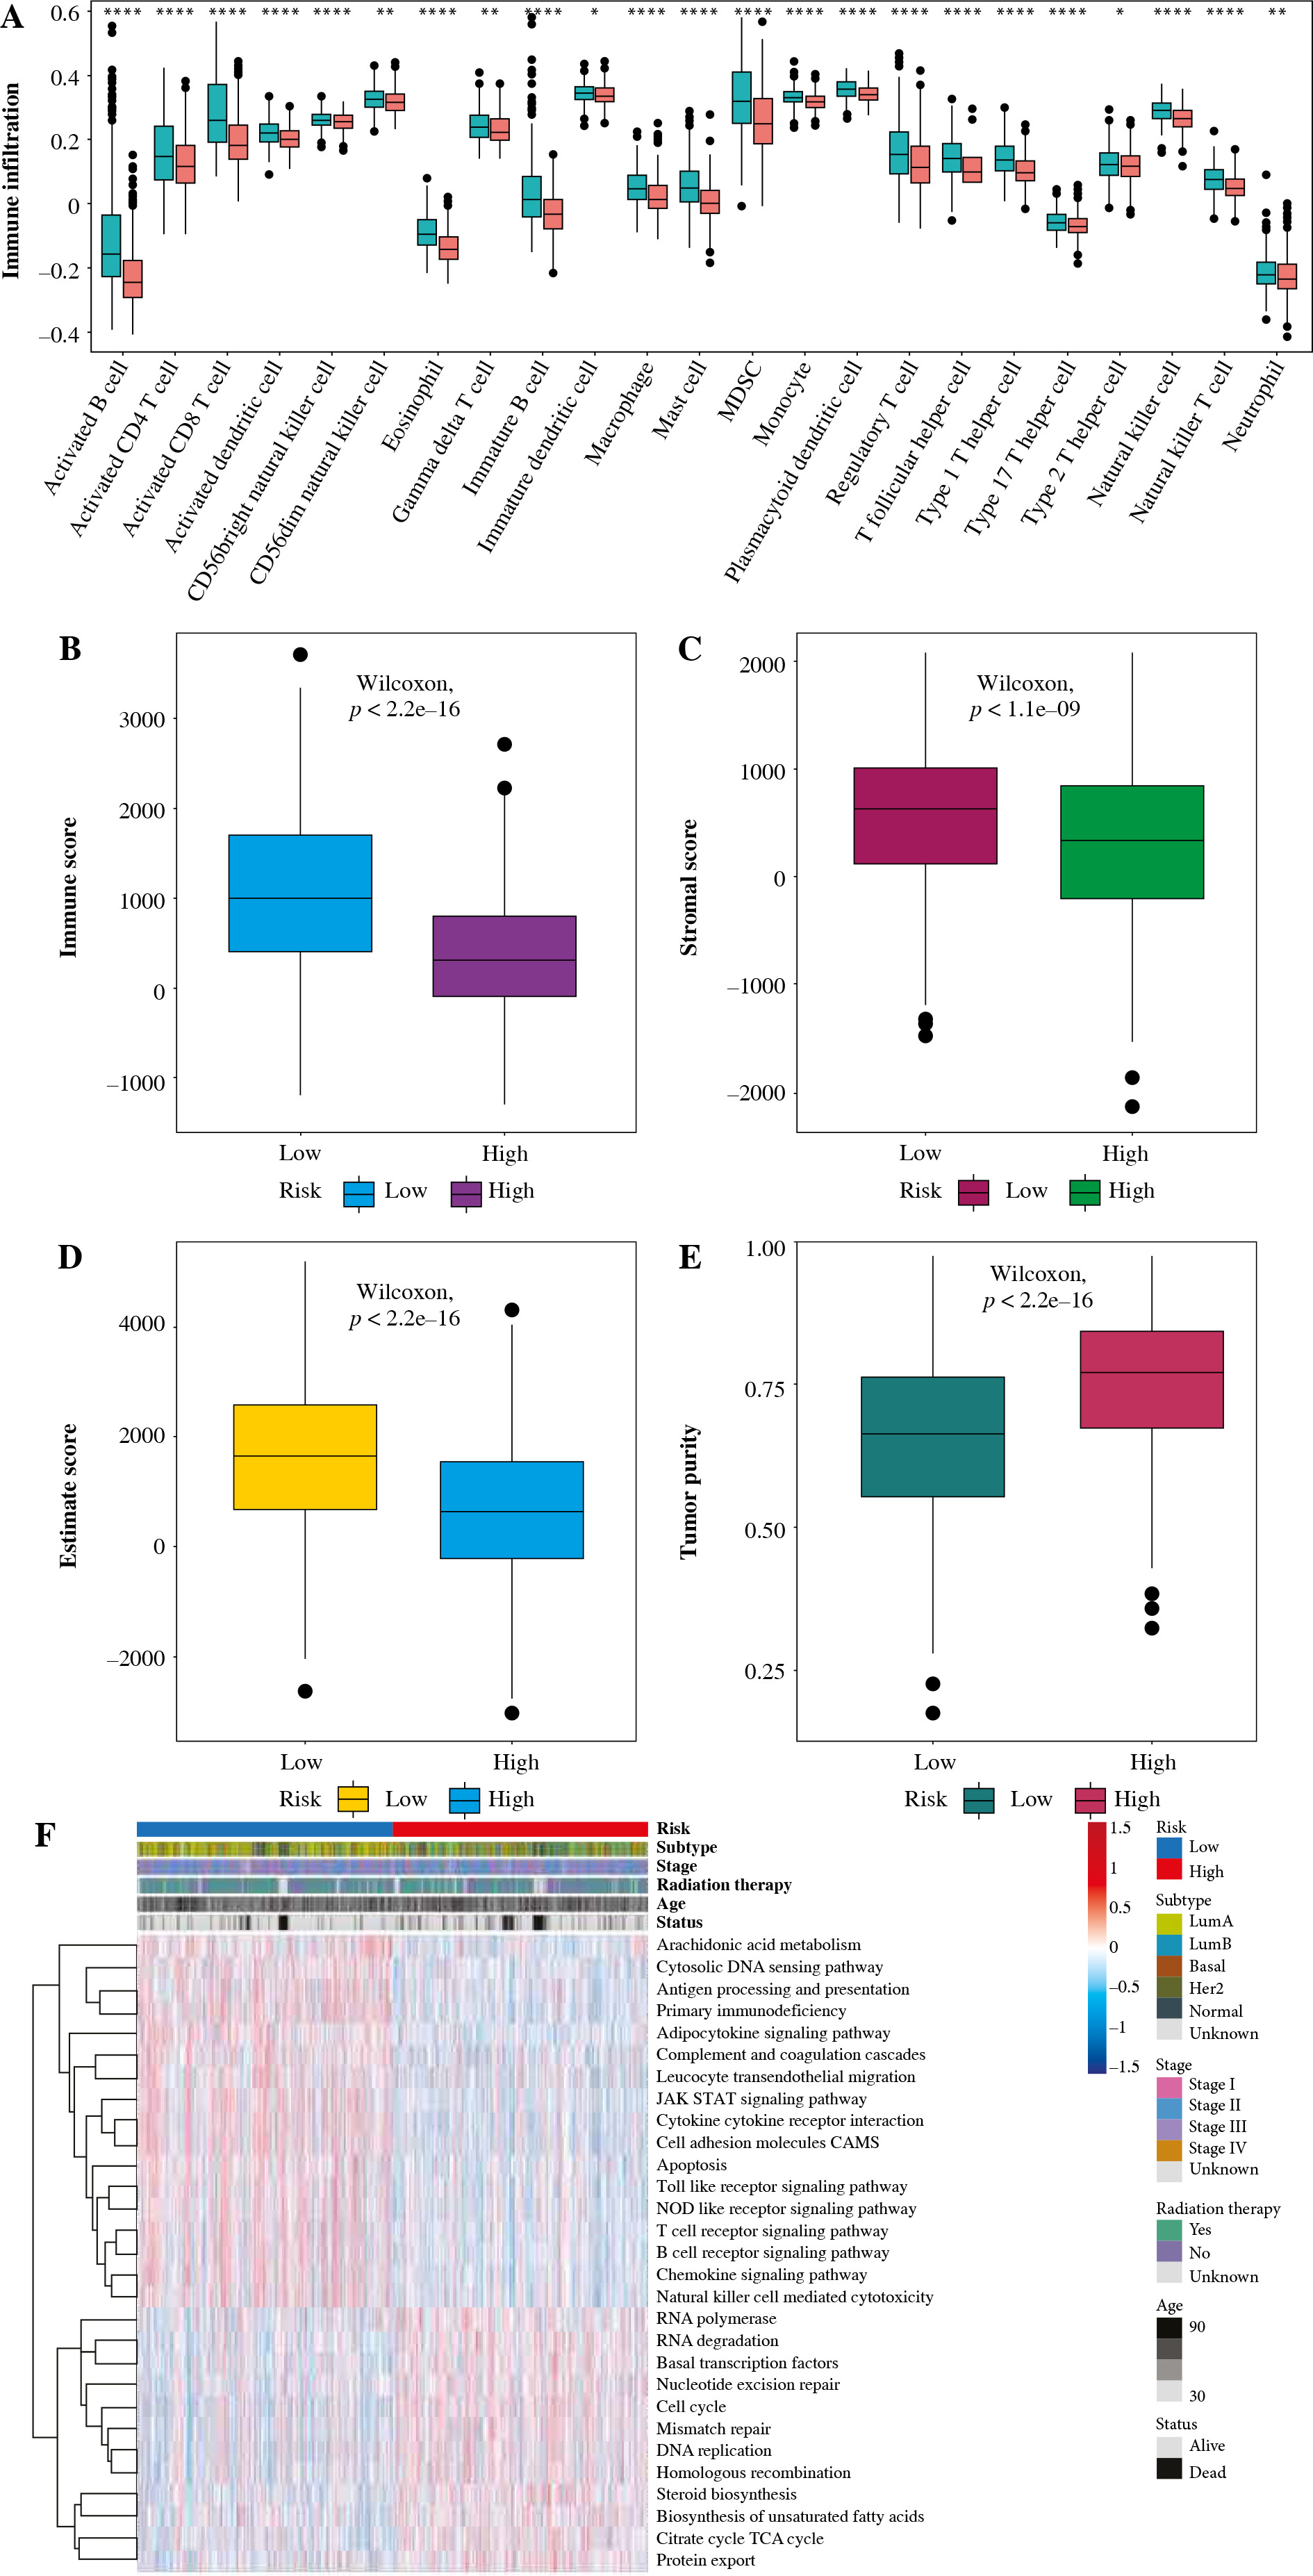
To explore the relationship between risk score and tumor immune microenvironment, ssGSEA was utilized to evaluate the status of 23 kinds of immune cell infiltration in the TCGA dataset. Then, the differences in immune cell infiltration among the high- and low-risk assessment groups were hypothesized, as shown in Figure 10A. We found that most immune cells were significantly less infiltrated in the high-risk group, such as activated CD4 T cells, immature B cells, activated B cells, and activated CD4 T cell activated CD8 T cells. Immunological score, stroma score, and ESTIMATE score were significantly lower in the high-risk group, while tumor purity was significantly higher in the low-risk group, as shown in Figure 10B-E. GSVA showed that metabolic pathways such as cell cycle, DNA replication and homologous recombination were more active in the high-risk group, while metabolic pathways such as antigen processing and presentation, apoptosis, B cell receptor and T cell receptor were significantly inhibited in the high-risk group, as shown in Figure 10F. It is suggested that the reduced infiltration of immune cells in the tumor microenvironment in the high-risk group may be responsible for the poor prognosis of patients.
Fig. 10
Relationship between tumor risk score and immune cell infiltration. A) Heatmap of distribution of immune cell infiltration ratio; B) Differences in immune scores; C) Differences in matrix scores; D) Differences between high- and low-risk scores in ESTIMATE scores; E) Differences in tumor purity F) GSVA analysis of pathways
Relationship between tumor risk score and tumor mutational burden
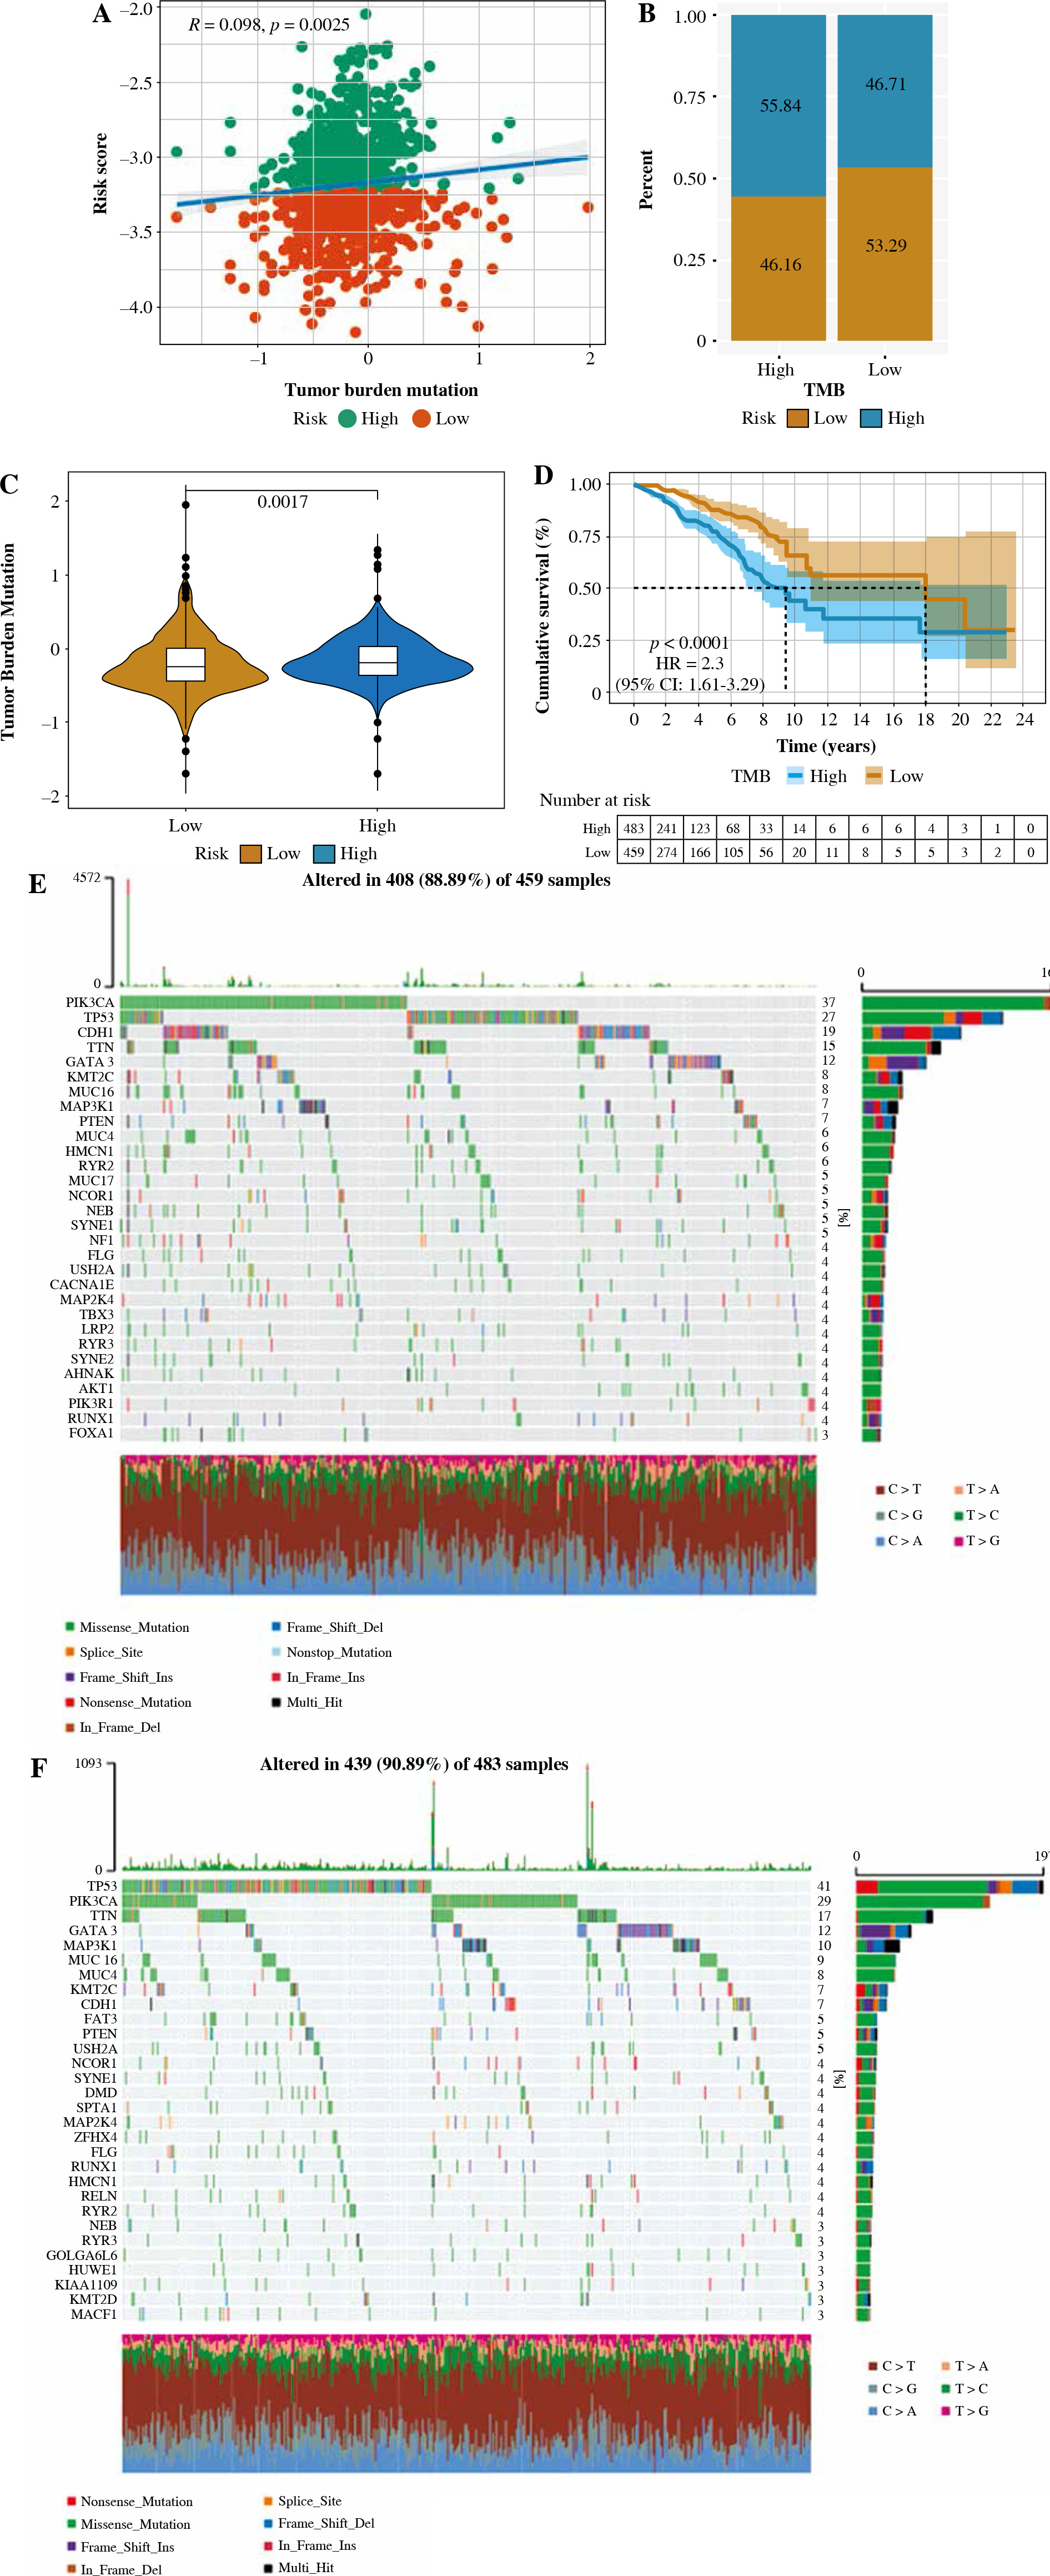
There is considerable evidence that tumor mutational burden (TMB) may determine patients’ response to cancer immunotherapy. According to the median TMB, tumor samples in TCGA were divided into two groups of high- and low-TMB score. As shown in Figure 11A, risk score was positively associated with TMB. There was a significant difference in survival time between the group with a high and a low TMB score, and the survival time of the patients with a low TMB was significantly higher than that of the high-risk group, as shown in Figure 11D. Furthermore, the TMB of patients in the high-risk-score subgroup was significantly higher than that of patients in the low-risk-score subgroup, as shown in Figure 11B and C.
Fig. 11
. Correlation between tumor risk score and tumor mutational burden. A) Correlation linear regression analysis; B) Bar chart of proportional distribution; C) Violin plot; D) Survival curve E) Waterfall chart of gene mutation in the high-risk group; F) Waterfall chart of gene mutation in the low-risk group
Predictive value of tumor risk scores in immunotherapy
To explore the predictive value of tumor risk score in patients’ immunotherapy, we conducted an evaluation analysis based on IMvigor210. It was noteworthy that risk scores were significantly lower in patients who responded to immunotherapy (complete response/partial response – CR/PR) than in patients who did not respond to immunotherapy (stable disease/progressive disease – SD/PD), as shown in Figure 12A. Patients in the low-risk group were significantly more longevous than those in the high-risk group, as shown in Figure 12B. In Figure 12C, the objective response rate of immunotherapy in the low-risk group was significantly higher than that in the high-risk group. These data indicated that the risk score constructed by inflammatory genes could be associated with the response to immunotherapy.

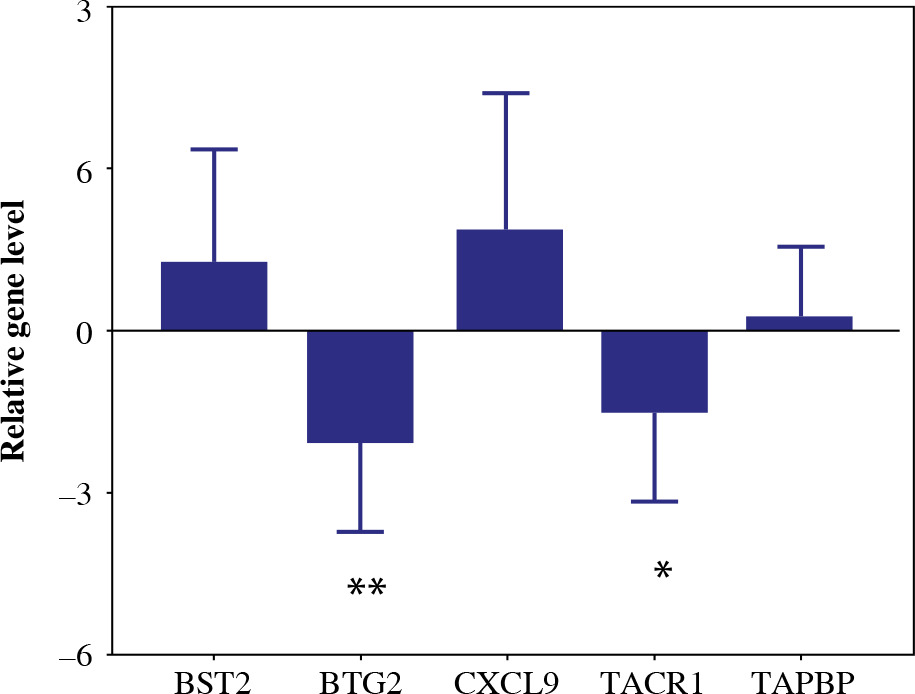
Validation of the differentially expressed 5-gene signature in breast tissue samples
To validate the reliability of the TCGA dataset, the expression levels of the 5-gene signature were further identified by qRT-PCR. The expression levels of BST2, CXCL9 and TAPBP were significantly higher in BC tissue samples than in the paracancerous tissue sample. In addition, the expression levels of BTG2 and TACR1 were significantly decreased in BC tissue samples (Fig. 13). The results were consistent with the bioinformatics analysis.
Discussion
Substantial data suggest that a link between cancer and inflammation is emerging [14-16]. Inflammatory diseases can increase the cancer risk [17-19]. People with ulcerative colitis and Crohn’s disease have an increased risk of colorectal cancer [20]. Patients with schistosomiasis are prone to urinary bladder cancer [21]. Emerging evidence supports a link between BC and inflammation [22]. Chronic inflammation plays critical roles in BC recurrence [23]. Inflammatory breast cancer (IBC), one of the most aggressive types of BC conditions, suggests the relationship between inflammation and BC [24, 25].
Clinically, there are several polygenic-based risk models that can predict the prognosis of patients with cancer. For instance, the 21-gene expression assay supplies prognostic information in hormone-receptor-positive BC [26]. The 21-gene expression assay was strongly recommended for BC patients by clinical practice guidelines. In our study, the 5-gene risk model represented a convenient assay in the clinic. The risk model consisted of five inflammatory-associated genes, most of which were up-regulated under an inflammatory condition. BST2 has an association with a BC xenograft metastatic to the bone [27]. Similarly, CXCL9 plays an indispensable role in BC patients for immune checkpoint-based therapies [28]. As a tumor suppressor in some types of malignancy, BTG2 is associated with proliferation and apoptosis [29]. The tachykinin-1 receptor (TACR1) is an oncogene in some malignancies [30].
Inflammatory cells in the tumor microenvironment influence BC progression [31]. In invasive BC, inflammatory cells constitute 50% of the total tumor mass and include macrophages, T and B lymphocytes [32]. Infiltrating tumor-associated leukocytes were considered as an intrinsic mechanism for defense against tumor development. Inflammatory cells may stimulate tumor cell proliferation and invasion by secreting cytokines, thereby affecting tumor progression [33]. Herein, we evaluated the status of 23 kinds of immune cell infiltration. The results showed that most immune cells were significantly less infiltrated in the high-risk group, such as activated CD4 T cells, immature B cells, activated B cells, and activated CD4 T cell activated CD8 T cells. Immunological score, stroma score, and ESTIMATE score were significantly lower in the high-risk group, while tumor purity was significantly higher in the low-risk group.
TIME may influence the prognostic classification of BC patients. The complex interplay between tumor cells and the tumor microenvironment not only plays an important role in tumor development, but also has an important impact on the efficacy of immunotherapy of patients [34, 35]. The high immune infiltration in the low-risk group partly reflects the better effect of various treatments, which means that our signature can distinguish the survival prognosis of the patients but also reflect the infiltration degree of immune cells [36]. Additionally, we analyzed the relationship between risk score and TMB to determine the prognosis of BC patients, and the results suggested that the poor prognosis in the high-risk group could be due to more mutated genes in this group. Since BC immunotherapy remains in its infancy, its high TMB score and many mutated genes may benefit patients with a poor prognosis [37].
Herein we have provided a comprehensive assessment of the prognostic signature generated and validated in the study, a clinically promising tool that can be applied to classify BC patients into different outcomes and levels of immune infiltration. Our analysis should be further validated by prospective studies in multicenter clinical trials. There may be some bias in the selection of prognostic polygenic signals. However, as this feature is highly correlated with prognosis and immune infiltration, the role of these genes warrants further investigation, especially in BC.
In summary, the 5-gene signature is a potential prognostic tool to predict the OS rate of BC patients grouped by risk factors. The nomogram comprising a 5-gene signature could help clinicians manage BC patients. The gene signature generated and validated could be related to the distinct survival outcome of BC patients, immune infiltration levels and TMB scores.