Introduction
The pathophysiologic role of triglycerides (TG) in the development of cardiovascular disease (CVD) is complex [1, 2]. TG-related CVD risk is likely driven by atherogenic properties of multiple TG-rich lipoproteins (TRLs) including large and small very low-density lipoproteins (VLDL), intermediate-density lipoproteins (IDL) and possibly chylomicrons (CM) and CM remnants [1].
Fredrickson, Levy and Lees (FLL) defined five primary lipoprotein phenotypes (type I to V) based on dyslipoproteinemias and characterized by the presence of hypercholesterolemia and/or hypertriglyceridemia [3, 4], and this classification system was formally adopted by the World Health Organization (WHO) in 1970 [5]. Since each FLL phenotype has elevations of one or more distinct lipoprotein classes (or subclasses), this classification may better inform treatment strategies based on the dyslipoproteinemia [3, 6, 7].
Significant clinical heterogeneity exists among hypertriglyceridemic (HTG) phenotypes. For instance, the presence of elevated chylomicrons (type I and V) confers remarkably distinct clinical manifestations, prognosis and management with more prominent risk of acute pancreatitis rather than CVD [8, 9]. Patients with other HTG phenotypes, such as type IIb [10] and III [11] are at markedly increase risk to develop premature coronary artery disease and early myocardial infarction. Emerging therapies, such as apolipoprotein C-III inhibition through antisense oligonucleotide [12] or monoclonal antibodies [13], may have unique and differing impact on the distinct FLL phenotypes.
To our knowledge, no large-scale population-based studies exist with detailed characterization of the lipid profile in individuals with hypertriglyceridemic FLL phenotypes. The aim of this study is to gain insight into the complex pathophysiology of hypertriglyceridemic FLL phenotypes by characterizing them in the Very Large Database of Lipids, which is an ongoing contemporary big-data project with lipoprotein data from more than 5 million unique patients from US-based clinics.
Material and methods
Study population
This is a cross-sectional analysis of lipid profile data from 979,539 unique US adults from the Very Large Database of Lipids with fasting samples. The methods for the creation of this database have been described [14]. In summary, the database was constructed using de-identified data from the clinical operations of a single laboratory (VAP Diagnostics Lab, Birmingham, AL). The samples originated predominantly from primary care clinics throughout the US between 2009 and 2015.
Lipid measurements
Lipid profiles were measured with direct ultracentrifugation by the Vertical Auto Profile (VAP) test. The VAP test is a density gradient ultracentrifugation technique, validated in comparison to the beta quantification method [15], both of which separate lipoproteins according to their hydrated densities. The VAP directly measures cholesterol concentrations of all lipoprotein classes sequentially across the density spectrum (during gentle evacuation from the centrifuge tube). The resulting cholesterol peaks are defined as high-density lipoprotein cholesterol (HDL-C), lipoprotein (a) cholesterol (Lp(a)-C), “real” low-density lipoprotein cholesterol (LDL-C), intermediate-density lipo-protein cholesterol (IDL-C) and very low-density lipoprotein cholesterol (VLDL-C). Note that the total LDL-C level reported in this study is the sum of real LDL-C + Lp(a)-C + IDL-C, equivalent to non-HDL-C minus VLDL-C, consistent with the Friedewald equation of LDL-C. The standard lipid profile in clinical practice often presents an estimated version of this LDL-C value based on the Friedewald equation when TG < 400 mg/dl. Cholesterol concentrations in lipoprotein subclasses (HDL2-C, HDL3-C, LDL1-C, LDL2-C, LDL3-C, LDL4-C, VLDL1-C, VLDL2-C, and VLDL3-C) were also measured by VAP [15]. TG were directly measured in whole plasma using the Abbott ARCHITECT C-8000 system (Abbott Park, IL) [14].
Non-HDL-C was calculated as total cholesterol (TC) minus HDL-C. Remnant lipoprotein particle cholesterol (RLP-C) was defined as the sum of the densest VLDL-C subfraction (VLDL3-C) and IDL-C [16].
Further, to better characterize TG-related lipoprotein parameters we calculated several ratios of lipid factors: TG/TC, VLDL-C/TG, HDL2-C/HDL3-C and TG/HDL-C. We calculated average LDL particle density as the LDL Density Ratio (LLDR) by the following formula: LLDR = ln([LDL3-C + LDL4-C]/[LDL1-C + LDL2-C]), previously shown by us to correlate very strongly with ultracentrifugally-determined modal LDL density (R 2 = 0.80) [14].
Definition of FLL phenotypes
The definitions for FLL phenotype categorization and distributions in the study are shown in Table I. First, we categorized individuals by the presence or absence of hyperchylomicronemia (hyper-CM), defined as a total plasma TG/plasma TC > 10 or < 10 respectively [1]. We further stratified patients with hyper-CM into two categories: excess of chylomicrons only (FLL type I), and excess of both chylomicrons and VLDL (defined as VLDL-C above the 90th percentile for the general study population) (FLL type V).
Table I
The Very Large Database of Lipids: FLL phenotypes and continuum group
| Classical dyslipidemia | Main features | Diagnostic criteria | N (%) | Age, median (25th–75th) | Male (%) |
|---|---|---|---|---|---|
| Type I | Chylomicron excess | TG/TC ratio > 10 and VLDL-C < 90th percentile | 5 (< 0.00004) | 50.01 (35.0–52.8) | 5 (100) |
| Type IIa | LDL-C excess | LDL-C > 90th percentile, V2LDL-C < 90th percentile, and VLDL-C/TG < 0.3 | 94,453 (9.7) | 55.21 (46.6–63.8) | 39,437 (42.0) |
| Type IIb | LDL-C and VLDL-C excess | LDL-C, VLDL-C > 90th percentile, and VLDL-C/TG < 0.3 | 20,144 (2.1) | 54.99 (46.4–63.7) | 9,583 (47.8) |
| Type III | Remnant lipoprotein cholesterol excess | VLDL-C/TG > 0.3, TG > 130, and LDL-C < 90th percentile | 2,151 (0.2) | 57.45 (49.2–66.3) | 1,073 (50.1) |
| Type IV | VLDL-C excess | VLDL-C > 90th percentile, LDL-C < 90th percentile, and VLDL-C/TG < 0.3 | 85,540 (8.8) | 55.09 (46.0–65.04) | 51,195 (60.1) |
| Type V | Chylomicron and VLDL-C excess | TG/TC ratio > 10 and VLDL-C > 90th percentile | 246 (0.03) | 47.86 (40.2–54.6) | 200 (81.3) |
| Continuum* | N/A | N/A | 768,161 (79.1) | 57.44 (46.6–67.7) | 353,310 (46.2) |
Among patients without chylomicronemia (non-CM), we sub-classified individuals as 1) type IIb, based on the presence of both VLDL-C excess (> 90th percentile) and LDL-C excess (> 90th percentile) [17]; 2) type III, based on VLDL-C/TG > 0.3 and TG > 130 without LDL-C excess (< 90th percentile) [18]; and 3) type IV based on VLDL-C excess (> 90th percentile) without LDL-C excess (< 90th percentile) [17]. Individuals who met criteria for type IIa (LDL-C > 90th percentile and VLDL-C < 90th percentile and VLDL-C/TG < 0.3) were not included as regular subjects in this study, because they do not have HTG. Finally, the vast majority of individuals in the database population did not meet criteria for any FLL phenotype, and were classified into the “continuum” group.
Statistical analysis
Within each FLL phenotype and the continuum group, we examined TG levels and lipid parameters obtained from the VAP test. Distributions of lipid parameters are shown using medians, 25th and 75th percentile, and were compared using the Kruskal-Wallis test with a p-value < 0.001 arbitrarily required to be considered significant given our sample size.
Results
For the present study, lipid data from the first accessioned blood sample in the VLDL database from a subset of 979,539 unique individuals reported to be in the fasting state were included. A total of 768,161 (79.1%) individuals did not meet criteria for any FLL phenotype were classified in the continuum group, whereas 94,453 (9.7%) met criteria for type IIa hyperlipidemia, and 116,925 (11.9%) had one of several possible HTG phenotypes.
The frequency of HTG FLL phenotypes was as follows: 5 type I, 20,144 type IIb, 2,151 type III, 85,540 type IV and 246 type V, as shown in Table I.
Triglyceride-rich lipoproteins: TG, RLP-C and VLDL subclasses
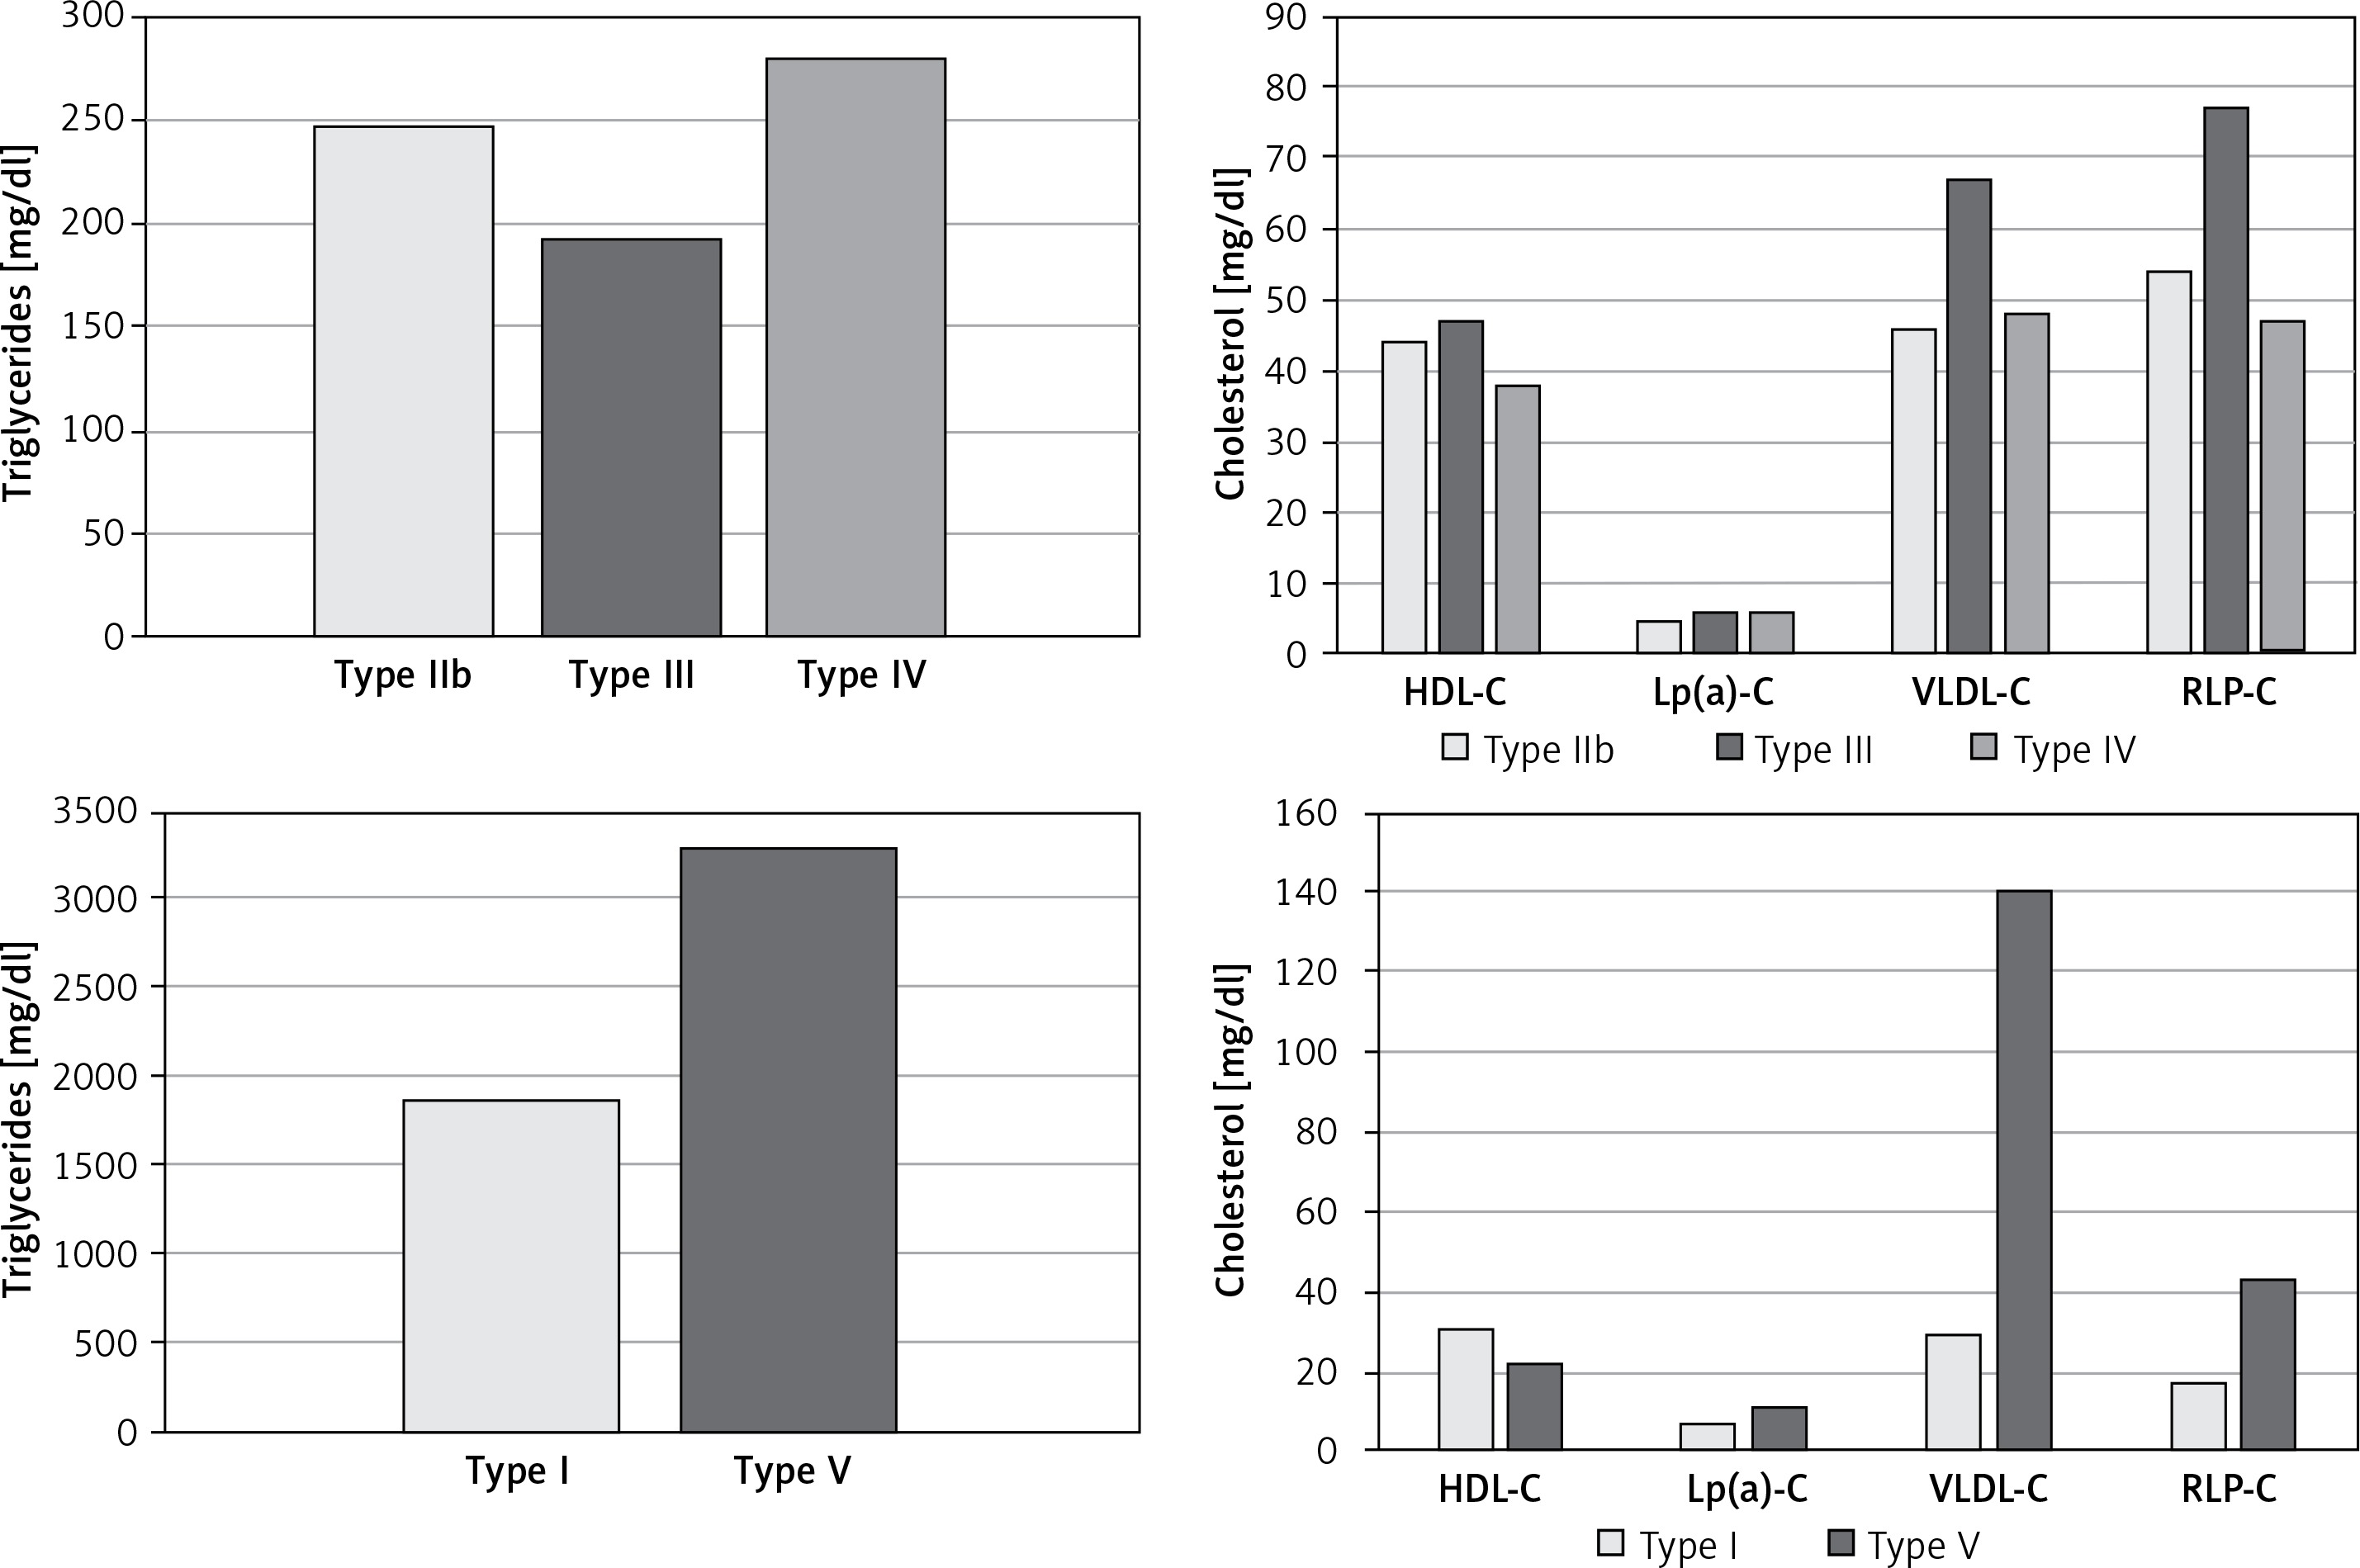
The hyper-CM groups had extremely high TG levels (> 1000 mg/dl), as shown in Table II. Type V individuals had the highest TG levels among FLL phenotypes; of note, more than 3/4 of type V individuals had TG levels above 2000 mg/dl (median: 3286.5; 2203–4823). Individuals categorized as type I had lower TG levels with a median of 1858 mg/dl (1026–2439 mg/dl; p < 0.001).
Table II
Lipid profile of individuals with hypertriglyceridemic FLL phenotypes and continuum group
In contrast, TG levels in approximately 90% of non-CM individuals were less than 500 mg/dl. Individuals in the type IV phenotype had the highest average TG levels among the three non-CM phenotypes, while type III individuals had the lowest overall TG levels (Table II).
As specified by our definition, individuals with the type I phenotype had significantly lower VLDL-C levels than with type V; 29 mg/dl (28–34) vs. 140.5 mg/dl (100–211), respectively (p < 0.001). The proportion of cholesterol content in large VLDL particles (VLDL1+2-C) relative to small VLDL particle (VLDL3-C) was increased in all FLL phenotypes, except type III, in comparison to the continuum group. In addition, this proportion of VLDL cholesterol in larger particles was significantly higher in type V individuals than all other HTG phenotypes.
With the exception of type I, all individuals with a HTG FLL phenotype had higher RLP-C levels than the continuum group. RLP-C levels (IDL-C + VLDL3-C) in type III patients were 1.5-times higher than that of the other HTG groups.
Cholesterol lipoproteins: TC, HDL-C and LDL-C
Type IIb had higher TC levels compared to the other HTG FLL phenotypes and continuum group. Both total and “real” LDL-C levels were significantly lower in hyper-CM (FLL types I and V) compared to non-CM HTG and continuum groups (Table II). However, Lp(a)-C was higher in hyper-CM groups compared to non-CM phenotypes and continuum group.
Levels of LDL-C subclasses among HTG FLL phenotypes are shown in Table II. Finally, type IIb individuals had the highest non-HDL-C levels (median 242 mg/dl). Hyper-CM phenotypes had significantly lower HDL-C levels compared to non-CM phenotypes. The former also had significantly elevated HDL2/HDL3-C ratio compared to the latter (0.44–0.50 vs. 0.27–0.33, p < 0.001). Levels of triglycerides and cholesterol-based parameters are summarized in Figure 1 for both hyper-CM and non-CM phenotypes.
Discussion
The present study includes comprehensive directly measured lipoprotein data on individuals with HTG FLL phenotypes from the Very Large Database of Lipids, the largest lipid study to date. In our study population, we estimated the frequency of HTG FLL phenotypes, under-recognized entities and often labeled as rare disorders, in a contemporary cross-sectional population. Whereas hyper-CM phenotypes are truly rare diseases, non-CM HTG phenotypes, which carry significant risk of premature CVD through pathways other than LDL-C [1], were seen in ~10% of our study population.
Hyperchylomicronemic phenotypes
Our findings provide insight into lipid metabolism in the two hyper-CM phenotypes. As expected, individuals in the hyper-CM phenotypes had extremely high TG levels (over 1000 mg/dl), at which the risk of acute pancreatitis is strikingly elevated compared to the general population [19].
We observed that individuals with the type V phenotype had TG levels almost two times higher than type I perhaps due to elevation of both chylomicrons and VLDL particles, both of which carry TG.
Hypertriglyceridemia stimulates the activity of cholesteryl ester transfer protein (CETP), enhancing the equimolar neutral lipid exchange of triglycerides from TRL to HDL and LDL while CE is transferred in the opposite direction. This loading of HDL and LDL particles with TG renders these particles better substrates for lipolysis by hepatic lipase, which promotes catabolism and renal elimination of HDL and production of smaller, denser and more numerous LDL particles. As HDL-C levels decrease, TG/HDL-C ratio increases [20]. HDL-C levels are significantly lower in the hyper-CM phenotypes compared to the non-CM phenotypes. This could be explained by the higher relative TG concentration gradient from chylomicrons to HDL particles, compared to VLDL or RLP to HDL particles [17]. Among the hyper-CM phenotypes in which we found higher TG levels among type V individuals, there was a ~2 fold higher TG/HDL-C ratio among type V individuals compared with type I. Additionally, levels of HDL2-C were similar between both hyper-CM groups, but HDL3-C levels were significantly greater in type I. Overall, we found that the HDL2/HDL3-C ratio in both hyper-CM phenotypes was greater than all other individuals in the database. Endogenous HTG, more often driven by VLDL overproduction like in patients with diabetes mellitus, is known for provoking a shift toward smaller sizes of HDL, such as pre-beta1-HDL and HDL3a [21]. As such, our findings could be the result of different pathophysiological mechanisms in hyper-CM phenotypes that are not seen in hypertriglyceridemia secondary to clinical conditions such as diabetes mellitus. Similarly, it could also be a manifestation of chylomicron particles being a less important source of triglyceride in the CETP pathway.
Levels of RLP-C in individuals with type V were almost two-fold higher than those with type I phenotype, likely reflecting the excess of VLDL particles since RLP-C contains VLDL3-C as one of its components [16]. Another consequence of such VLDL excess is reflected in the greater levels of TC, non-HDL-C and LDL-C observed in type V as compared to type I, the result of the metabolism of VLDL particles [22]. Similarly, levels of IDL-C (the other component of RLP-C) were also ~2 times higher in type V compared to type I phenotype. Finally, VLDL-C and VLDL1+2-C in type V dyslipidemia were almost 4 fold higher than other HTG phenotypes.
Surprisingly, logarithmic LDL density ratio (LLDR) was greater in type I (~ two-fold) compared to type V, despite the higher TG levels found in type V. This unexpected finding may be due to a greater presence of buoyant LDL which would naturally result from increased VLDL in type V, absent in type I. However, it should be noted that only 5 individuals were classified as type I, thus these results should be interpreted cautiously. Interestingly, Lp(a)-C was found to be higher among both hyper-CM compared to non-CM phenotypes, despite previous studies reporting a negative correlation between TG and Lp(a)-C levels. More studies are needed to confirm and further elucidate our novel finding of increased Lp(a) levels in patients with fasting chylomicronemia [23–25].
Non-chylomicronemic phenotypes
Among the non-CM phenotypes, individuals with type IV phenotype had the highest TG and the lowest HDL-C levels. Those with type IV phenotype had a lower HDL2/HDL3-C ratio compared to the type III and continuum groups, likely as a result of a given level of CETP activity leading to smaller denser HDL (HDL3) in the setting of the higher TG levels in type IV [26]. Individuals with the type III phenotype were noted to have a higher HDL2/HDL3-C ratio, which appears to be related to higher HDL2-C levels, and may indirectly reflect lower TG levels and lesser CETP activity. However, it is important to consider that individuals with other entities, such as hepatic lipase deficiency, can develop type III-like lipoprotein profile [27].
The type III (familial dysbetalipoproteinemia) FLL phenotype, also known as familial dysbetalipoproteinemia, is characterized by increased RLP-C and cholesterol enriched VLDL particles. This is believed to result from overproduction of VLDL combined with apolipoprotein-E (Apo E) structural variation reducing the clearance of RLP-C via the LDL receptor related protein [28]. Type III individuals had the highest levels of total VLDL-C among non-CM phenotypes, associated with significantly higher levels of remnant VLDL-C (VLDL3-C), since VLDL1+2-C levels were relatively similar among the three non-CM phenotypes. This is expected from the definition of type III, an elevated VLDL-C/TG ratio. Also, as expected, IDL-C levels were highest in type III patients, an elevation that was even slightly more striking than for VLDL3-C.
Interestingly, LLDR (LDL particle density) was lowest in type III dyslipidemia compared to other HTG phenotypes. The predominance of larger, buoyant LDL particle in type III might be related to the fact that median TG was lowest in type III among all HTG FLL phenotypes, and TG levels are known to be positively correlated with denser smaller LDL particles [29]. This is to our knowledge, however, a novel observation. Finally, our type III patients had a higher HDL2/HDL3-C ratio, related to higher HDL2-C levels, which might reflect lower net CETP effect (assuming similar CETP activity) due to lower TG levels. These findings of lower average density of both LDL and HDL activity would predict lesser ASCVD risk, which nonetheless is strikingly elevated in type III patients, thus, likely due to the VLDL and IDL changes. To our knowledge, these observations of decreased LDL and HDL particle density are novel in the scientific literature.
There are limitations of this study. First, intraindividual temporal variation was not addressed since we included only one-time sample collection for lipid measurement. Second, demographic variables such as biophysical status, race/ethnicity, or dietary habits were not available. Third, we did not have clinical data, such as lipid-lowering treatment (including TG-lowering therapies) or history of CVD. Fourth, genetic information, well characterized in HTG phenotypes [30], could not be obtained and so we relied on phenotypic characterization of the FLL classifications. Lastly, the cross-sectional nature of the study does not warrant the drawing of any conclusions regarding cause-effect relationships among the various elements of our lipoprotein data, and the lack of any ASCVD data does not allow any inference regarding our lipoprotein data and ASCVD event risk.
In conclusion, our findings provide important information about the frequency of FLL phenotypes in a large contemporary population, as well as the comprehensive distribution of lipoprotein levels in the setting of HTG phenotypes that include TG levels in the chylomicronemic range. The present study, although observational and hypothesis-generating, might help gain insight into the complexity of dyslipidemia, particularly in hypertriglyceridemic settings.
Conflict of interest
Drs. Martin and Jones are listed as coinventors on a pending patent filed by Johns Hopkins University for LDL-C estimation. Dr Jones has served as an advisor to Sano/Regeneron. Dr Martin has served as a consultant to Quest Diagnostics, Sano/Regeneron, Amgen, and the Pew Research Center. Dr. Joshi received non-compensated site PI for studies funded by AstraZeneca, Pfizer, Merck and Regeneron/Sanofi as well as modest consulting income from Regeneron. Dr. Toth has served as consultant and speaker for Amarin, Amgen, Kowa, Merck, Novo-Nordisk, Regeneron, and Sanofi; consultant to Gemphire. Dr. Brinton has received research support from Amarin, Kowa and the National Institutes of Health; honoraria as consultant for Akcea, Alexion, Amarin, Amgen, Janssen, Kastle, Kowa, Merck, Precision Biosciences, PTS Diagnostics, Regeneron, Sanofi-Aventis; honoraria as speaker for Akcea, Alexion, Amarin, Amgen, Boehringer-Ingelheim, Janssen, Kastle, Kowa, Merck, Novo-Nordisk, Regeneron, Sanofi-Aventis.