
Introduction
Herpes zoster, commonly known as shingles, is a painful and debilitating condition caused by the reactivation of the varicella-zoster virus (VZV), which also causes chickenpox [1, 2]. This viral infection typically presents as a unilateral, dermatomal rash accompanied by intense pain, often leading to a significantly diminished quality of life and potential long-term complications such as postherpetic neuralgia (PHN) [3]. Conventional treatment options for herpes zoster primarily involve the use of antiviral medications, corticosteroids, and analgesics to alleviate symptoms and expedite recovery [4]. However, these treatments may not always provide satisfactory pain relief or prevent complications, prompting the need for alternative therapeutic approaches.
One such promising approach is ozone major autohemotherapy (O3-MAHT), a medical technique involving the ex vivo administration of medical ozone (O3) to the patient’s blood, which is then reinfused into the body [5]. Ozone therapy has gained increasing attention due to its immunomodulatory, anti-inflammatory, and analgesic properties, as well as its potential to inactivate various pathogens, including viruses. Several studies have reported the successful application of O3-MAHT in treating various infectious and inflammatory conditions, with minimal adverse effects [6].
In addition to evaluating the clinical efficacy of O3-MAHT in treating herpes zoster, it is essential to understand the underlying changes in the patients’ metabolic profiles that may be indicative of the therapy’s effectiveness. Metabolomic analysis of blood samples provides a comprehensive assessment of the small molecules present within biological systems, offering valuable insights into the mechanisms of action of O3-MAHT and enabling the identification of potential biomarkers associated with treatment response [7].
Aim
In this study, we aim to investigate the clinical efficacy of O3-MAHT as an alternative treatment for herpes zoster by comparing its outcomes to those of standard antiviral therapy. Furthermore, we will employ metabolomic analysis to explore the metabolic changes induced by O3-MAHT in herpes zoster patients, with the goal of elucidating the mechanisms underlying its therapeutic effects and identifying potential prognostic or diagnostic biomarkers.
Material and methods
General information
Inclusion criteria: (1) Acute cervical, thoracic, and lumbar herpes zoster patients; (2) Patients using uniform medication during hospitalization, mainly including acyclovir injection for antiviral treatment, pregabalin, tramadol sustained-release tablets, and mecobalamin injections; (3) NRS score > 5 before admission.
Exclusion criteria: (1) Patients with severe heart, lung, liver, kidney, or brain diseases who cannot tolerate minimally invasive surgery; (2) Patients who cannot cooperate with NRS and Quality of Sleep (QS) scoring; (3) Patients with complicated comorbidities; (4) Patients receiving continuous epidural blockade during treatment.
Based on the above inclusion and exclusion criteria, 76 patients with acute herpes zoster admitted from May 2018 to May 2020 were selected for this trial, including the experimental group (n = 36) and the control group (n = 40). All included patients carefully read the informed consent form, understood, and agreed to the treatment methods used by our department.
Ozone major autohemotherapy
Sterile procedures were followed, and a 16–18 gauge specialized intravenous catheter was used to puncture the median cubital vein. 100 ml of the patient’s blood was collected using a dedicated transfusion device and an anticoagulant-antioxidant blood bag. An equal amount of medical ozone gas was quickly added, with concentrations increasing from 25, 30, to 40 µg/ml daily. After reaching 40 µg/ml, the concentration was no longer increased. The blood bag was shaken for 5 min in a single direction using a rocking machine to ensure thorough mixing before reinfusing the mixture into the patient. The entire process took no more than 30 min, with one session daily for a total of 10 sessions. Medical ozone gas was prepared using the German Medozon compact ozone therapy device.
Outcome measures
The NRS scores of patients in the experimental and control groups were recorded at baseline, 1 week, 1 month, 3 months, and 6 months post-treatment. QS scores were also recorded before treatment and at 1 week, 1 month, 3 months, and 6 months post-treatment. Sleep quality and medication usage were assessed after treatment.
Metabolomic analysis
Blood samples were collected from patients pre-admission and 6 months post-treatment. The samples were processed according to standard protocols for metabolomic analysis, which involved extracting and identifying metabolites using gas chromatography-time-of-flight mass spectrometry (GC-TOF-MS). Metabolite extraction involved a series of steps, including protein precipitation, derivatization, and subsequent analysis using GC-TOF-MS [8].
Sample collection and storage
Blood samples were collected using standard venipuncture techniques and stored in anticoagulant-treated tubes. The samples were immediately centrifuged to separate plasma, which was aliquoted and stored at –80°C until further analysis.
Statistical analysis
Data were analysed using SAS 9.2 statistical software. Categorical data were expressed as percentages and analysed using the χ2 test, while continuous data were presented as mean ± standard deviation and compared using analysis of variance. A p-value < 0.05 was considered statistically significant.
Results
General demographic information
Table 1 shows that the Ozone therapy group consisted of 36 patients, including 16 males and 18 females, with a diabetes co-morbidity rate of 32.35% and a pre-admission NRS score of 6.32 ±1.39. The control group included 49 patients, with 21 males and 28 females, a diabetes co-morbidity rate of 18.37%, and a pre-admission NRS score of 6.13 ±1.71. Statistical analysis showed no significant differences between the Ozone therapy and Normal control groups in age, gender, distribution of neuralgia segments, diabetes co-morbidity, pre-admission NRS score, and length of hospital stay, indicating the comparability of the study groups.
NRS Score comparison before and after treatment
The NRS scores of the experimental group at pre-admission, 1 week post-treatment, 1 month post-treatment, 3 months post-treatment, and 6 months post-treatment were all significantly lower than the pre-admission NRS score (Table 2). Similarly, the control group also showed significant reductions in NRS scores at 1 week, 1 month, 3 months, and 6 months post-treatment compared to pre-admission scores. However, after 1 week, 1 month, 3 months, and 6 months of treatment, the NRS scores of the diabetic group were significantly higher than those of the non-diabetic group. Regarding the proportion of patients with a 30% reduction in NRS scores, there was no significant difference between the diabetic and nondiabetic groups at discharge and 6 months post-discharge. There was also no significant difference in the proportion of patients still taking medication 6 months after discharge between the experimental and control groups (Table 3).
Table 2
NRS score changes before and after treatment for both groups
Table 3
Proportion of patients with a 30% decrease in NRS score
| Variable | Diabetic group | Non-diabetic group | P-value |
|---|---|---|---|
| NRS decrease ≥ 30% at discharge | 0 (0.00) | 4 (8.16) | 0.141* |
| NRS decrease < 30% at discharge | 34 (100.00) | 45 (91.84) | |
| NRS decrease ≥ 30% at 6 months | 4 (11.76) | 3 (6.12) | 0.437* |
| NRS decrease < 30% at 6 months | 30 (88.24) | 46 (93.88) |
Cytokine levels before and after treatment
The results (Table 4) showed significant differences in the levels of TNF-α, interferon, IL-4 at 10 days post-treatment between the ozone therapy and normal control groups (p < 0.05). However, no significant differences were observed for IL-2, IL-6, and IL-10 (p > 0.05) between these groups. In the ozone therapy group, the mean levels of TNF-a, Interferon, and IL-4 were 1.89 ±1.47, 3.91 ±2.52, and 1.99 ±1.32, respectively, 10 days post-treatment. In the normal control group, the mean levels of TNF-a, interferon, and IL-4 were 2.74 ±1.89, 2.58 ±1.66, and 2.85 ±1.47, respectively, 10 days post-treatment.
Table 4
Cytokine levels in ozone therapy and normal control groups before and after treatment
Metabolomic analysis of serum before and after ozone therapy
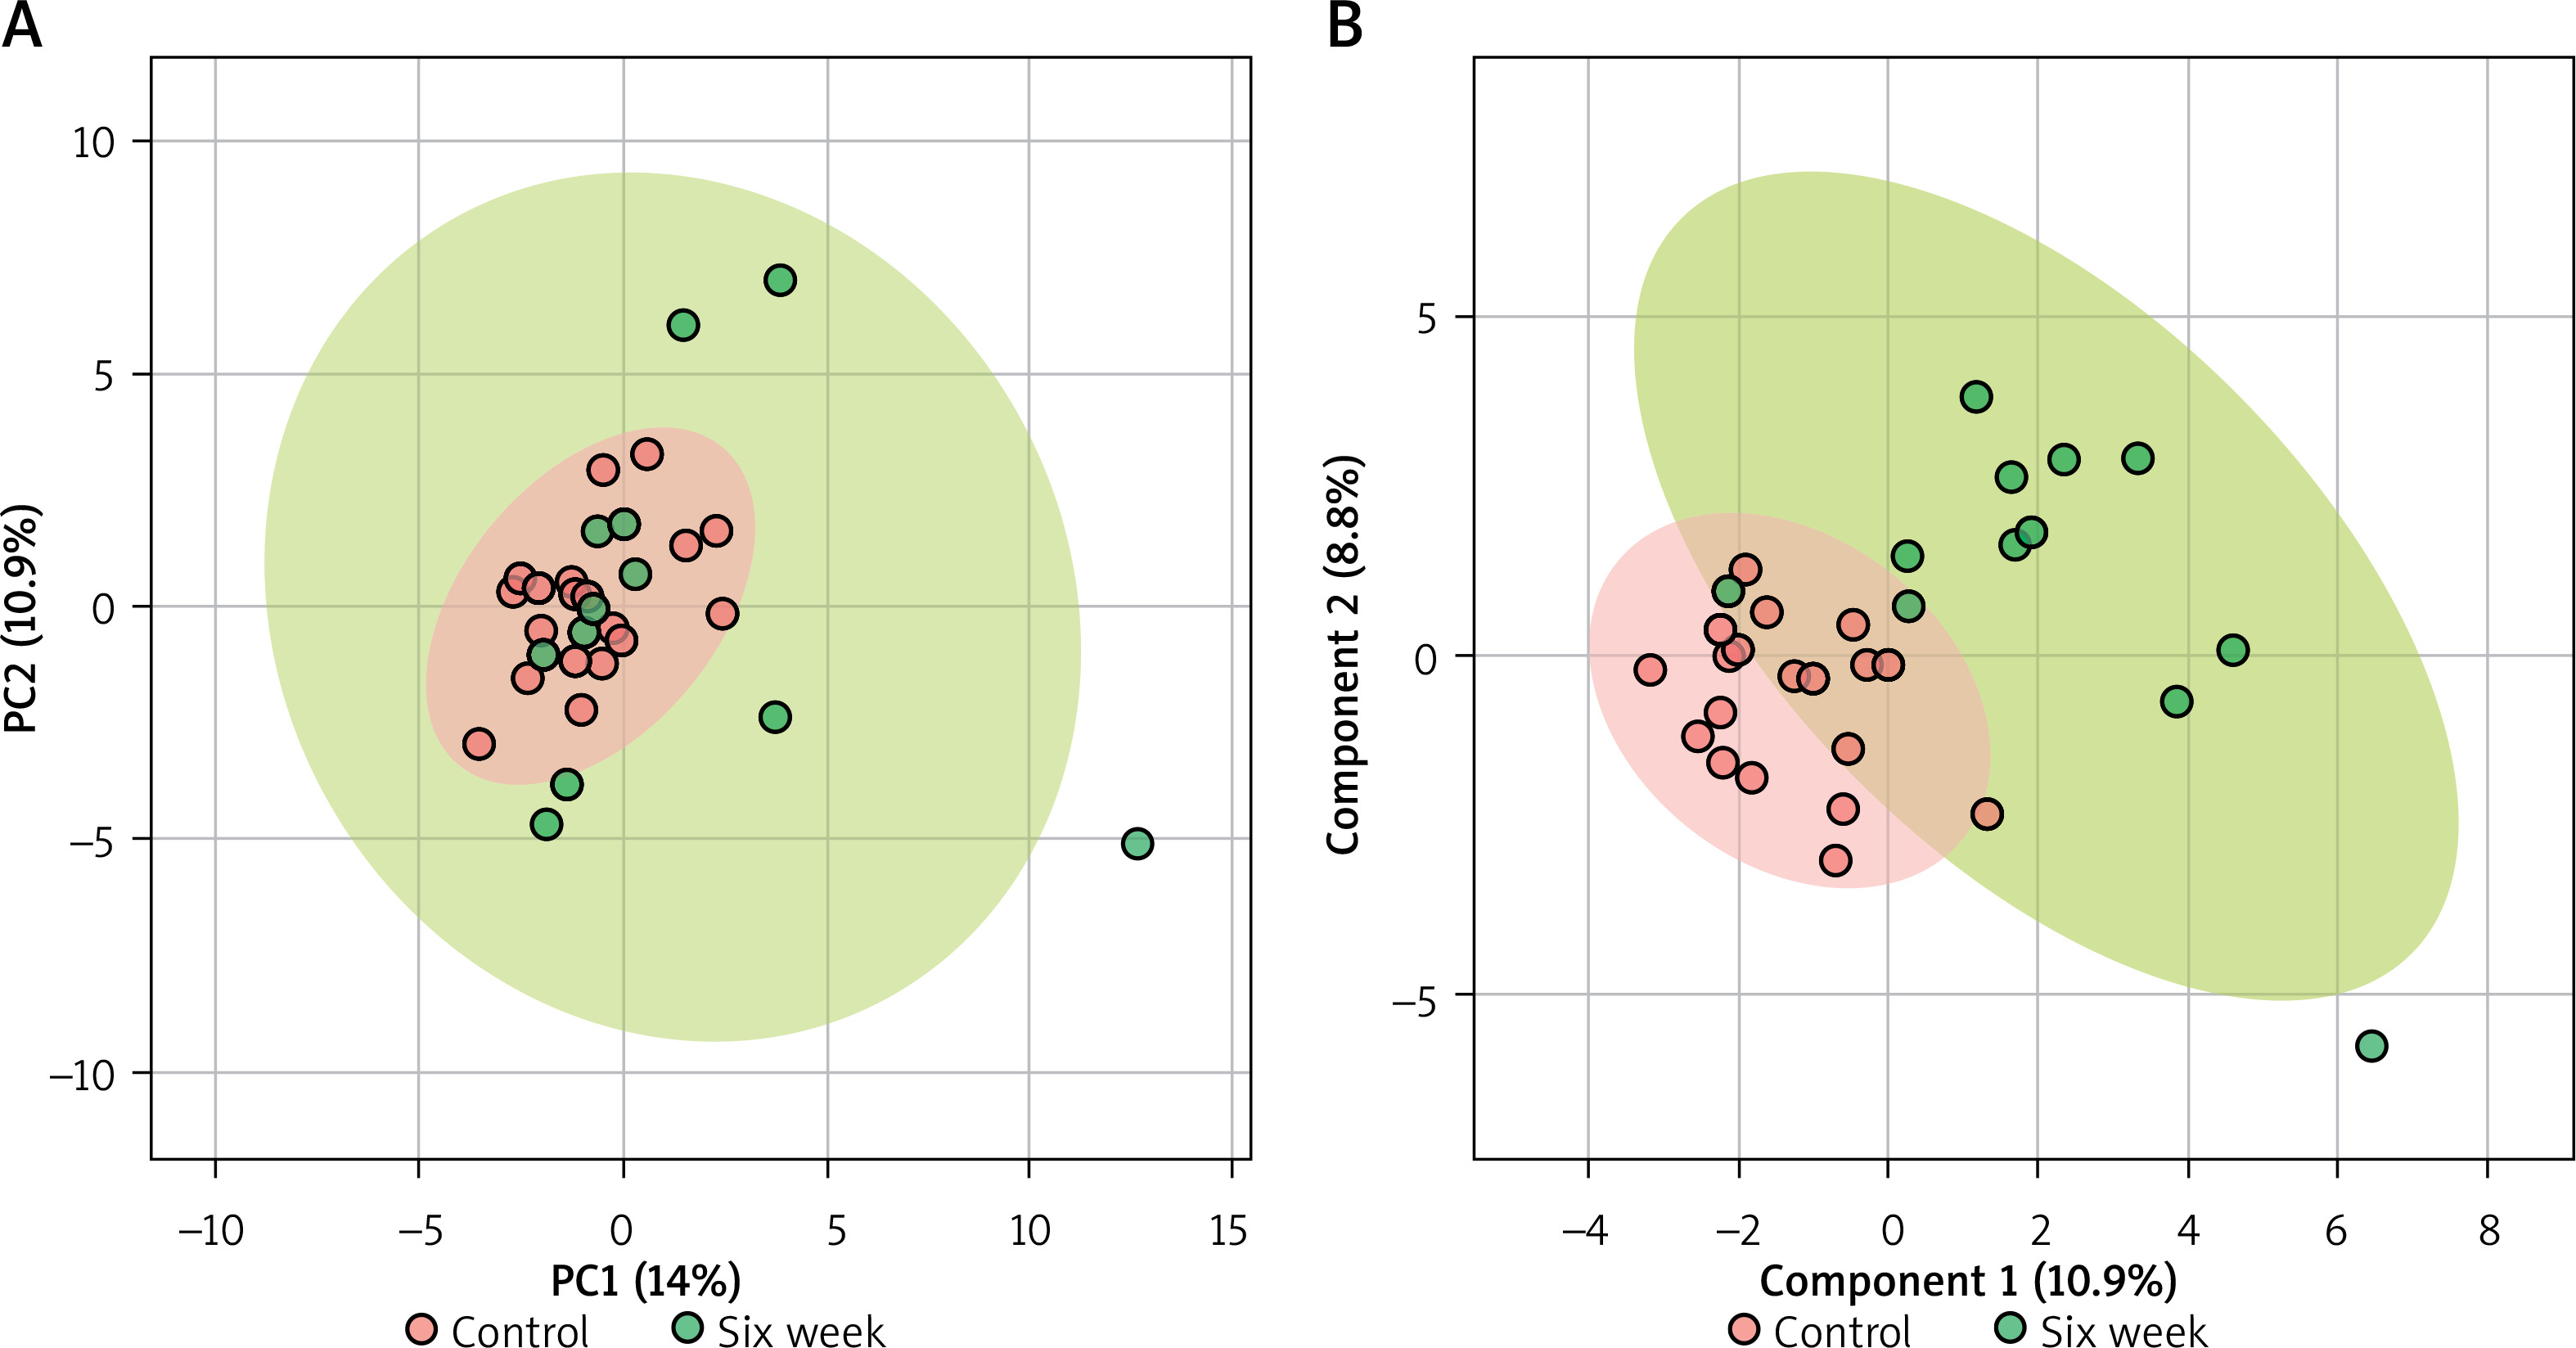
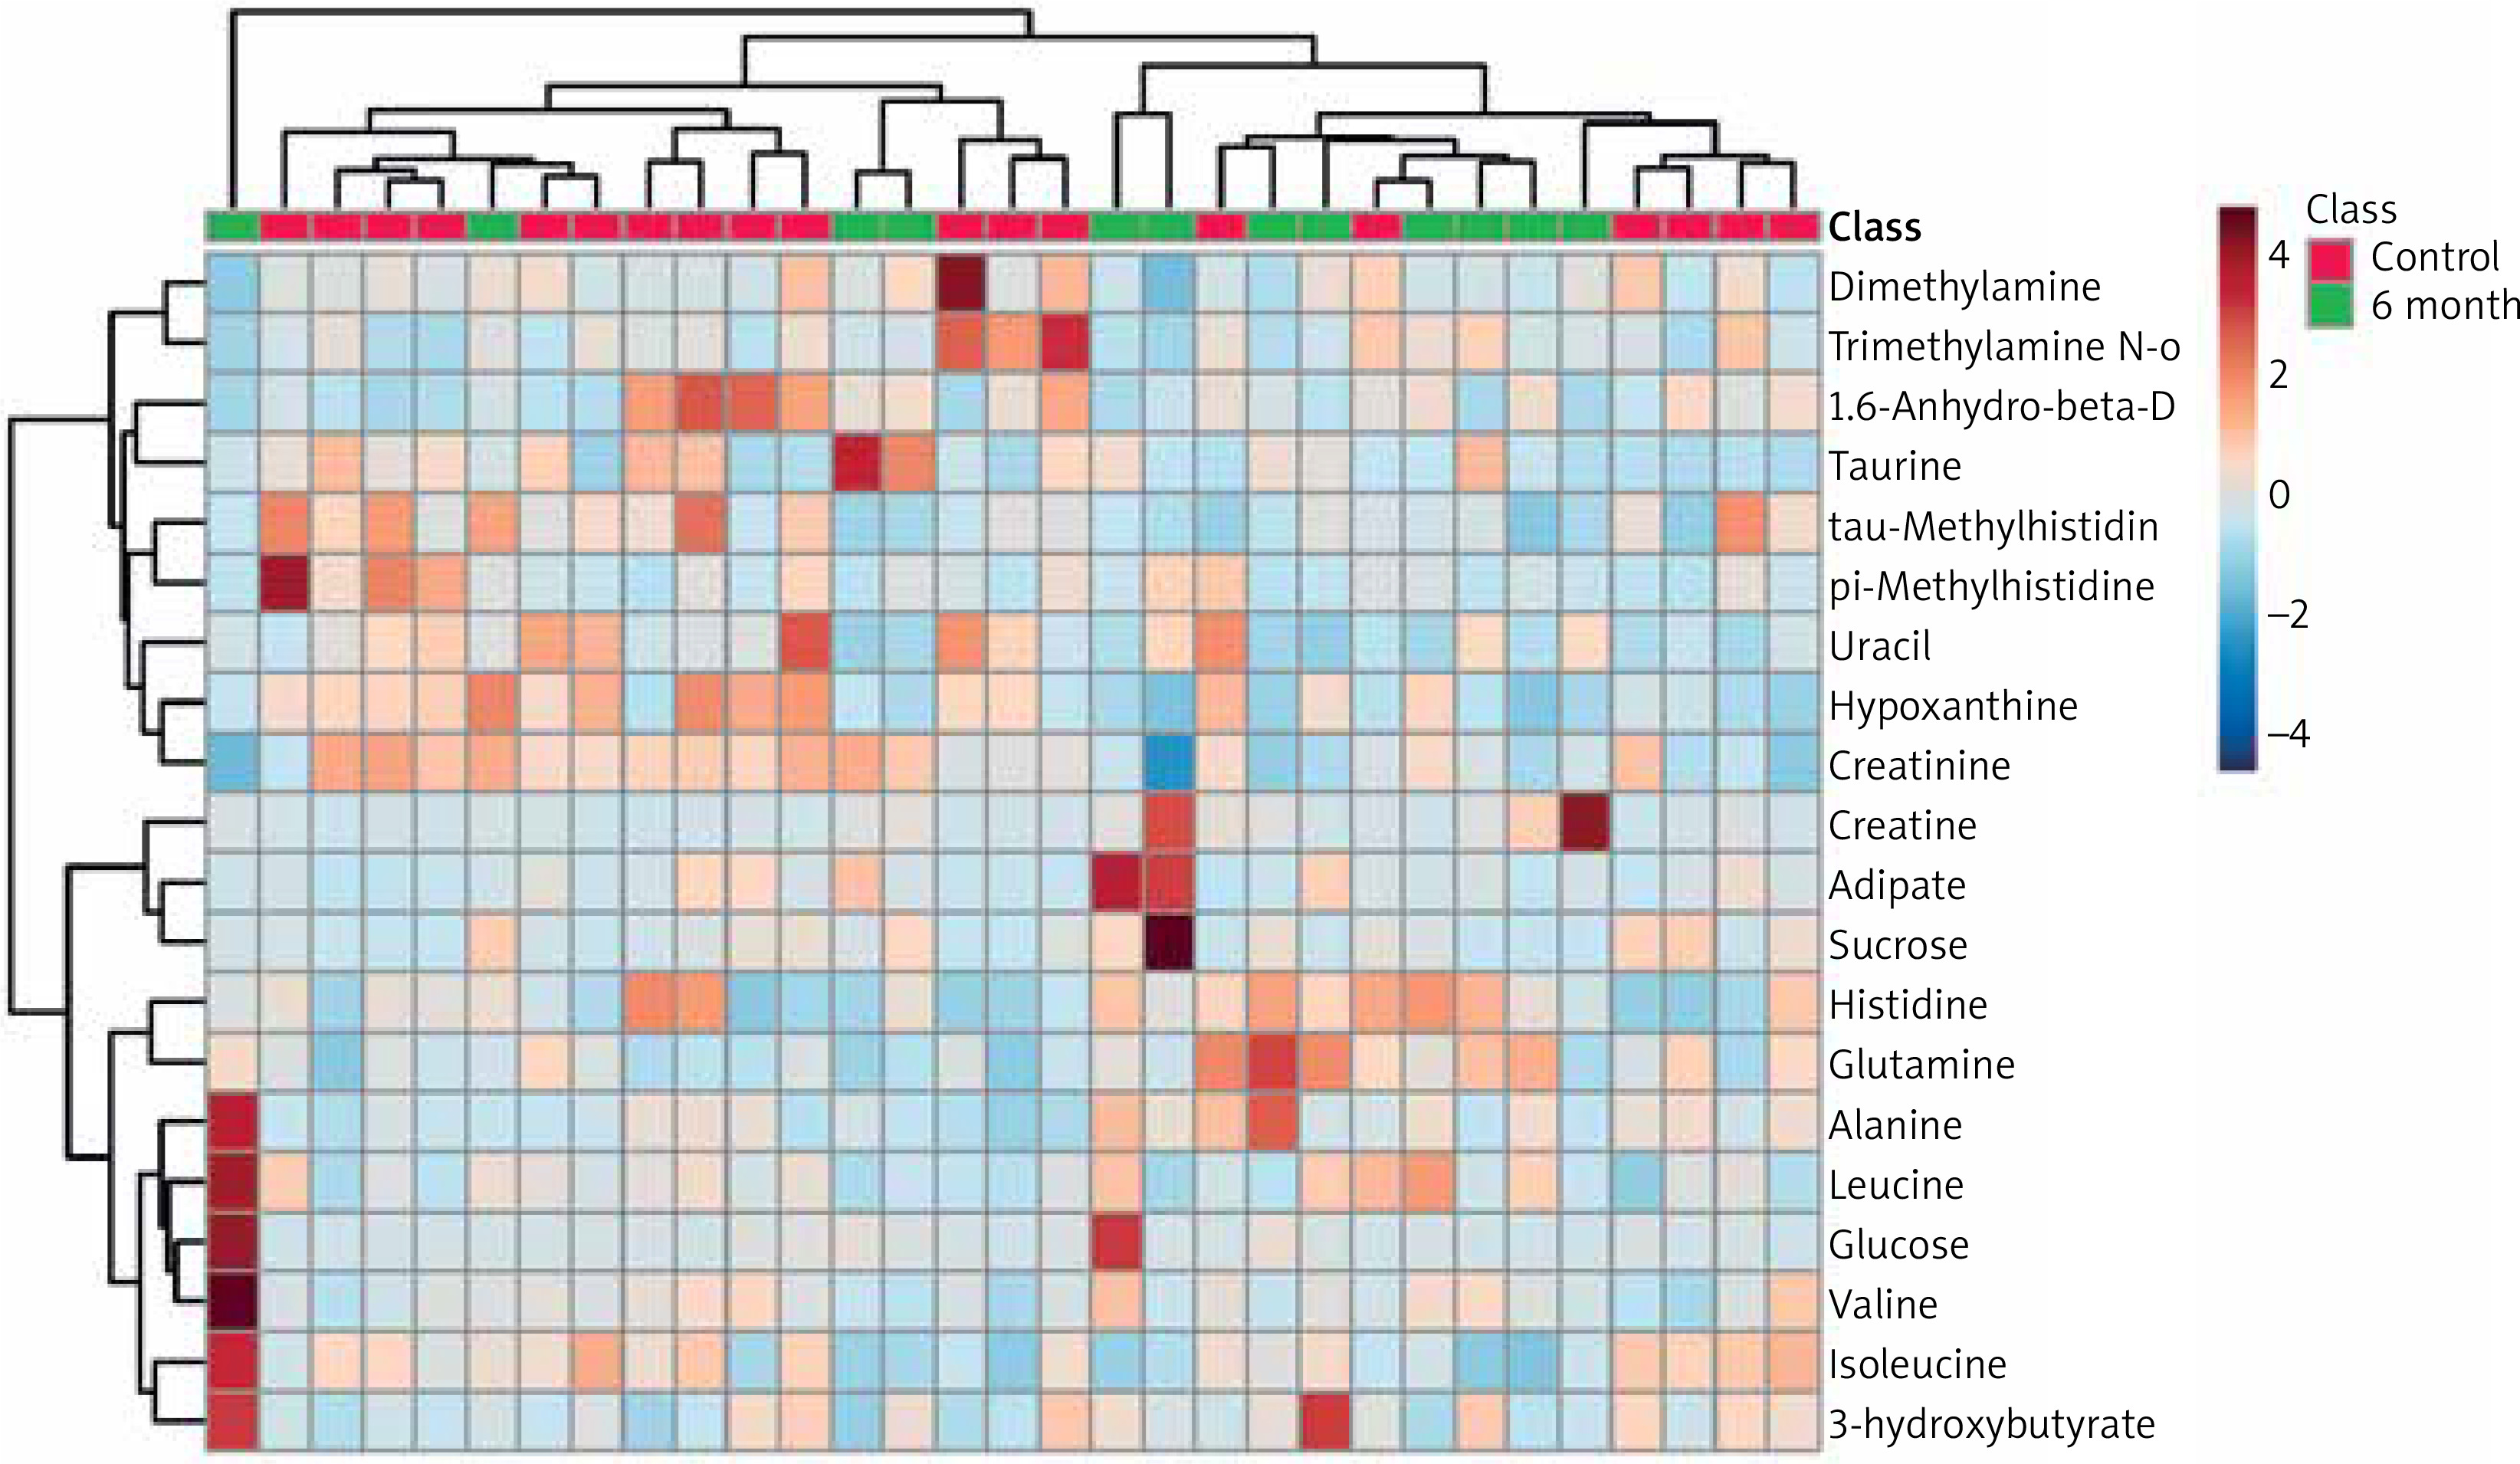
In the serum metabolomics results, Figure 1 A illustrates the PCA analysis of serum metabolomics, indicating that although a clear distinction between pre-treatment and post-treatment at 6 months is not evident, a separation trend can be observed. Figure 1 B demonstrates the PLS-DA results, showing a noticeable differentiation between the pre-treatment and post-treatment groups under supervision. Figure 2 represents a heatmap of the top 25 metabolites with p < 0.05. Based on the selection criteria of P < 0.05 and log2(FC) > 1 or log2(FC) < 1, three metabolites were identified (Table 5), which are Creatine, Adipate, and Glucose. These three metabolites exhibited significant decreases following the treatment.
Figure 1
Metabolomic analysis of serum samples before and after ozone autohemotherapy treatment. A – Principal Component Analysis (PCA) of the serum metabolomics data. Although no clear distinction is observed between the pretreatment and 6-month post-treatment groups, a separation trend is evident. B – Partial Least Squares-Discriminant Analysis (PLS-DA) results demonstrate a clear distinction between the pre-treatment and 6-month post-treatment groups under supervised conditions
Discussion
Herpes zoster, caused by the varicella-zoster virus, is a painful condition that often leads to postherpetic neuralgia (PHN). PHN is more prevalent in older patients, those with underlying health conditions, weakened immune systems, and poor constitution. Despite numerous available treatments, pain management remains a challenge, leading to prolonged pain, disrupted work, and increased financial burden. Herpes zoster frequently presents as severe, unbearable pain that impacts sleep, daily activities, and work, while effective medications and treatments are lacking.
In recent years, ozone autohemotherapy has shown promising results in treating neuropathic pain and has gained increasing attention from clinicians. In this study, we found no significant difference in the NRS scores between the experimental and control groups upon admission (p > 0.05), indicating comparability between the two groups. However, significant improvements in NRS scores were observed 1 week, 1 month, 3 months, and 6 months after treatment in both groups (p < 0.05), suggesting that ozone autohemotherapy effectively alleviates PHN-related pain. Furthermore, medication usage (pregabalin or tramadol extended-release tablets) decreased after ozone autohemotherapy, with a 1-month post-treatment drop in usage (control group: 29.4%, experimental group: 18.37%). Overall, ozone autohemotherapy is a highly effective treatment for acute herpes zoster and is one of the viable treatment options for PHN.
In our study, there was no significant difference in NRS scores between the experimental and control groups upon admission (p > 0.05). However, lower NRS scores were observed in the experimental group 1 week, 1 month, 3 months, and 6 months after treatment compared to the control group, with statistically significant differences (p < 0.05), indicating superior treatment outcomes in the experimental group. We observed a lower incidence of herpes zoster complications in the experimental group, though the underlying mechanism remains unclear. Potential explanations include molecular biological mechanisms, such as TNF-a activation of downstream signalling pathways (e.g., P38MAPK, c-JNK, NF-kB), regulation of pain mediators (e.g., calcitonin gene-related peptide, substance P), and promotion of pro-inflammatory cytokines (e.g., IL-1b, IL-6) involved in neuropathic pain formation [9, 10]. Additionally, elevated TNF-a and IL-6 levels in herpes zoster patients during the acute phase may contribute to PHN-related neuropathic pain. Ozone autohemotherapy can act on immune-active cells, inducing the production of interferons, interleukins, TNF-a, TGF-b, and GM-CSF, thereby activating and regulating immune function, enhancing the body’s defence mechanisms, and ultimately restoring the normal pain-regulating function of the thalamus [11].
The PCA and PLS-DA analyses of the serum metabolomic data revealed a trend of separation between the pre- and post-treatment groups, with the supervised PLS-DA analysis demonstrating a more distinct differentiation between these groups [12]. This suggests that ozone therapy has a measurable impact on the serum metabolome, which may potentially reflect the underlying biological changes resulting from the treatment. The heatmap analysis of the top 25 metabolites with p < 0.05 indicated alterations in the serum metabolite profiles before and after ozone therapy. Furthermore, we identified three metabolites, namely creatine, adipate, and glucose, which exhibited significant changes in their levels following treatment, according to the established criteria of p < 0.05 and log2(FC) greater than 1 or less than –1. These metabolites could potentially serve as biomarkers to monitor the treatment response and guide therapeutic decision-making in clinical settings.
Creatine, a key component of the energy metabolism, plays a crucial role in maintaining cellular ATP levels. A reduction in creatine levels following ozone therapy could suggest an improvement in energy metabolism and cellular function, which may contribute to the observed pain relief in patients with peripheral neuropathy [13]. Adipate, an intermediate in the fatty acid metabolism, is involved in energy production and lipid signalling. Its decreased levels post-treatment could indicate a modulation of lipid metabolism, which has been implicated in the pathophysiology of peripheral neuropathy [14]. Finally, the reduction in glucose levels after ozone therapy could be particularly relevant for diabetic patients, as high glucose levels are a major contributing factor to the development and progression of diabetic neuropathy [15]. It is possible that the observed decrease in glucose levels may contribute to the amelioration of neuropathic symptoms in these patients.
Conclusions
Our study demonstrates the potential benefits of ozone autohemotherapy for treating patients with peripheral neuropathy, particularly in the context of pain management. The changes in serum metabolite profiles, as identified through our metabolomic analysis, provide valuable insights into the underlying mechanisms of ozone therapy, and may aid in the identification of biomarkers to monitor treatment response. Further studies with larger sample sizes and a more diverse patient population are warranted to confirm and extend these findings, and to explore the potential long-term benefits and safety profile of ozone therapy for peripheral neuropathy.


