Introduction
Non-alcoholic fatty liver disease (NAFLD) is a non-infectious liver disease closely related to liver cirrhosis and cancer; it is seen commonly in patients with metabolic abnormalities associated with obesity, especially those with diabetes, dyslipidaemia, and metabolic syndrome. However, not all obese subjects develop NAFLD, and, more importantly, NAFLD also develops in lean individuals, which we call lean NAFLD. The risk factors of lean NAFLD remain poorly defined. Sexual dimorphism, age or postmenopausal status, serum level of lipid profile, and blood glucose were associated with the risk of NAFLD [1], Comparing the clinical features of obese NAFLD and lean NAFLD helps us better understand the pathogenesis of NAFLD.
Material and methods
Patients
One thousand six hundred and eight cases of physical examination were selected from the Physical Examination Centre of the China-Japan Union Hospital of Jilin University between 2015 and 2016. All cases accepted abdominal ultrasound and FibroScan examination. History of alcohol consumption and medication used within the preceding 3 months were investigated. Serum antibodies of hepatitis virus A, B, C, and E were tested. Autoimmune and hereditary liver disease were also excluded. Finally, 496 cases diagnosed with NAFLD were enrolled in this study. The detailed diagnostic criteria were according to the guidelines for NAFLD management formulated by the Chinese National Workshop on Fatty Liver Disease in 2010 [2]. NAFLD was diagnosed according to the following criteria: (1) alcohol consumption < 140 g/week for male adults and < 70 g/week for female adults; (2) absence of viral hepatitis (hepatitis B virus (HBV)/hepatitis C virus (HCV)), hepatolenticular degeneration, autoimmune diseases, a history of total parenteral nutrition, or intake of any hepatotoxic drugs (e.g. tamoxifen, amiodarone, sodium valproate, methotrexate, and glucocorticoid); and (3) ultrasonographic examination suggesting fatty infiltration in the liver and controlled attenuation parameter (CAP) ≥ 240 db/m.
Study designs
The NAFLD patients were divided into two groups according to BMI: an obese NAFLD group (BMI ≥ 25 kg/m2) and a lean NAFLD group (BMI < 25 kg/m2). Gender, age, alanine aminotransferase (ALT), triglycerides (TG), cholesterol (CHOL), and the level of blood glucose were compared between two groups.
Results
Comparison of gender distribution and elevated ALT occurrence between the lean NAFLD group and the obese NAFLD group
The proportion of males was higher than females in both the lean NAFLD (58.42% vs. 41.58%) and obese NAFLD group (75.19% vs. 24.81%), but this male-dominated discrepancy of gender distribution was more evident in the obese NAFLD group, and a statistically significant difference was found if compared with the lean NAFLD group (p = 0.0008). Elevated ALT was more common in the obese NAFLD group (69.11% vs. 30.89%) compared with the lean NAFLD group (79.21% vs. 20.79%) (p = 0.0456) (Table I).
Table I
Comparison of gender distribution and elevated ALT occurrence between the lean NAFLD group and the obese NAFLD group
| Parameter | Lean NAFLD (n = 101) | Obese NAFLD (n = 395) | P-value |
|---|---|---|---|
| Male/female, n (%) | 59/42 (58.42/41.58) | 297/98 (75.19/24.81) | 0.0008 |
| Normal ALT*/elevated ALT, n (%) | 80/21 (79.21/20.79) | 273/122 (69.11/30.89) | 0.0456 |
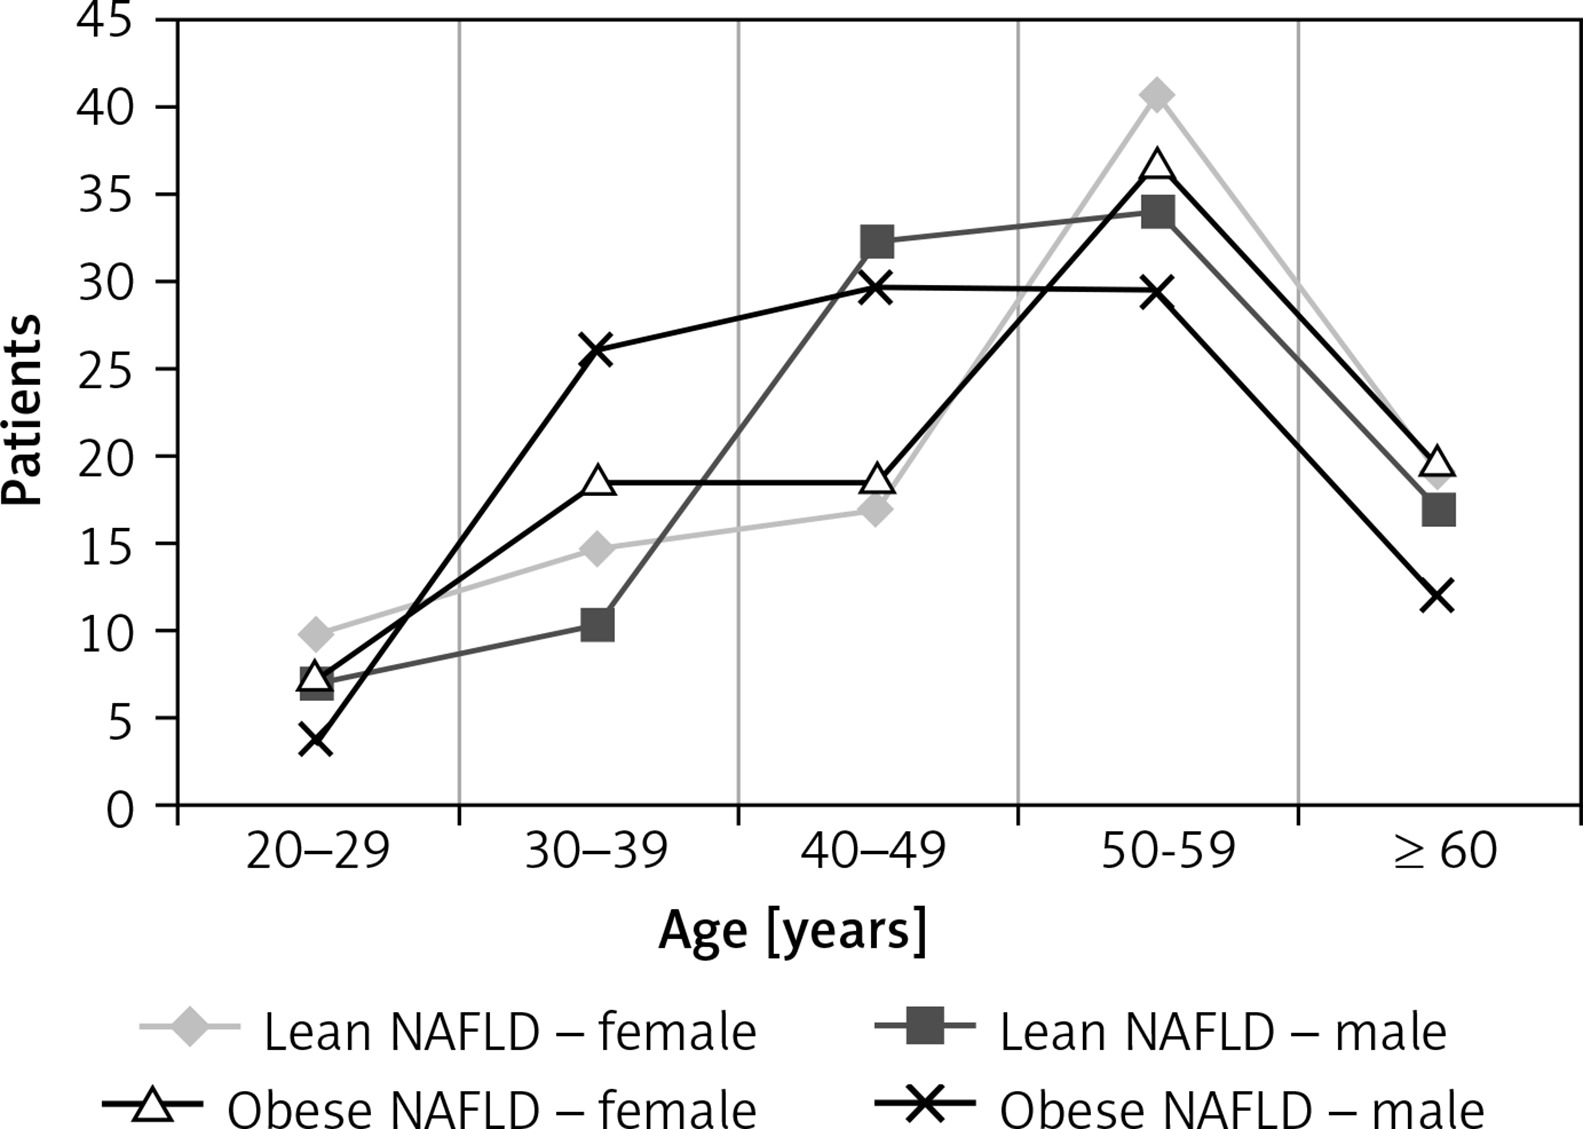
Comparison of age distribution and trend between the lean NAFLD group and the obese NAFLD group
50–59 years was the peak age of both lean and obese NAFLD, and there was no significant difference in gender distribution during this period (p > 0.05). While statistically significant differences in gender distribution were found in the 40–49-year-old age group, the proportion of males was higher than that of females, regardless of lean NAFLD (p = 0.0784) or obese NAFLD (p = 0.0291) (Table II, Figure 1).
Table II
Comparison of age distribution between the lean NAFLD group and the obese NAFLD group
| Age [year] | Lean NAFLD (n = 101) | Obese NAFLD (n = 395) | ||
|---|---|---|---|---|
| Female (n = 42) | Male (n = 59) | Female (n = 42) | Male (n = 59) | |
| 20–29 | 4 (9.52%) | 4 (6.78%) | 7 (7.14%) | 10 (3.37%) |
| 30–39 | 6 (14.29%) | 6 (10.17%) | 18 (18.37%) | 77 (25.93%) |
| 40–49 | 7 (16.67%)** | 19 (32.20%)* | 18 (18.37%)$$ | 88 (29.63%)$ |
| 50–59 | 17 (40.48%) | 20 (33.90%) | 36 (36.73%) | 87 (29.29%) |
| ≥ 60 | 8 (19.05%) | 10 (16.95%) | 19 (19.39%) | 35 (11.78%) |
Comparison of serum levels of TG between the lean NAFLD group and the obese NAFLD group
To avoid the effects of CHOL and low-density lipoprotein cholesterol (LDL-C), 302 cases of NAFLD patients with normal CHOL and LDL-C were elected to analyse the difference of TG level between the lean NAFLD group and the obese NAFLD group (Table III).
Table III
Comparison of serum levels of TG between the lean NAFLD group and the obese NAFLD group
| Parameter | Lean NAFLD (n = 43) | Obese NAFLD (n = 259) |
|---|---|---|
| Normal TG (< 1.7 mmol/l) | 29 (62.44%)** | 104 (40.15%)* |
| Normal high limit TG (1.7~2.25 mmol/l) | 7 (16.28%) | 58 (22.39%) |
| Elevated TG (> 2.25 mmol/l) | 7 (16.28%)## | 97 (37.45%)# |
The proportion of normal TG patients was higher in the lean NAFLD group (p = 0.0008), while the proportion of elevated TG patients was higher in the obese NAFLD group (p = 0.0068).
Comparison of serum levels of CHOL between the lean NAFLD group and the obese NAFLD group
To avoid the effects of TG, 176 cases of NAFLD patients with normal TG were chosen to analyse the difference of CHOL level between the lean NAFLD group and the obese NAFLD group. No statistically significant difference in the proportion of elevated CHOL patients was found between the two groups (p = 0.8715) (Table IV).
Comparison of serum levels of blood glucose between the lean NAFLD group and the obese NAFLD group
The proportion of elevated fasting glucose patients in the obese NAFLD group was higher than that in the lean NAFLD group (18.48% vs. 8.91%, p = 0.0209) (Table V).
Table V
Comparison of serum levels of blood glucose between the lean NAFLD group and the obese NAFLD group
| Parameter | Lean NAFLD | Obese NAFLD | ||||
|---|---|---|---|---|---|---|
| Total (n = 101) | Female (n = 42) | Male (n = 59) | Total (n = 395) | Female (n = 98) | Male (n = 297) | |
| Elevated fasting glucose (≥ 7.0 mmol/l) | 9## (8.91%) | 2 (4.76%) | 7 (11.86%) | 73# (18.48%) | 19 (19.39%) | 54 (18.18%) |
| Impaired fasting glucose (6.1~6.9 mmol/l) | 10 (9.90%) | 2 (4.76%) | 8 (13.56%) | 49 (12.41%) | 14 (14.29%) | 35 (11.78%) |
| Normal fasting glucose (< 6.1 mmol/l) | 82 (81.19%) | 38 (90.48%)** | 44 (74.58%)* | 273 (69.11%) | 65 (66.33%) | 208 (70.03%) |
In the lean NAFLD group there was a statistically significant difference in gender distribution among different fasting glucose level groups. The proportion of females was higher in the normal fasting glucose group (90.48% vs. 74.58%, p = 0.0209).
Discussion
Nonalcoholic fatty liver disease has become the most common chronic liver disease in the world, which not only damages the liver, but also promotes the progression of other diseases such as cardiovascular disease and metabolic syndrome. The prevalence of NAFLD is different between lean and obese people, but the current study on NAFLD mainly focuses on the obese population and the lack of lean people. In this paper, the clinical characteristics of lean NAFLD patients were analysed based on indexes such as gender, age, serum levels of TG, CHOL, glucose, and ALT.
It has been reported that NAFLD more often affects men, and premenopausal women are equally protected against developing NAFLD as they are from developing cardiovascular disease [3]. Our results showed that the proportion of males was higher than females in both the lean NAFLD and obese NAFLD groups, but this male-dominated discrepancy of gender distribution was more evident in the obese NAFLD group. 50–59 years was the peak age of both lean and obese NAFLD, and no significant difference in gender distribution was found in this age group. While gender discrepancy was found in the 40–49-year-old age group, the proportion of males was higher than that of females regardless of lean NAFLD or obese NAFLD. Changes in menopausal hormone levels may be responsible for these results. It has been suggested that 17β-oestradiol (E2) appears to downregulate hepatic lipogenesis in humans, and women often gain weight during menopause because of the dramatic reduction of circulating E2, which may only exaggerate the rise in overweight and obesity, particularly in older adults.
Dyslipidaemia is a common metabolic feature in individuals with NAFLD. The relationship between dyslipidaemia and NAFLD has been a hot topic in recent years, but the characteristics of serum lipid profile in lean NAFLD patients were seldom reported. Dyslipidaemia is characterised by increased triglycerides, decreased HDL cholesterol, and increased LDL cholesterol [4]. To avoid the interaction between different blood lipid components, 302 cases of NAFLD patients with normal CHOL and LDL-C and 176 cases of NAFLD patients with normal TG were chosen individually to analyse the difference of TG and CHOL level between the lean NAFLD group and the obese NAFLD group. We found that elevated TG patients was higher in the obese NAFLD group, while no statistically significant difference in the proportion of elevated CHOL patients was found between the two groups. Hypertriglyceridaemia itself may play a pathogenic role in the development of NAFLD, but there is no highly persuasive evidence. Kim et al. found that hypertriglyceridaemia was an independent predictor for both the development and prognosis of NAFLD and suggested that serum triglyceride level could be an early marker for the progression of NAFLD, especially in lean people [5].
NAFLD is a cause and effect of insulin resistance (IR) [6]. To understand if lean NAFLD also has an effect on blood glucose level, the proportion of patients with different blood glucose levels in the two groups was compared – as expected, we found that the proportion of elevated fasting glucose patients in the obese NAFLD group was higher than that in the lean NAFLD group. More interestingly, in the lean NAFLD group, there was a statistically significant difference in gender distribution among different fasting glucose level groups – the proportion of females was higher in the normal fasting glucose group, which may be related to sexual dimorphism in abnormal metabolism in NAFLD. When we compare the abnormal rate of ALT between lean and obese NAFLD groups, we found that elevated ALT was more common in the obese NAFLD group, which suggests a higher risk of development of NASH and maybe worse outcome in overweight/obese NAFLD patients.
In conclusion, sexual dimorphism exists in lean NAFLD patients, but this trend was most pronounced during the stage of 40–49-year-old age group and disappeared after entering the 50–59-year-old stage. In lean NAFLD patients, normal levels of TG and blood glucose were more common, and the occurrence of NASH was less common than in obese NAFLD patients. Although the data covered in this study are limited, these results may provide some information that is useful in expanding our understanding of the pathogenesis and providing hints for prevention and treatment of NAFLD.