Introduction
For the determination of low-density lipoprotein cholesterol (LDL-C) levels in blood, various direct measurement methods are available. Apart from β-quantification, which is the gold standard and requires ultracentrifugation, several simpler and faster, homogeneous, automated measurement techniques are used [1, 2]. In Hungary and in many other European countries, for technical reasons or simply due to lack of financial resources, directly measured LDL-C is not available. Without direct measurement of LDL-C the calculation of LDL-C according to Friedewald’s formula is acceptable (LDL-C = total cholesterol (TC) – high-density lipoprotein cholesterol (HDL-C) – triglycerides (TG)/2.2) if the TG level is less than 4.5 mmol/l (400 mg/dl) [3]. In this formula the HDL-C value subtracted from TC corresponds to the non-HDL-C and TG/2.2 denotes the cholesterol content of triglyceride enriched remnant lipoprotein particles (i.e., remnant cholesterol (RC)) or simply very low-density lipoprotein cholesterol (VLDL-C) [4, 5]. Recent investigation has established the importance of RC in atherogenesis and risk of acute cardiovascular events [6, 7].
There has been criticism as to the applicability of LDL-C calculated with Friedewald’s formula, especially for patients with TG levels of almost 4.0 mmol/l (348 mg/dl) and for those who have LDL-C levels under 1.8 mmol/l (70 mg/dl), which can be attained by means of lipid-lowering therapy [8, 9]. Various modifications have been developed to answer the question how the calculated LDL-C values could better approximate the direct LDL-C level, but none of these have resulted in any substantive improvement to date [10–13]. Martin et al. developed a more exact, novel method for estimating LDL-C from the standard lipid profile (Martin/Hopkins calculation) [14–16]. The Friedewald equation assumes a fixed factor of 5 for mg/dl or 2.2 for mmol/l for the ratio of triglycerides to very low-density lipoprotein cholesterol (TG/VLDL-C); however, the actual TG/VLDL-C ratio varies significantly across the range of triglyceride and cholesterol levels. The Martin/Hopkins novel LDL-C estimates were derived as (non-HDL-C) – triglycerides/adjustable factor, where the adjustable factor was determined as the strata-specific median TG/VLDL-C ratio. In view of the need to particularize lipoprotein quantification in population specific ways [17], herein we investigate how the direct and calculated LDL-C values agree or disagree in Hungarian patients and how these relate to VLDL-C levels.
Material and methods
In the Szent György University Teaching Hospital of Fejer County directly measured LDL-C is available for specialists treating vascular disorders, so we were able to compare the direct LDL-C with calculated LDL-C levels. For this analysis a database of laboratory measurements for more than 15 000 patients was used which included the TC (4.88 ±1.34 mmol/l) (189 ±52 mg/dl), HDL-C (1.34 ±0.39 mmol/l) (52 ±15 mg/dl), TG (1.74 ±1.12 mmol/l) (153 ±99 mg/dl), non-HDL-C (3.53 ±1.20 mmol/l) (136 ±46 mg/dl) and direct LDL-C (3.07 ±0.98 mmol/l) (119 ±38 mg/dl) values for everyone, and these were determined in 2017. The study was approved by the Local Research Ethics Committee. The lipid concentrations were measured with an automatic biochemistry analyser (Beckman Coulter AU5800, USA). In detail, TC was tested by the CHOP-PAP method (Cholesterol Kit OSR6116, CDC Reference Method (Abell-Kendall), System Calibrator No. 66300, Quality Control ODC0003) with a coefficient of variation of less than 3% [18]. The TG level was detected by the GPO-PAP method (Isotope Dilution Mass Spectrometry Reference Method, Triglyceride Kit OSR6118, System Calibrator No. 66300, Quality Control ODC0003) with a coefficient of variation less than 4%. The LDL-C measurement was performed by means of the direct homogeneous method Wako (LDL-C Calibrator ODC0012, CDC Reference Method, Quality Control ODC0005). Using this method, the coefficient of variation was less than 5% [19, 20]. Similarly, the HDL-C concentration was also determined by a homogeneous method (HDL-C Calibrator ODC0011, CDC Reference Method, Quality Control ODC0005) with a coefficient of variation of < 5%. From the values given by the laboratory we calculated the F-LDL-C and MH-LDL-C by the Friedewald and Martin/Hopkins formulas, respectively, and we determined the remnant cholesterol (RC) values (RC = non-HDL-C – LDL-C). In the case of Di-LDL-C (direct measured LDL-C by homogeneous assay) this means: Di-RC (calculated RC from non-HDL-C minus Di-LDL-C) = non-HDL-C – Di-LDL-C, and in the case of MH-LDL-C this means: MH-RC = non-HDL-C – MH-LDL-C or in the case of F-LDL-C this means: F-RC (calculated RC from non-HDL-C minus F-LDL-C (= TG/2.2) = non-HDL-C – F-LDL-C.
Consistent with the original recommendation, for this analysis we used only the data of persons who had a TG level < 4.5 mmol/l (< 400 mg/dl) (N = 14 906). During the analysis we used four TG ranges: < 1.0 mmol/l (< 88 mg/dl) (N = 3587, 24%), 1.0–1.69 mmol/l (88–149 mg/dl) (N = 5908, 40%), 1.7–2.29 mmol/l (150–200 mg/dl) (N = 2676, 18%), and 2.3–4.5 mmol/l (201–400 mg/dl) (N = 2735, 18%). From the laboratory determinations conducted using the data of 14 906 individuals, the non-HDL-C and Di-LDL-C values were available. The gender, age, medical history, and pharmacologic regimen of the patients investigated were not available; thus additional related analyses could not be performed.
Statistical analysis
Data were analyzed using SPSS for Windows (Version 22.0; SPSS Inc, Chicago, IL, USA). All statistical outcomes were based on two-sided tests, and a p-value less than 0.05 was considered statistically significant. Data were reported as mean ± SD. Linear relationships were determined from standard Pearson correlation coefficients by linear regression between the three LDL-Cs (Di-LDL-C, F-LDL-C, and MH-LDL-C). Concordances in classification between calculated LDL-C and directly measured LDL-C were examined through cross-tabulations by LDL-C and TG categories. We used κ scores: 0.01–0.2 slight; 0.21–0.40 fair; 0.41–0.60 moderate; 0.61–0.80 substantial, and 0.81–0.99 as almost perfect agreement. Bland-Altman plots were also used to compare the two methods of LDL-C calculation to direct LDL-C measurement across TG values. The study was approved by the Local Research Ethics Committee.
Results
LDL-C levels at different triglyceride thresholds
We have prepared a variant of the Martin/Hopkins table in mmol/l, in which the modified adjustable factors are included (Table I). The values in Table I represent a simple conversion of the original table from the Martin analysis [21] from mg/dl to mmol/l. Conversion of mg/dl to mmol/l was performed using the multipliers 0.0259 for cholesterol and 0.0113 for triglycerides. The Pearson’s correlation coefficient between MH-LDL-C and F-LDL-C was 0.99 in the entire population. The correlations between MH-LDL-C and Di-LDL-C and between F-LDL-C and Di-LDL-C were 0.98 and 0.96, respectively. According to stratification by TG (< 1.0, 1.0–1.69, 1.7–2.29, 2.3–4.5 mmol/l/ < 88, 88–149, 150–200, 201–400 mg/dl), the correlation coefficients between MH-LDL-C and non-HDL-C were 1.00, 1.00, 1.00 and 0.99.
Table I
Median for the ratio of triglycerides to remnant cholesterol (RC) by non-high-density lipoprotein cholesterol (non-HDL-C) and triglyceride strata (converted in mmol/l to the Martin/Hopkins table) [13]
The concentrations of MH-LDL-C, F-LDL-C and Di-LDL-C obtained in this study at different TG levels when LDL-C < 1.8 mmol/l (< 70 mg/dl) are shown in Table II. For the fasting TG range 2.3–4.5 mmol/l (201–400 mg/dl), if the MH-LDL-C value was below 1.8 mmol/l, there was a difference of 0.5 mmol/l (19.3 mg/dl) between the three average LDL-C levels. F-LDL-C was lower, Di-LDL-C was higher than MH-LDL-C (p < 0.001). In the same TG range, if the F-LDL-C was under 1.8 mmol/l (< 70 mg/dl), there the average levels of MH-LDL-C and Di-LDL-C were higher than 1.8 mmol/l. In the case of TG level exceeding 2.3 mmol/l (> 201 mg/dl) and Di-LDL-C under 1.8 mmol/l, the average F-LDL-C values were 1.0 mmol/l (38.6 mg/dl) lower.
Table II
Mean levels of MH-LDL-C, F-LDL-C and Di-LDL-C if MH-LDL-C, F-LDL-C and Di-LDL-C below 1.8 mmol/l depending on TG ranges
For fasting TG within the ranges 1.7–2.29 (150–200 mg/dl) and 2.3–4.5 mmol/l (201–400 mg/dl), if the F-LDL-C was under 1.8 mmol/l (< 70 mg/dl), MH-LDL-C was under 1.8 mmol/l (< 70 mg/dl) in 68% and 42% of cases (κ 0.81 and 0.53, respectively). When MH-LDL-C was below 1.8 mmol/l, the Di-LDL-C values were 36%, 50%, 58% and 77% between 1.8 and 2.59 mmol/l regarding the TG ranges (κ values were 0.69, 0.65, 0.57 and 0.41 respectively). If the F-LDL-C was under 1.8 mmol/l there were 34%, 56%, 71% and 71% discordance rates for Di-LDL-C in goal achievement (< 1.8 mmol/l) regarding the TG ranges (κ values were 0.73, 0.59, 0.41 and 0.09 respectively).
The concentrations of MH-LDL-C, F-LDL-C and Di-LDL-C at different TG levels when LDL-C < 2.6 mmol/l (< 100 mg/dl) are shown in Table III. There are very similar differences between individual average LDL-C levels. In the case of F-LDL-C under 2.6 mmol/l (< 100 mg/dl), concordance for MH-LDL-C was 73% in the TG range 2.3–4.5 mmol/l (201–400 mg/dl) (κ 0.75). In our investigation regarding the TG ranges, if the MH-LDL-C was < 2.6 mmol/l (< 100 mg/dl), there were Di-LDL-C levels in 14%, 19%, 28% and 42% higher than 2.6 mmol/l (κ values 0.82, 0.82, 0.77 and 0.65 respectively). When F-LDL-C is under 2.6 mmol/l, the discordance for Di-LDL-C is 11%, 22%, 38% and 58% for the TG strata (κ 0.86, 0.79, 0.66 and 0.02 respectively). Overall, the result of the comparison shows that the LDL-C calculated using the Friedewald formula is falsely lower than the LDL-C obtained by the Martin/Hopkins calculation.
Table III
Mean levels of MH-LDL-C, F-LDL-C and Di-LDL-C if MH-LDL-C, F-LDL-C and Di-LDL-C below 2.6 mmol/l depending on TG ranges
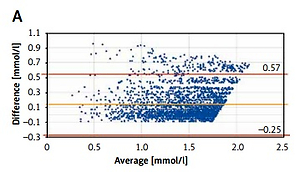
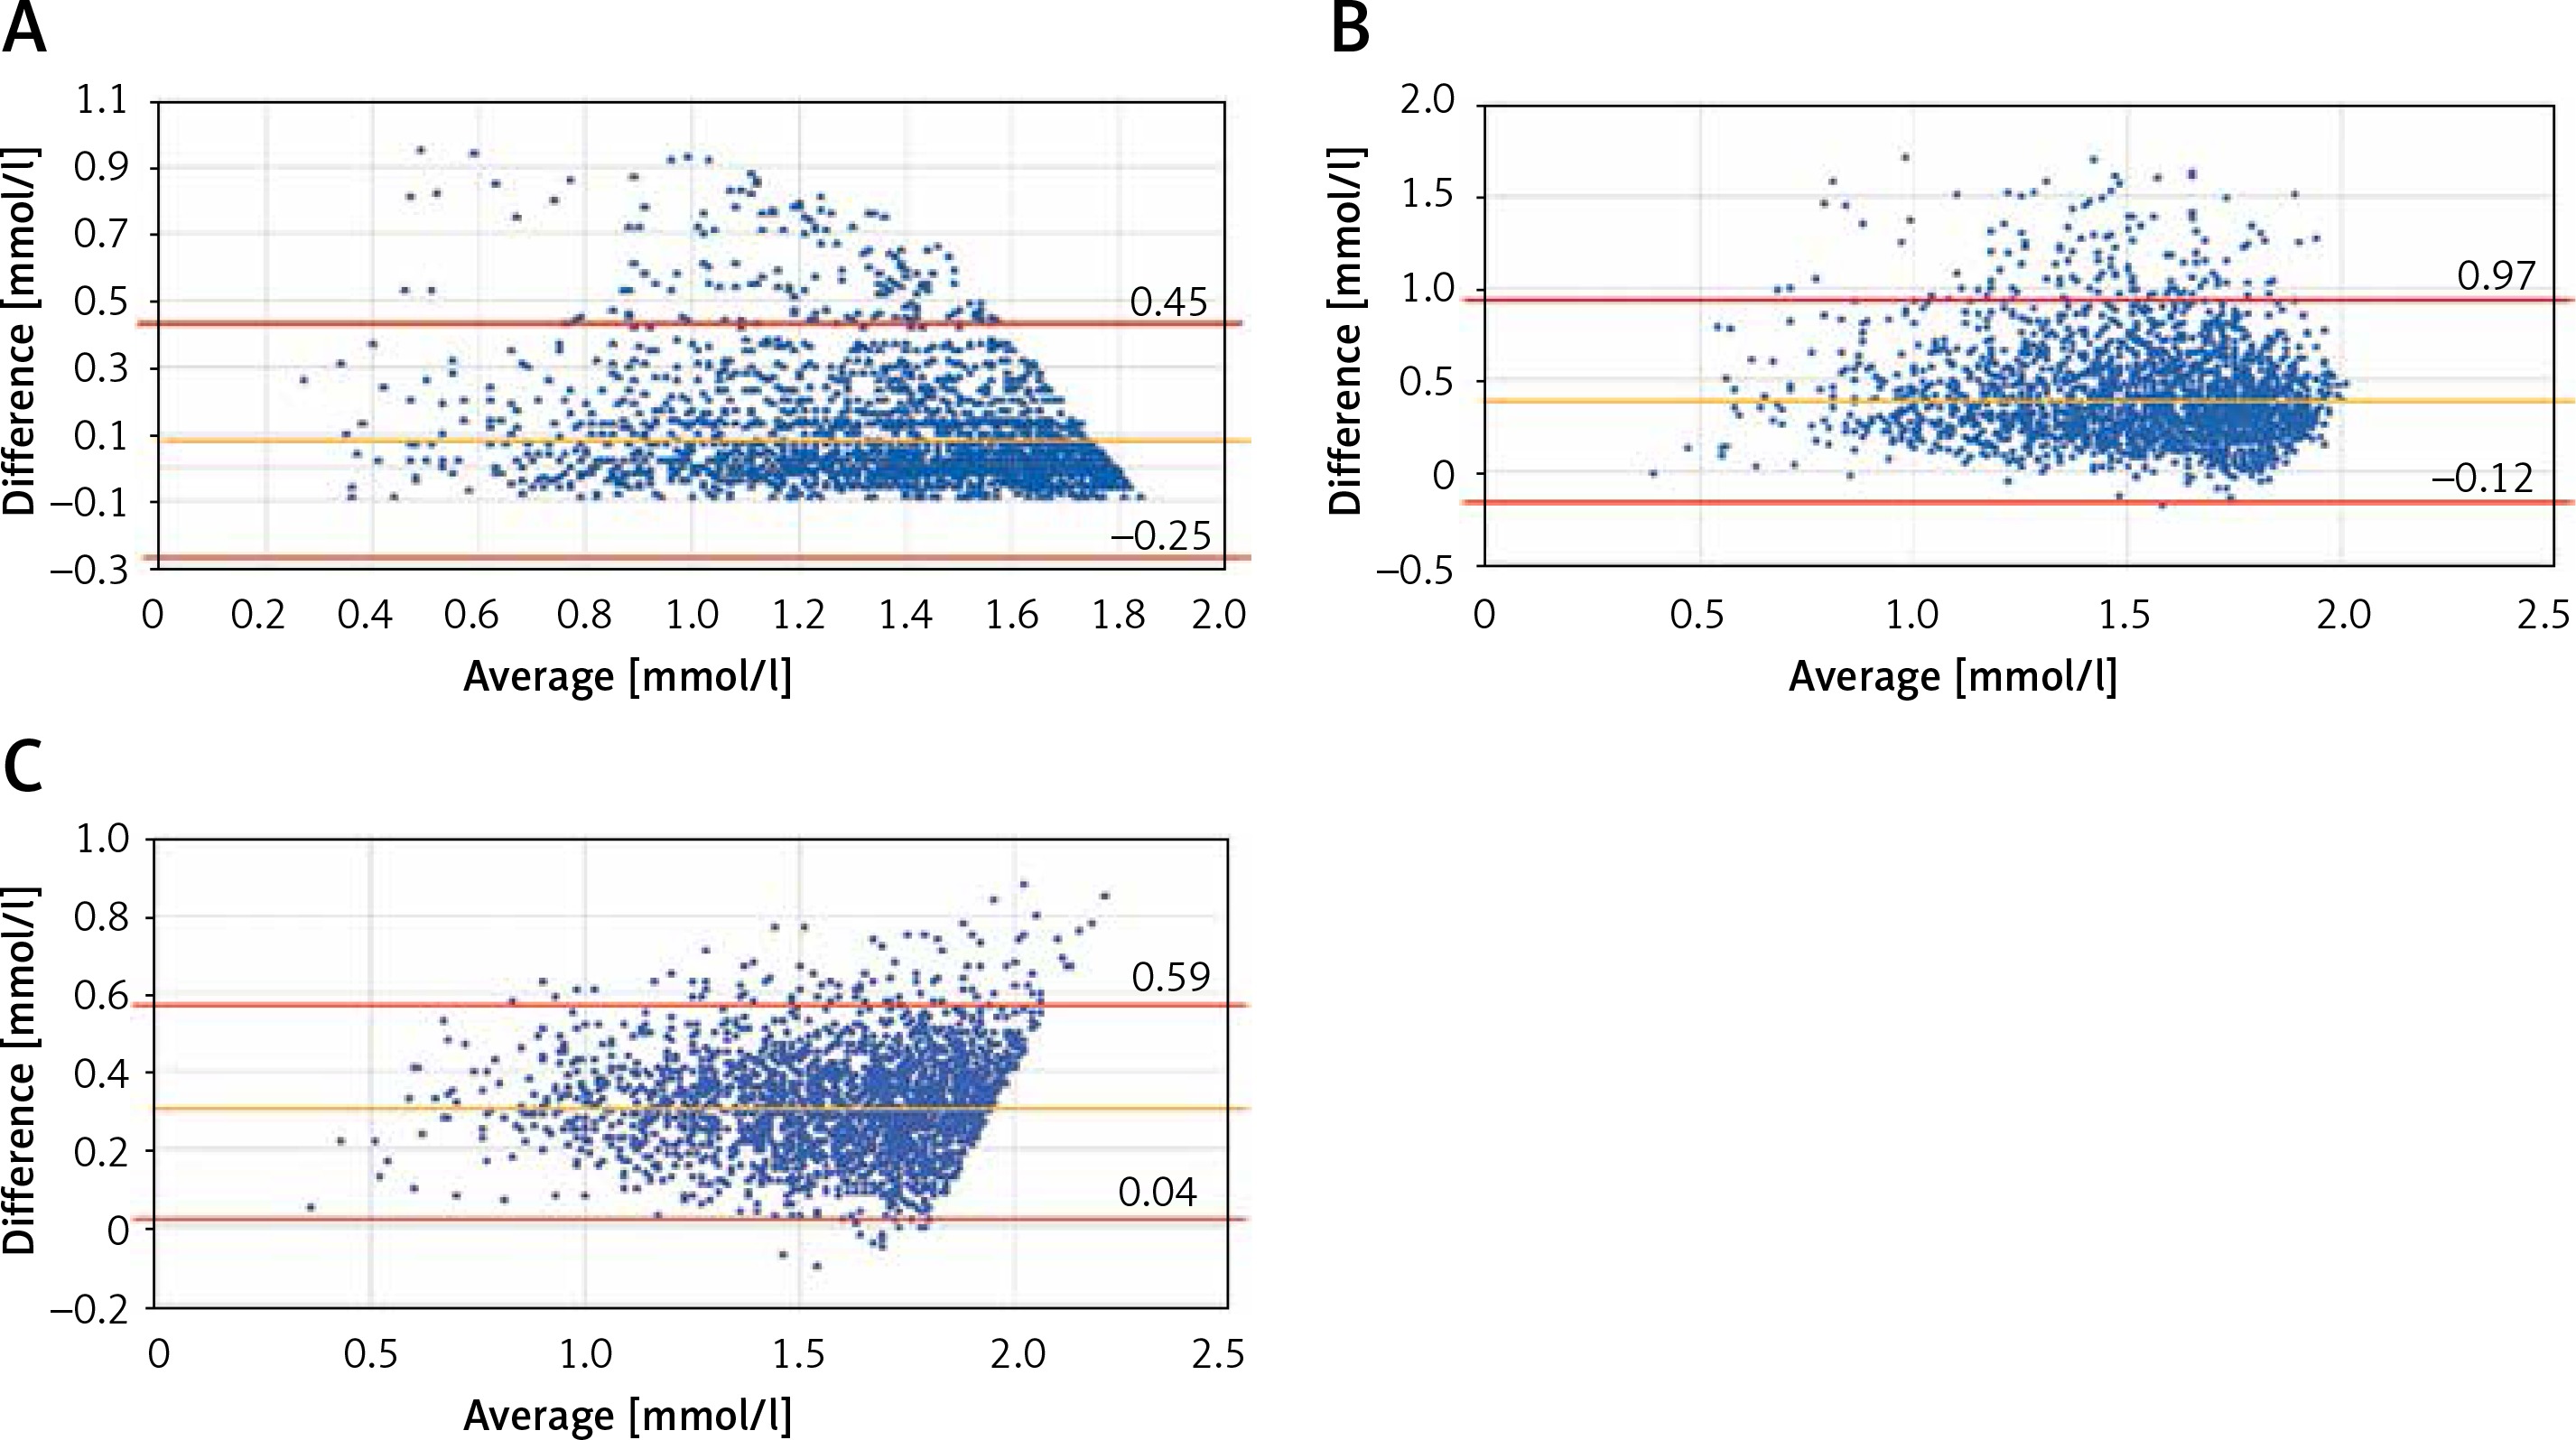
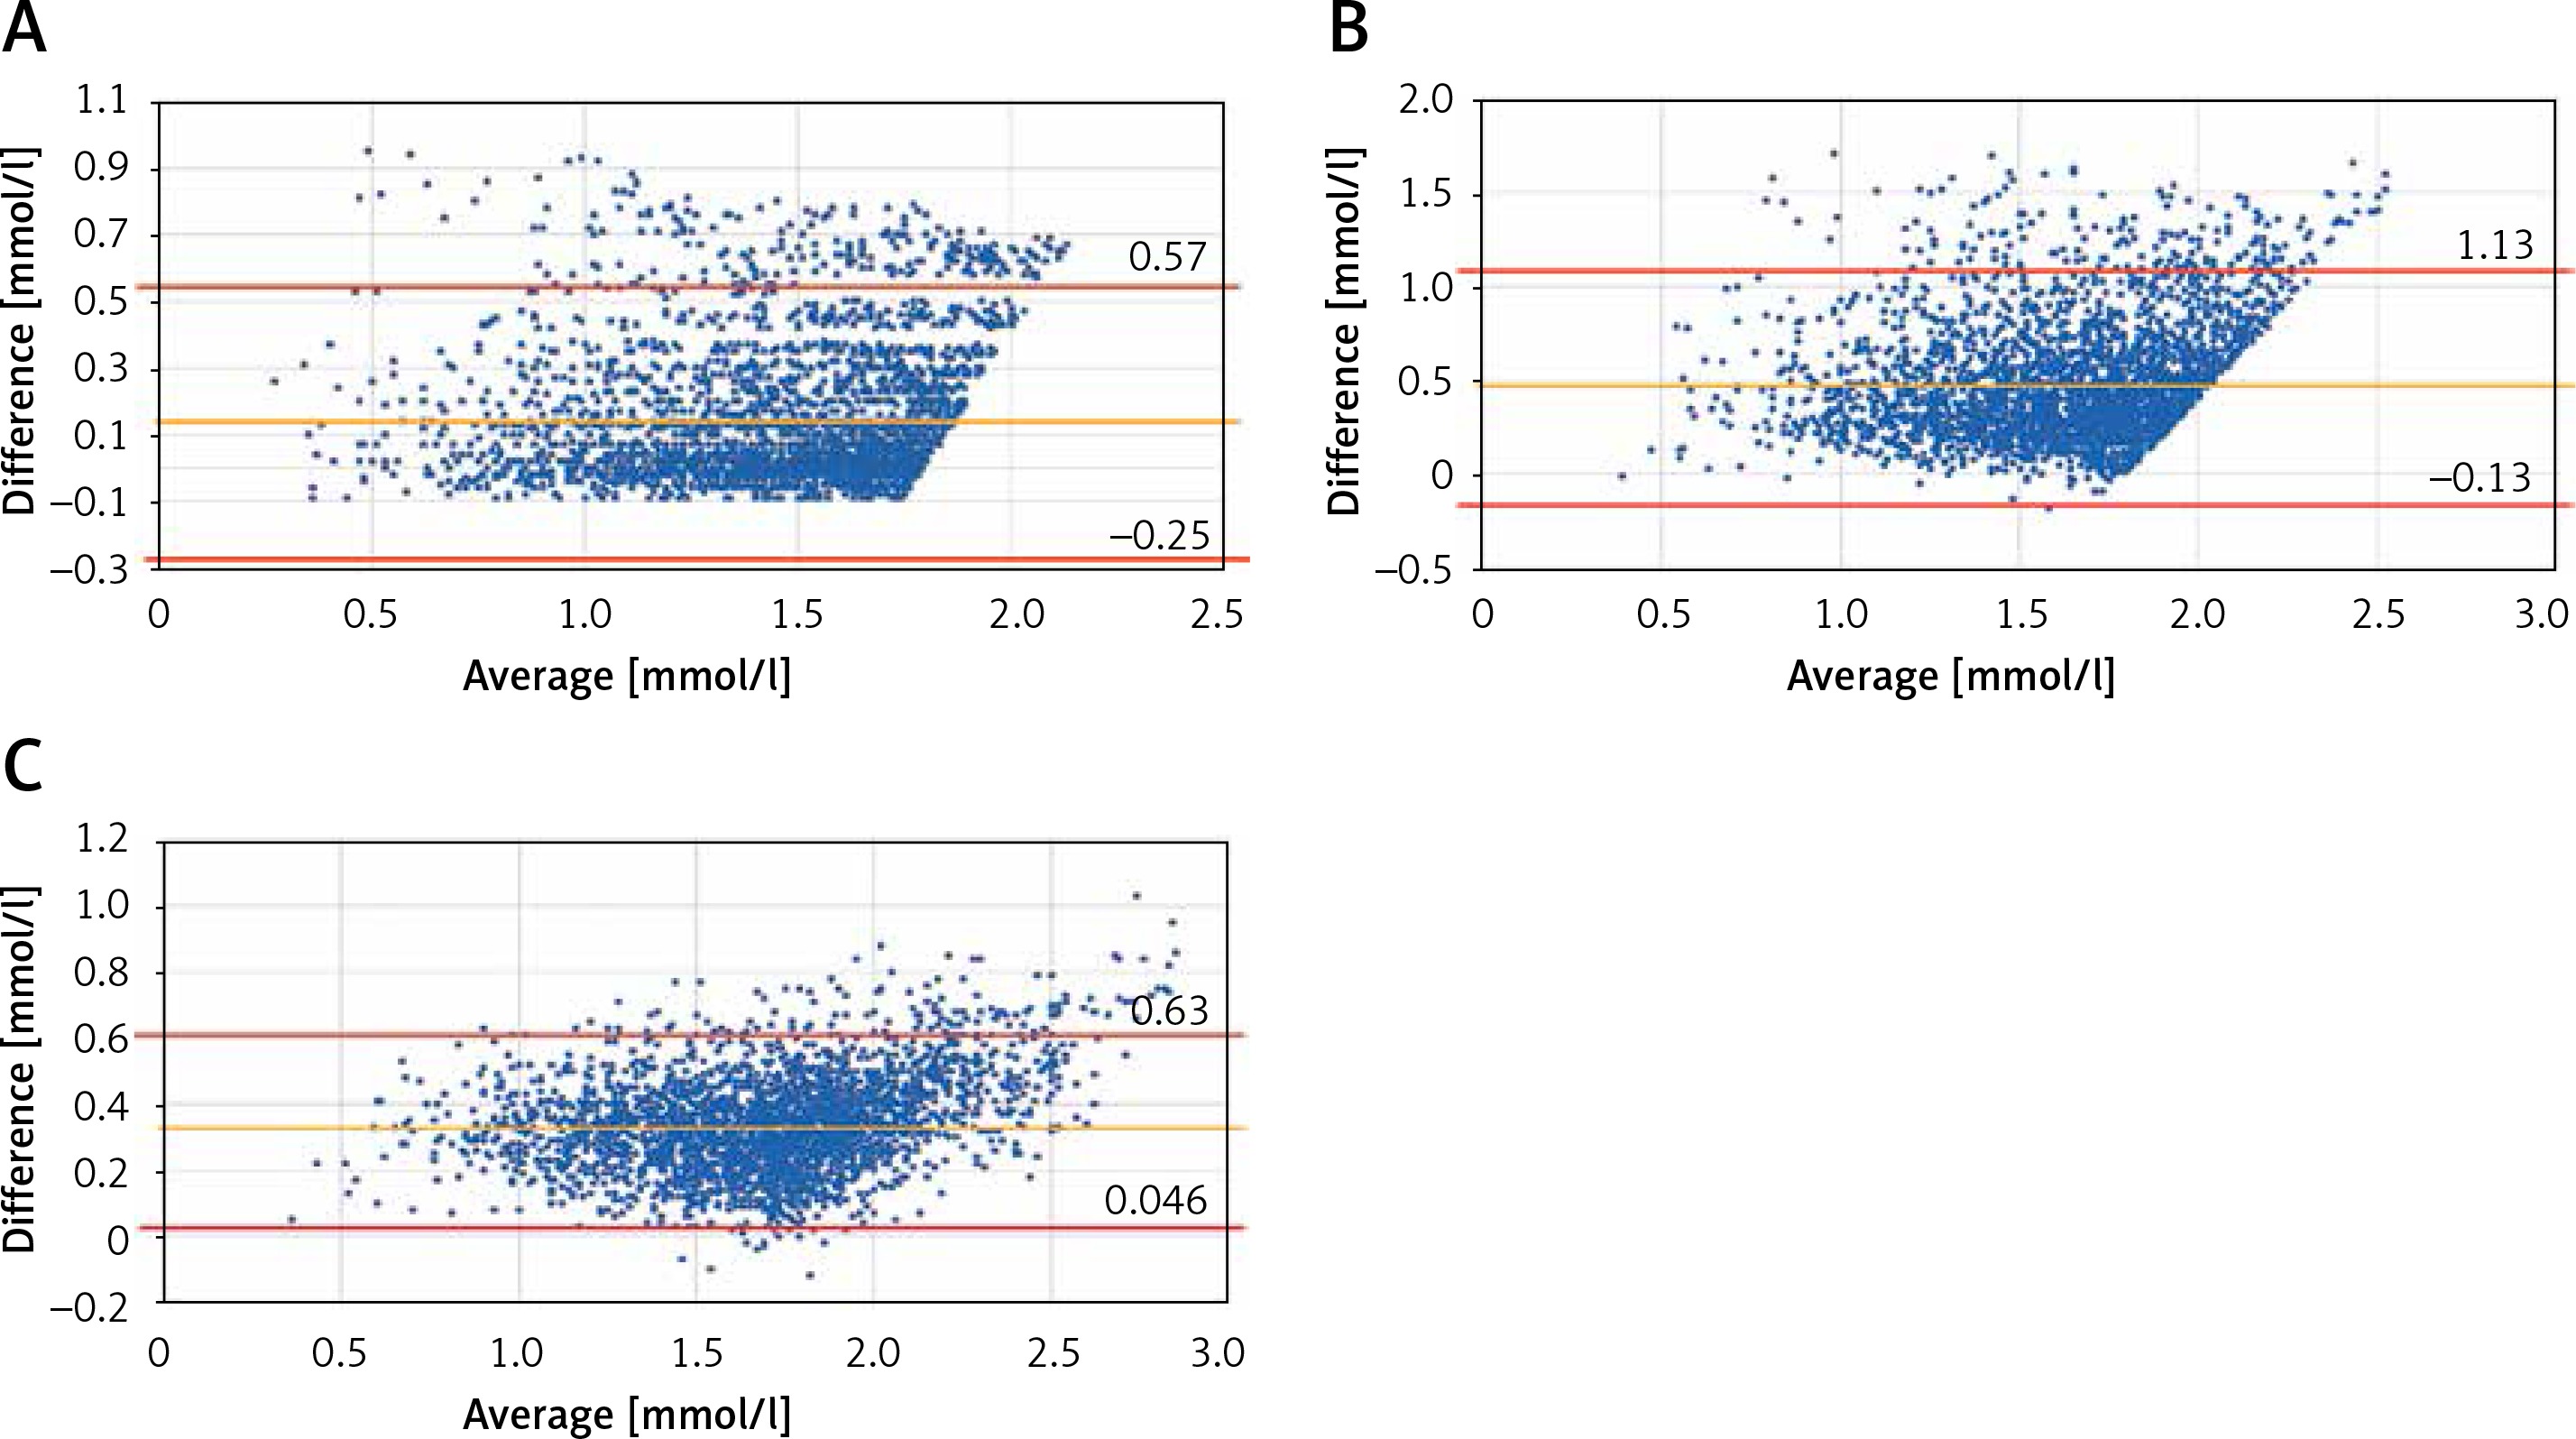
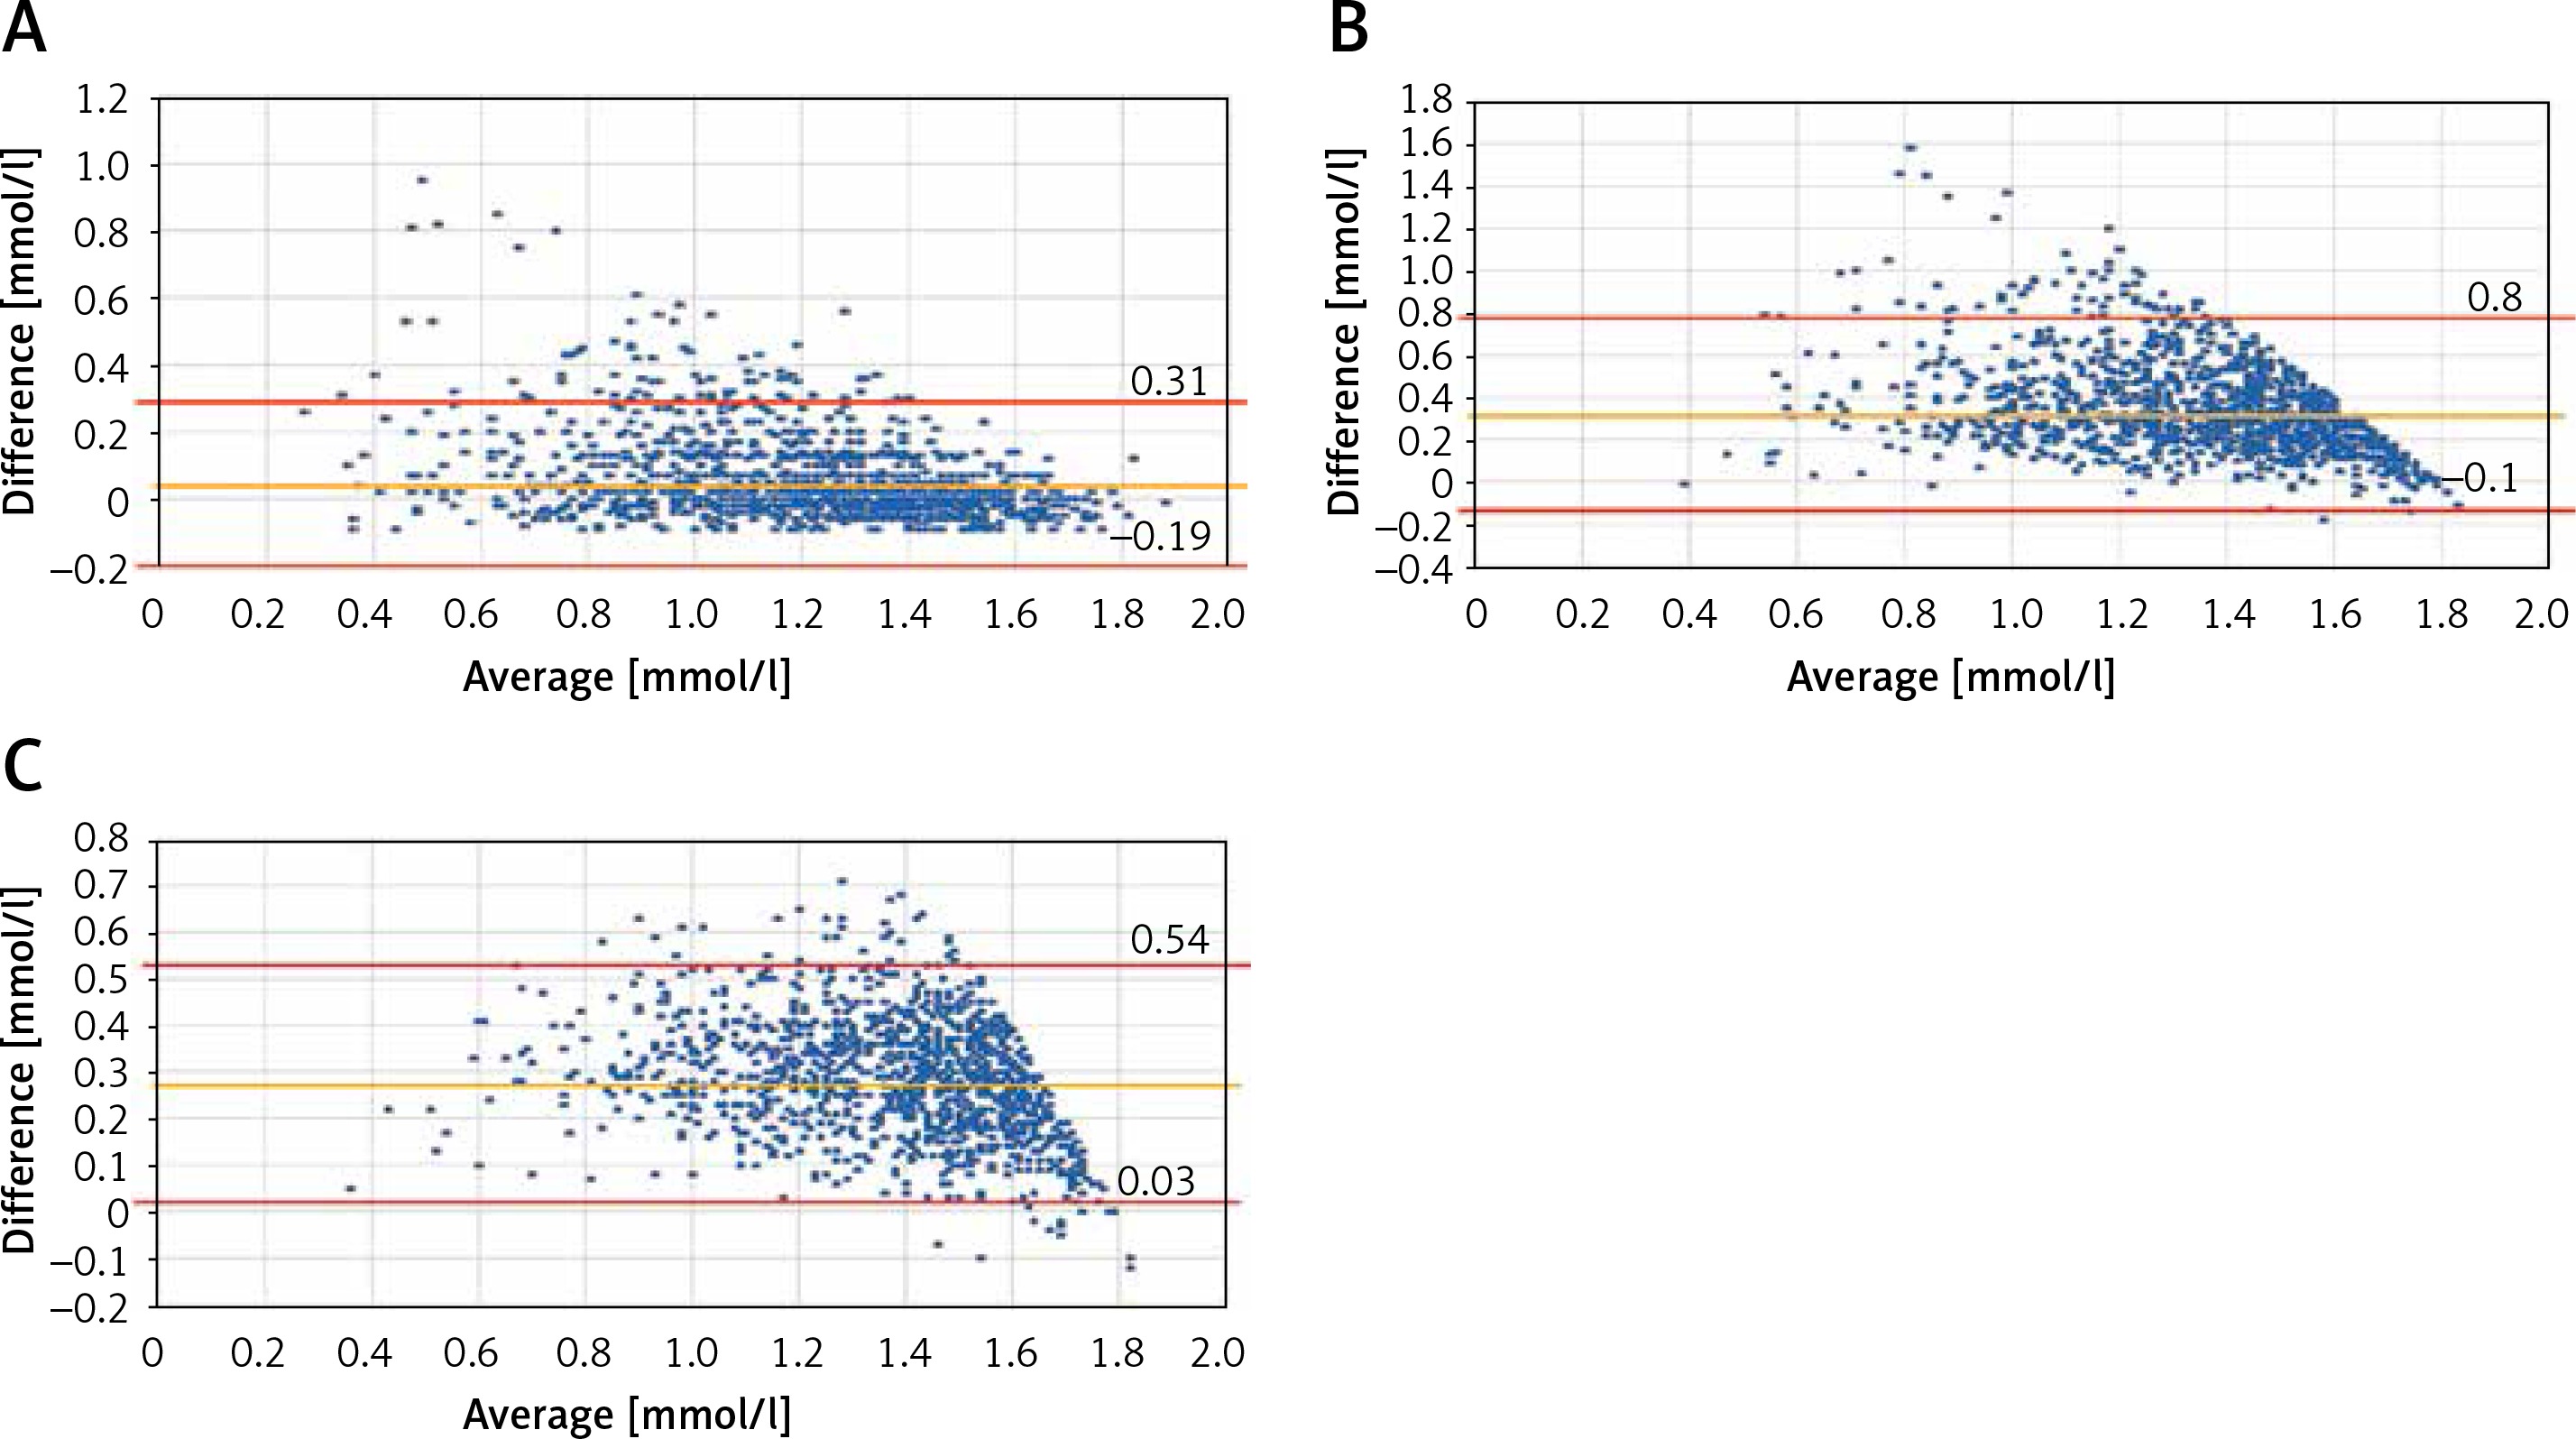
Bland-Altman plots comparing calculated LDL-C using the Friedewald and Martin Hopkins methods to directly measured LDL-C are shown in Figures 1–3. There is good symmetry on either side of the boundary when comparing MH-LDL-C to direct LDL-C; however, there is considerable asymmetry when comparing F-LDL-C to either MH-LDL-C or direct LDL-C.
Figure 1
Bland-Altman plots of MH-LDL-C and F-LDL-C (A), Di-LDL-C and F-LDL-C (B), Di-LDL-C and MH-LDL-C (C) in the cases of MH-LDL-C < 1.8 mmol/l
Remnant cholesterol levels at different thresholds of triglycerides
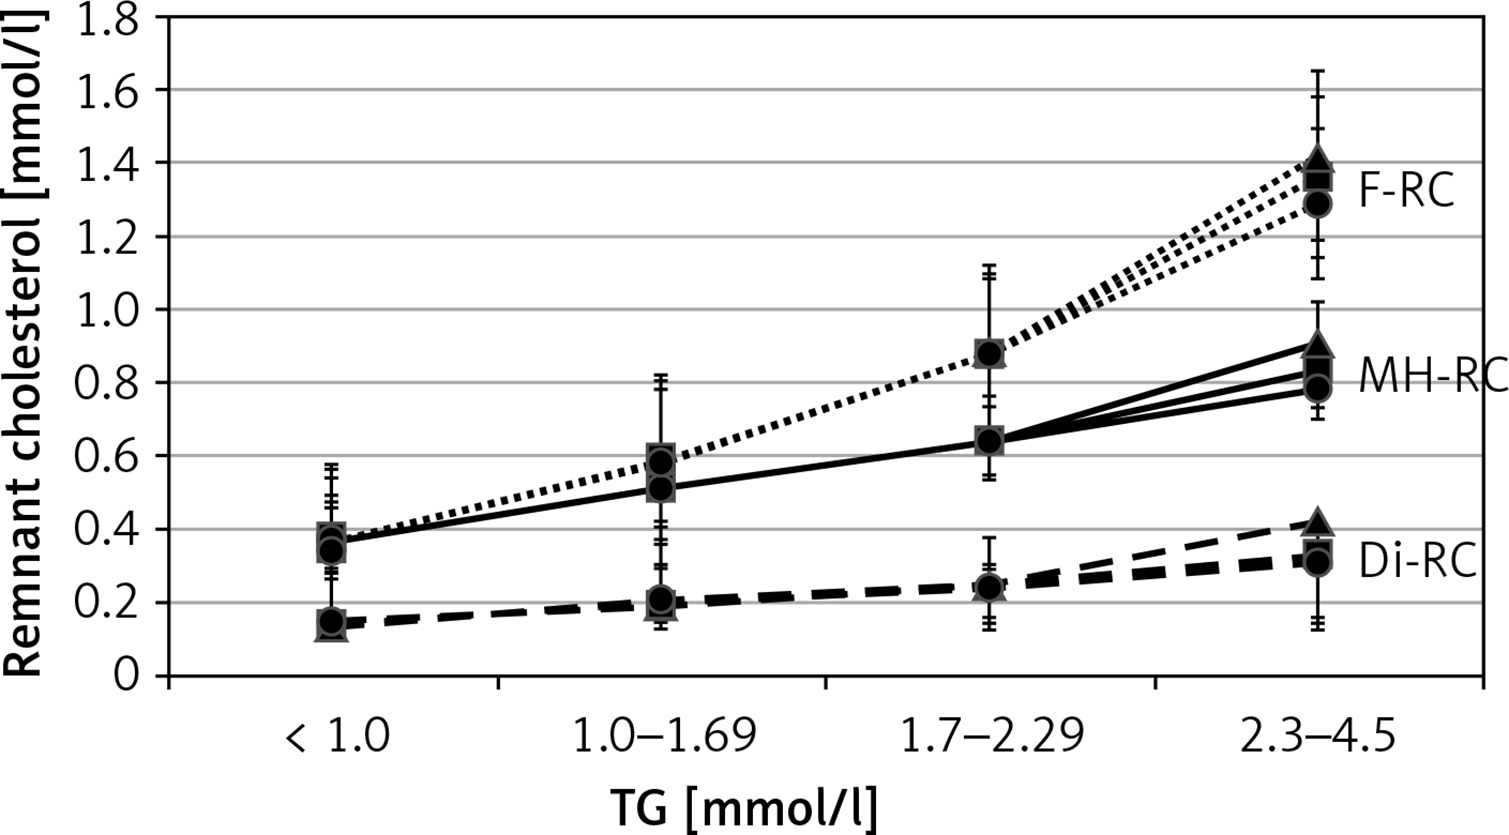
The concentrations of remnant cholesterols (MH-RC, F-RC and Di-RC) as a difference of non-HDL-C and MH-LDL-C or F-LDL-C or Di-LDL-C are shown in Tables IV and V. In the two LDL-C value ranges (< 1.8 (< 70 mg/dl) and < 2.6 mmol/l (< 100 mg/dl)) shown, F-RC levels increase as TG levels increase (0.35–1.36 mmol/l) (31–120 mg/dl). In the case of direct LDL-C determination, RC levels are lower due to higher Di-LDL-C values. It is also apparent that the MH-RC values only reach an average of 0.8 mmol/l in the TG range of 2.3–4.5 mmol/l (the non-HDL-C goals are 0.8 mmol/l above the risk-stratified LDL-C goals irrespective of the TG level) (Figure 4). We prepared a remnant cholesterol (RC) table based on the original Martin/Hopkins estimation (Table VI). It may be a further simplification for colleagues if they do not have to divide TG with a modified factor but derive the LDL-C from the non-HDL-C extracted RC.
Table IV
Mean levels of MH-RC, F-RC and Di-RC if MH-LDL-C, F-LDL-C and Di-LDL-C below 1.8 mmol/l depending on TG ranges
Table V
Mean levels of MH-RC, F-RC and Di-RC if MH-LDL-C, F-LDL-C and Di-LDL-C below 2.6 mmol/l depending on TG ranges
Table VI
Remnant cholesterol (RC) levels determined according to TG and non-HDL-C ranges (colors: < 0.40 green (desirable), 0.41–0.79 yellow (slightly increased), 0.80–0.99 orange (high) and 1.0 < red (very high))
Non-HDL-C levels at different trigylceride thresholds
The concentrations of non-HDL-C obtained in our investigation regarding the different MH-LDL-C and TG ranges are shown in Table VII. It is also evident here that in cases of MH-LDL-C under 1.8 and between 1.8 and 2.59 mmol/l, the difference between non-HDL-C and MH-LDL-C values is below 0.8 mmol/l when the TG level is less than 2.3 mmol/l. The real difference between non-HDL-C and LDL-C is given by the RC value. Table VIII shows the distribution of the MH-RC average values depending on non-HDL-C and TG ranges. This table is a simpler, more practical version of Table VI, based on the Martin/Hopkins calculation.
Table VII
Mean non-HDL-C levels determined according to TG and MHLDL-C ranges
Table VIII
Mean remnant cholesterol (RC) levels determined according to TG and non-HDL-C ranges
Discussion
Accurate LDL-C estimation is crucial to ensure patients are meeting their risk-stratified goals on lipid-lowering therapy [22–25] and for more accurate discrimination among dyslipidemia phenotypes [26]. If not, then significant “hidden” residual risk remains. With the new Martin/Hopkins estimation we now have a reliable LDL-C calculation method that is highly correlated with the direct (real) LDL-C. The determination of LDL-C with the Martin/Hopkins estimation is more precise than the calculation with Friedewald’s formula. The differences between F-LDL-C and MH-LDL-C in our investigation of Hungarian patients are significant, especially when LDL-C is low or when fasting triglycerides exceed 1.7 mmol/l. These observations are consistent with and confirm other analyses [27]. Accurate estimation of LDL-C with the Martin/Hopkins equation also ensures that more patients will meet their risk-stratified non-HDL-C and apoprotein B goals [28]. Hence, we agree with the recommendations of the 2020 Guidelines of the Polish Society of Laboratory Diagnostics (PSLD) and the Polish Lipid Association (PoLA) on laboratory diagnostics of lipid metabolism disorders that the Martin/Hopkins equation should be used routinely in clinical practice to more accurately estimate LDL-C [29]. If the measurement of a direct LDL-C is not feasible, future guidelines for the management of dyslipidemia should strongly endorse use of the Martin/Hopkins equation and discourage use of the Friedewald equation.
In our earlier investigation (MULTI-GAP) we showed that, in the lower TG range, the RC, that is, the difference of non-HDL-C and LDL-C, is lower than 0.8 mmol/l (for TG of under 1.0 mmol/l TG: RC < 1.0/2.2 thus < 0.45 mmol/l), and for TG of over 2.3 mmol/l it is higher (RC > 2.3/2.2 thus > 1.05 mmol/l), if the recommended calculation is performed: RC = TG/2.2 [30, 31]. From our analyses one can see that in high and very high cardiovascular risk scenarios the RC value was 0.8 mmol/l only for TG > 2.3 mmol/l if the Martin/Hopkins estimation is used.
Based on the data presented in our investigation, we believe that a safer and more realistic vasculo-protective atherogenic lipid status can be attained if LDL-C is calculated using the Martin/Hopkins estimation. In Hungarian patients, clearly the Martin/Hopkins equation outperforms the Friedewald equation when compared to directly measured LDL-C. We have provided more accurate tables of LDL-C, non-HDL-C, and RC based on 15,000 patients’ worth of data. These lipoprotein estimates can be directly applied to daily practice and help to ensure that more patients attain risk-stratified LDL-C and non-HDL-C goals. Presently, the Martin/Hopkins method is available as a smartphone application and in multiple digital distribution platforms. Furthermore, it is technically easily feasible to add the MH-LDL-C and RC values to the laboratory lipid report based on the Martin/Hopkins table after determining TC, HDL-C and TG.
In conclusion, the traditional calculation of LDL-C with the Friedewald formula tends to significant underestimate LDL-C levels in very high and high-risk treatment targets, especially when triglycerides exceed 1.7 mmol/l [26]. Our analysis shows that LDL-C estimation using the Martin/Hopkins formula, which is validated by the β-quantification method, yields a more accurate LDL-C value than that calculated by the Friedewald formula. Martin/Hopkins estimation is a simple, available tool for all colleagues to make a succesfull lipid therapeutic strategy more effective. The analyses presented herein provide practical and easy to apply corrections to LDL-C estimations and allow for the estimation of remnant lipoprotein cholesterol, both of which constitute an advance in lipid management for Hungarian physicians and their patients with limited financial resources.
Conflict of interest
I.R.: advisory boards and/or lectures fees from Hungarian branches of Amgen, EGIS, KRKA, MSD, Mylan, Richter Gedeon, Sanofi and Valeant. L.M.: advisory boards and/or lectures fees from Hungarian branches of EGIS, MSD, Pfizer, Richter Gedeon and Sandoz. G.P.: advisory boards and/or lectures fees from Hungarian branches of Amgen, MSD and Sanofi. P.P.T.: speakers bureau: Amarin, Amgen, Novo-Nordisk, Regeneron, Sanofi, and consultant: Amarin, Amgen, AstraZeneca, Kowa, Novo-Nordisk, Regeneron, Resverlogix, Sanofi, Theravance.