Introduction
Hospital malnutrition (HM) is a very prevalent condition in our setting, mainly associated with disease. According to the study population and the applied detection method, its incidence varies between 20% and 60% [1–3]. The state of malnutrition worsens the patients’ clinical prognosis, resulting in a higher morbimortality and poorer functional capacity, which in turn leads to longer hospital stays, more readmissions, and higher health care costs [1–4]. Thus, the implementation of a hospital nutrition screening programme is crucial for early detection of HM [5, 6].
In view of the lack of a gold standard, it is recommended to use the hospital nutrition screening that is most feasible to introduce and at the same time can detect the patients with the worst clinical course [5]. A nutrition screening tool called CIPA (Control of Food Intake, Protein, Anthropometry) was designed, validated, and implemented taking advantage of tools that are commonly used in clinical practice. This screening method gives a positive result if one of the following premises is met: 1) control of food intake for 48–72 h with intake less than 50%, 2) serum albumin < 3 g/dl, 3) body mass index (BMI) < 18.5 kg/m2 or mid-upper arm circumference ≤ 22.5 cm (in patients who cannot be weighed or measured) [7–11].
Nutritional treatment of malnourished patients improves their clinical prognosis and is a cost-effective measure [12–14]. Consequently, implementing nutrition screening should meet that condition, at least when it is simple and cheap, although this fact has not been evaluated adequately so far. To our knowledge, only the Dutch study conducted by Kruizenga et al. [15] has analysed the implementation of the SNAQ screening tool (Short Nutritional Assessment Questionnaire) and concluded that its implementation was cost-effective, mainly in the fragile patient.
Although it seems plausible that introducing hospital nutrition screening is cost-effective, there are virtually no studies that have proved this and that have therefore demonstrated the need for implementing nutrition screening tools at the hospital level. There is a broad literature on the prevalence of malnutrition in different diseases and with different screening systems. However, the cost-effectiveness of even the most widely used nutrition screening tools, such as NRS-2002, Subjective Global Assessment (SGA), MUST, or MNA, has not been evaluated. This is probably due to the ethical and technical difficulties of comparing nutrition screening with clinical practice as well as the shortage of centres with established nutrition screening.
Making use of the progressive implementation of the CIPA screening in a centre, we performed a study that compared the application of the screening tool with standard clinical practice and evaluated its cost-effectiveness, as well as other clinical outcomes [16, 17]. The importance of this work lies in that, to our knowledge, this is the first study to thoroughly evaluate these aspects after implementing a hospital nutrition screening programme. Taking into account the well-documented clinical and economic benefit of nutritional treatment in malnourished patients, we hypothesised that low-cost nutrition screening at hospital admission, such as CIPA, would be a cost-effective measure.
Material and methods
Ethical approval
The hospital Scientific and Ethics Committees approved the study protocol on January 27, 2015 (PI14/01226-CI-10/15). The study was performed in accordance with Good Clinical Practice standards, applicable local regulatory requirements, and the recommendations of the Declaration of Helsinki. Informed consent to participate in the study was obtained from the patients.
Trial design
This study was a controlled trial with two arms: an intervention arm, where patients were screened for malnutrition using the CIPA tool at hospital admission, and a control arm where patients were not screened but were diagnosed according to standard clinical practice (Clinical Trial.gov NCT02721706). The complete protocol and study design were described by Suárez-Llanos et al. [17]. Although a random assignment was planned initially, based on a priori arbitrary bed assignment, this was hampered due to practical problems that are discussed below.
Subjects
A pre-selection of the study subjects was carried out consecutively, based on the admission of potentially eligible candidates. Patients admitted to the Internal Medicine or the General and Digestive Surgery ward, aged 18 and over, who had signed the informed consent statement, were included. At the hospital, both specialties are divided into two wings. At the time of the study, due to the progressive introduction of the nutrition screening, one of the two wings of either ward conducted the CIPA screening at hospital admission (intervention group), while the other did not (control group, where standard practice was performed). Patients were assigned to either the control or the intervention group, according to the wing they were admitted to. Patients meeting one of the following criteria were excluded from the study: treatment with nutritional support either before CIPA screening or during the equivalent time in the control ward, patients transferred from other wards, patients with an expected length of stay of less than 72 h, CIPA screening unfeasible for any reason, patients with a poor short-term prognosis, patients participating in another research study, and pregnant patients [17].
As detailed at the protocol study [17], sample size calculation was made according to Kruizenga et al. [15], considering a two-tailed power of 90%, an α of 0.05, and 10% of potential losses. Eight thousand twenty-three patients were included in the study, 412 in the control ward (standard clinical hospital care) and 411 in the intervention (CIPA) ward. Patients were included from May 2015 on; data collection ended in October 2017.
Interventions
The patients from the intervention group were subjected to a CIPA nutrition screening. When this gave a positive result, the responsible doctor was in charge of evaluating the convenience of a nutritional treatment. A dietitian adjusted the diet and followed up the patient’s evolution if necessary (Figure 1).
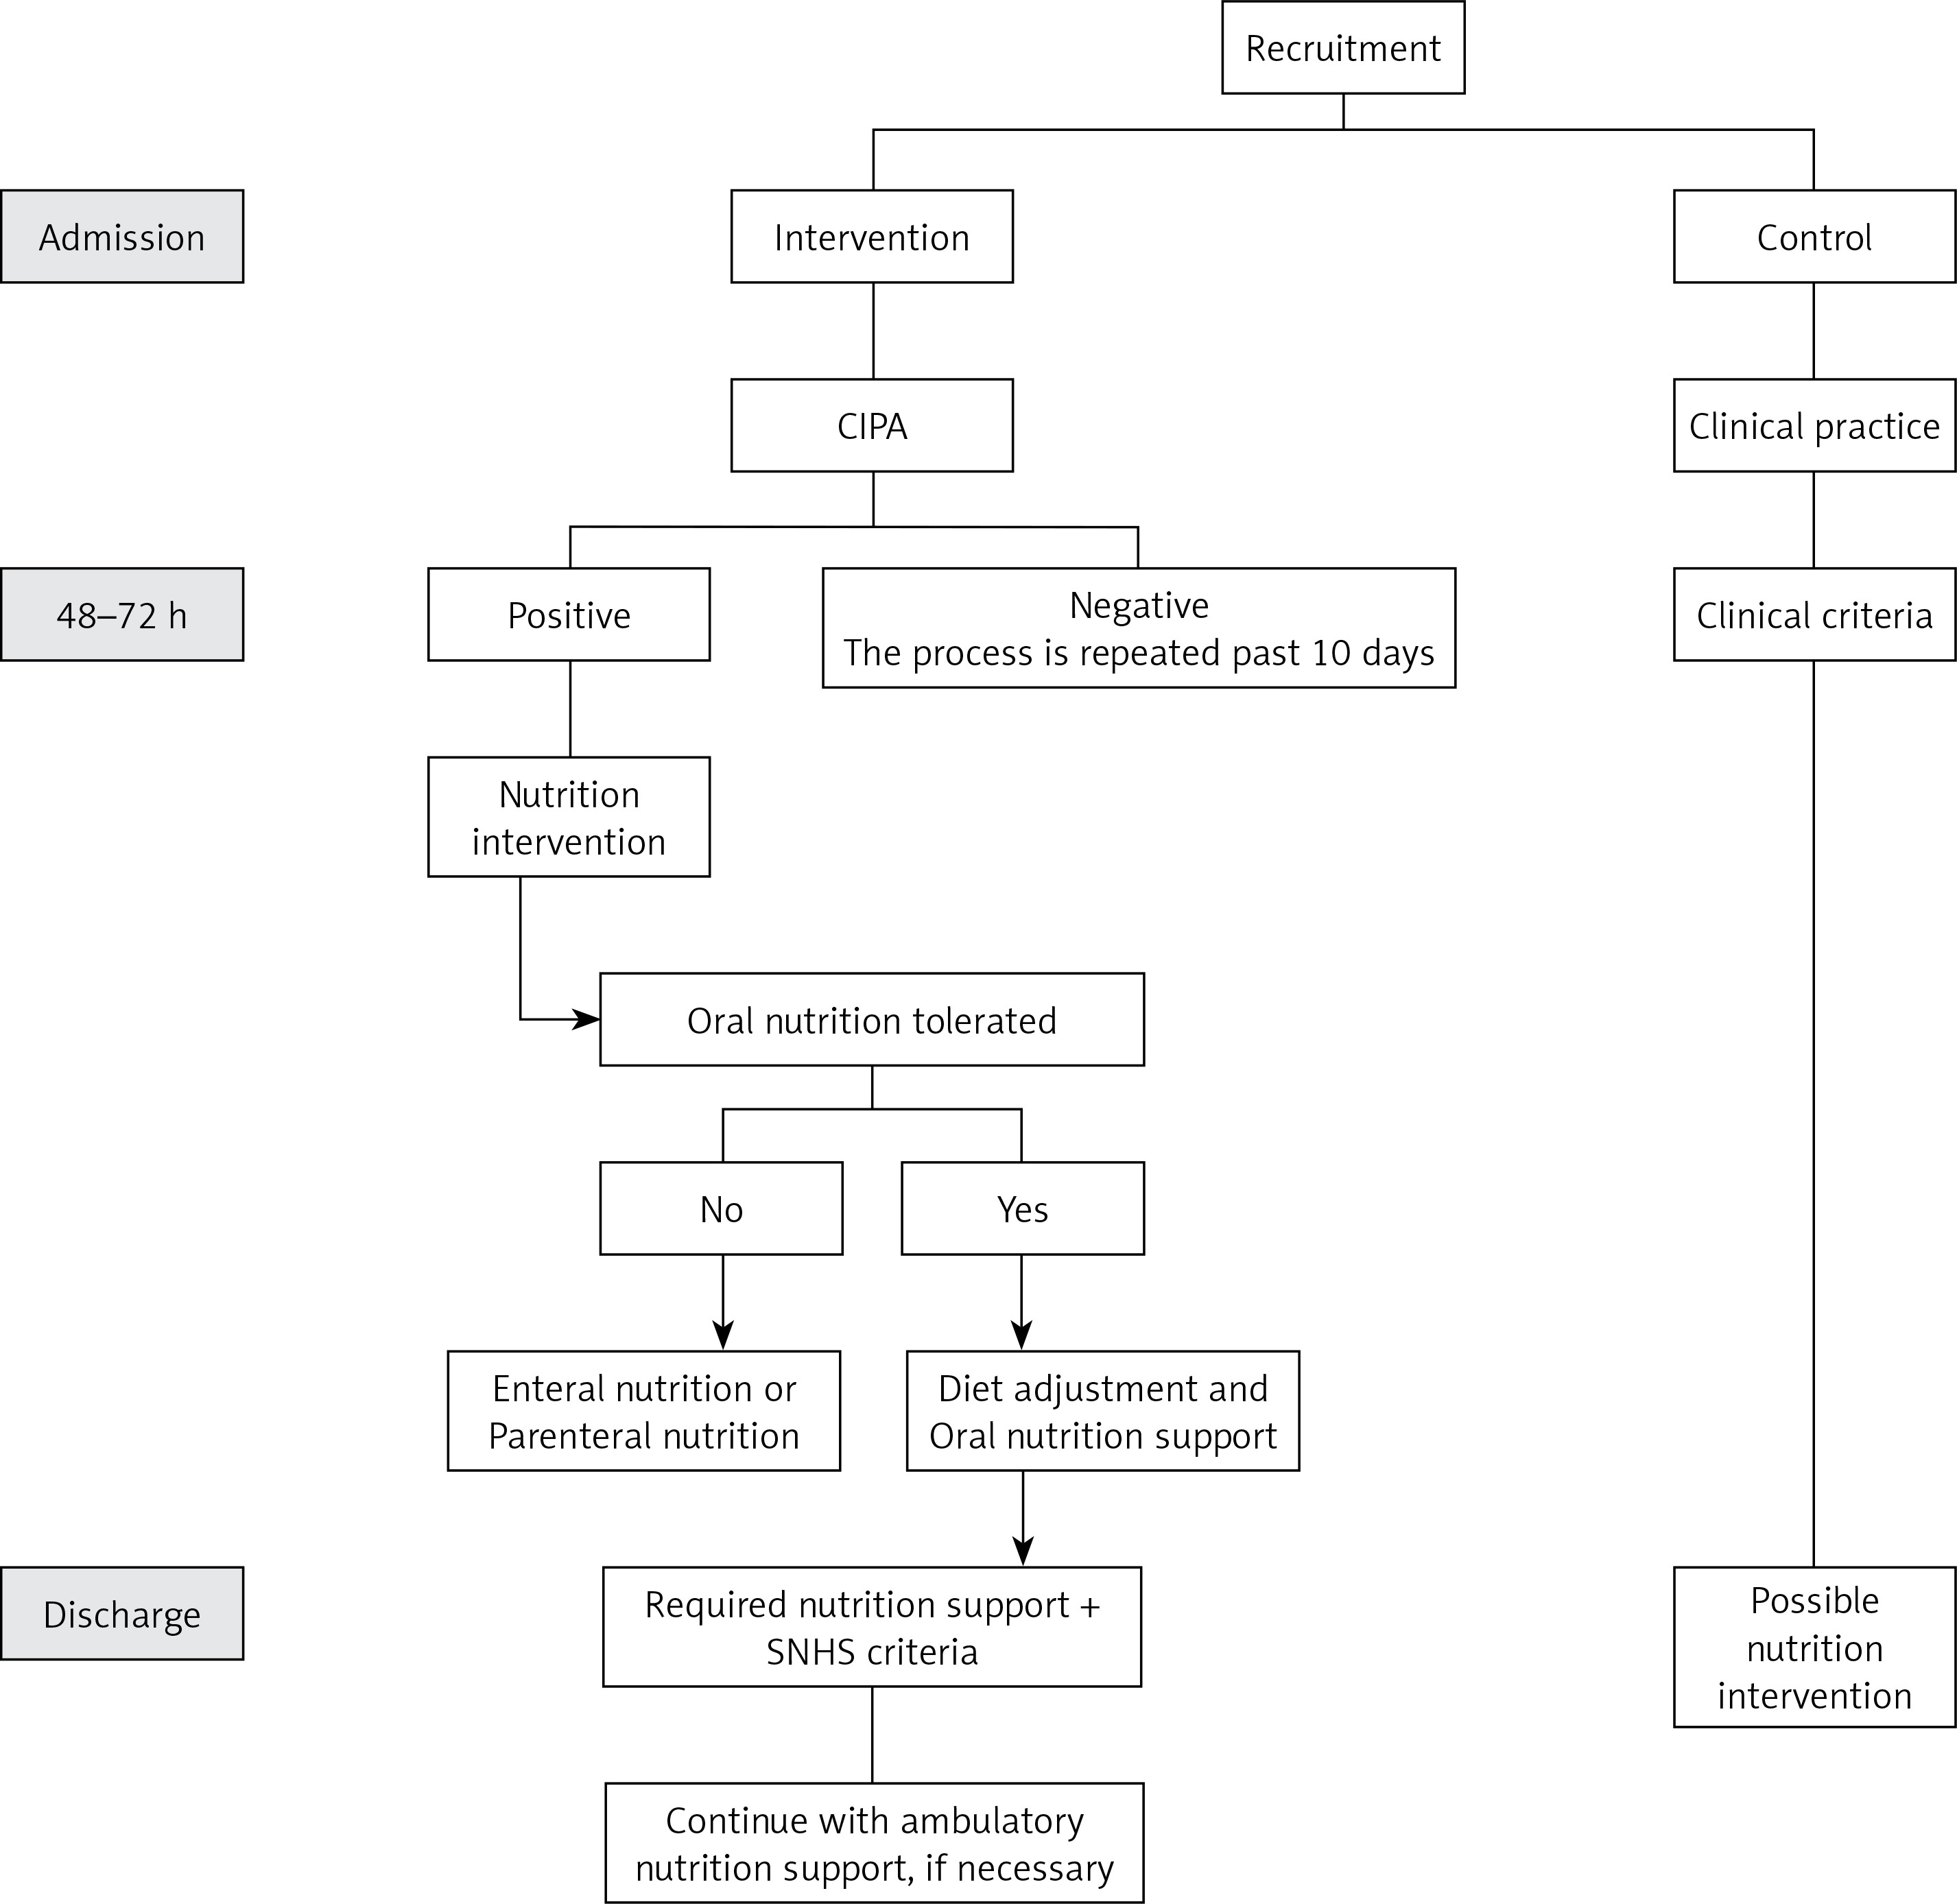
No nutrition screening was performed in the control group. Thus, the responsible doctor requested the nutrition parameters and prescribed specific nutritional treatment when considered appropriate.
At hospital discharge, patients who had received nutritional support continued with this treatment as outpatients for at least three months on the basis of the responsible doctor’s decision and when financed by the Spanish National Health System (SNHS).
Outcome measurements
Primary outcome measurements
The primary goal of this study was to evaluate the cost-effectiveness of the implemented CIPA nutrition screening tool by comparing health effects and health care costs in screened vs. non-screened inpatients in terms of cost per Quality-Adjusted Life Year (QALY).
Secondary outcome measurements
The impact on the following clinical aspects when implementing CIPA screening was analysed: mean stay; rate of readmission in the first 3 months; mortality (in hospital and in the first 3 months after discharge); incidence of clinical in-hospital complications (evaluated according to the CHADx classification system [18]); transfers to critical care units; doctor visits in hospital and after discharge (practitioners as well as specialists).
Statistical methods
Statistical analysis
As described in the study protocol [17], the economic evaluation and study of the individual variables were carried out in accordance with the intention-to-treat principle. An exploratory and descriptive analysis of all the aforementioned variables was carried out, and the main variables (duration of hospital stay, complications, readmissions, mortality, and quality of life of the patients) were analysed according to age, sex, Charlson index, EQ-5D-5L score, and to the corresponding admitting ward. A Spearman correlation matrix was undertaken and it is presented in Table I. For hospital stay, a generalised linear model (GLM) was used with a logit link function. Readmission and mortality were evaluated with a 3-month follow-up using Cox regression. Multiple linear regression was performed to analyse quality of life.
Table I
Matrix of correlation of continuous variables
| Variable | Age | Charlson index | EQ-5D at admission | Length of stay | EQ-5D at discharge | EQ-5D at 3 months |
|---|---|---|---|---|---|---|
| Age | 1 | |||||
| Charlson index | 0.6776* | 1 | ||||
| EQ-5D at admission | –0.1740* | –0.1587* | 1 | |||
| Length of stay | –0.0129 | 0.0874* | –0.2120* | 1 | ||
| EQ-5D at discharge | –0.2776* | –0.2510* | 0.7547* | –0.1700* | 1 | |
| EQ-5D at 3 months | –0.3535* | –0.3324* | 0.4725* | –0.1353* | 0.7007* | 1 |
Regarding descriptive data analysis, qualitative variables are represented as frequencies and percentages and continuous variables as mean ± standard deviation or the median in case of notable deviation from normal. Bivariate analyses were performed by means of Student’s t test or the non-parametric Mann-Whitney U test, when the quantitative variable was significantly different from normal, or the χ2 test for nominal variables. Normal distribution of variables was checked by visual inspection and applying the Kolmogorov-Smirnov test. A 5% significance level was considered strongly significant and a 10% was considered weakly significant. The STATA v15 program was used.
Cost-effectiveness analysis
We compared the cost and health outcomes of patients undergoing malnutrition screening versus patients treated under standard practice. Our analysis conformed to accepted economic evaluation methods.
The analysis was undertaken from the National Health Service perspective and had a time horizon of three months after discharge; i.e., only direct medical costs incurred by the health care service during hospitalization and within three months after discharge were covered. The included cost items were: the costs of implementing the screening tool; the cost of dietitian visits and nutritional treatment; the cost related to length of stay in the hospital ward and in critical care units; the cost of general practitioner (GP) visits, specialist visits, and readmission within three months after discharge. Unit costs were attached to each component of health care utilisation collected in this trial using data provided by the hospital as well as drawing on national and regional-specific sources. Cost per day in hospital was assigned according to the patient’s diagnosis-related group (DRG). Therefore, complication costs were not additionally included to avoid double-counting. Costs were expressed in Euros (2017).
QALYs were calculated based on the EQ-5D-5L and mortality data collected during the trial. Patient-specific utility profiles were created assuming a straight-line relation between all patients’ EQ-5D-5L scores from either follow-up point. EQ-5D-5L scores were taken from Ramos-Goñi et al. [19]. The QALYs experienced by each patient 3 months from the date of discharge were calculated as the area underneath this profile.
Having explored differences in baseline features, we decided to use regression methods to control for a series of patient characteristics in order to assess differences in costs and QALYs between the study groups. These criteria were: age, sex, EQ-5D score at admission, Charlson index, and in the combined sample whether the patient was admitted to the internal medicine or to the surgical ward. Cost-effectiveness was summarised as the incremental cost-effectiveness ratio (ICER) by dividing the estimated difference in costs by the difference in QALYs. Analyses were undertaken on the combined sample and for patients admitted to the internal medicine ward as well as the surgical ward, separately. Nonparametric methods to calculate confidence intervals around the ICER based on 1000 bootstrapped estimates of the mean cost and QALY differences were used.
Results
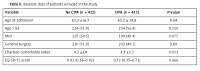
Table II shows the baseline data of the patients included in the study. The CIPA group had a higher Charlson index at admission. However, analysing its components separately, there were only differences between groups of patients with connective tissue diseases, where the index almost doubled in the CIPA group (15 (3.6%) vs. 29 (7.1%), p = 0.029). There was a larger number of emergency admissions in the control group (p = 0.021). For the remaining parameters no significant differences between the groups were detected, although there was a higher proportion of men in the control group.
Table II
Baseline data of patients included in the study
The CIPA nutrition screening was positive in 19.2% (79 patients) of the subjects, 72 of whom received nutritional treatment (91.1%). Out of the 331 patients with a negative CIPA outcome, 30 received nutritional treatment. In the control group, a total of 44 patients received nutritional treatment (11 in internal medicine and 33 in the surgery ward). The number of patients with nutritional treatment was higher in the CIPA group, with an odds ratio in the multivariate model of 2.67 (1.80–3.98; p < 0.001).
As to the clinical parameters, the mean hospital stay was higher in the CIPA group by 0.95 days (–0.6–2.5), although this result is not statistically significant (p = 0.230). The relation between mean stay and the admission service was close to statistically significant (p = 0.058). Thus, when analysed separately, the adjusted mean stay in the CIPA group of the internal medicine patients was 2.74 days higher than in the control group (–0.4–5.9; p = 0.086), while in the surgery ward the mean stay in the CIPA group was 0.85 days lower (–3.0–1.3; p = 0.440).
There were no differences between the two groups in mortality, either in hospital or in the 90 days after discharge (p = 0.41). Eight patients from each group died in the course of admission. The risk of readmission did not differ either (adjusted mean in the CIPA group: 0.37, control group: 0.36, p = 0.825). The risk of a transfer to a critical care unit was lower in the CIPA group in the surgery ward (p = 0.014). There were no significant differences in the number of complications related to the respective group (CIPA group: 0.26 (0.19–0.33), control group: 0.33 (0.19–0.42), p = 0.218). With respect to doctor visits in hospital as well as after discharge (practitioners and specialists), no differences between the two groups were observed either.
A slight increase in quality of life was observed in the CIPA group 3 months after discharge (CIPA group: 0.87 (0.85–0.89), control group: 0.84 (0.82–0.86); p = 0.089). This difference was only significant at the 10% significance level on the surgery ward (CIPA group: 0.93 (0.91–0.95), control group: 0.90 (0.88–0.92), p = 0.065), but not on the internal medicine ward (CIPA group: 0.81 (0.77–0.84), control group: 0.79 (0.75–0.83), p = 0.56).
Cost-effectiveness
We computed the mean total cost and mean QALY per patient in the intervention and the control groups. Information on EQ-5D at discharge and 3 months after discharge was not available for 1 patient, who was therefore excluded from the analysis.
Raw estimates of mean patient costs (by cost item) and mean QALY data are shown in Table III. The estimates are presented by intervention group, for the combined sample, and for patients in the internal medicine and the surgical ward, separately. Sources of information for unit costs were as follows: staff time costs were taken from the National Institute of Statistics [20] and based on the hourly salary of health care professionals; oral and enteral nutritional treatment costs were provided by the hospital; parenteral nutrition costs per day were obtained from Berlana et al. [21]; cost per day by DRG on a general ward was based on data published by the Spanish Ministry of Health [22]; and cost per day at a critical care unit and the cost per GP visit and specialist visit were taken from the local tariffs, as published by the Canary Islands Government [23]. Costs of readmissions during the 3-month follow-up period were calculated by applying the mean cost per stay across the full sample, because length of stay per readmission was not recorded.
Table III
Raw estimates of mean cost and mean QALY values
As shown in Table IV, the mean cost per QALY, estimated in the combined sample, was € 166 453 [24]. This overall result is made up of two different outcomes from the internal medicine and the surgical ward subsamples. While the incremental cost for the internal medicine patients exceeded € 600 000 per QALY, the result in surgical patients suggests that the screening tool is both less costly and more effective in this group.
Table IV
Incremental cost-effectiveness analyses
Discussion
Staff and health managers have historically underestimated patients’ nutrition status as well as the difficulties in implementing nutrition screening in hospital centres with many beds, which has led to a common lack of such instruments [25]. Fortunately, with the increase in scientific evidence, there is a trend to implement in-hospital nutrition screening, although additional cost-effectiveness studies are required to further corroborate at the administrative level the need for it.
So far, clinical benefits and cost-effectiveness of providing nutritional treatment to malnourished patients have been demonstrated at the hospital level [12–14], but only the work of Kruizenga et al. [15] has analysed the cost-effectiveness of implementing nutrition screening in this setting. The team conducted a non-concurrent case-control study and took visits to dietitians, nutritional treatment, and the mean stay into account for cost calculation. They performed SNAQ screening and found the tool to be cost-effective, mainly in frail patients, through a decrease in the mean stay in the intervention group.
To our knowledge, the work we present here is the first in the literature to evaluate the cost-effectiveness of implementing a hospital nutrition screening tool that also estimates the costs per QALY. To this end, a number of influencing variables were taken into account, such as the cost of performing the screening, the cost of nutritional treatment, dietitian visits, transfers to a critical care unit, the mean stay adjusted for DRG and readmissions, as well as visits to a general practitioner or specialist in the 3 months after discharge.
The study design was prospective and simultaneous between a control group and an intervention through CIPA screening group, based on the ongoing implementation of the screening tool during that period of time in the hospital centre [17]. We think it is important to evaluate the patient’s progress after hospital discharge, in addition to the great cost involved in a readmission or outpatient visits to doctors, as this reflects the state in which patients leave the hospital, whether they have recovered, are convalescent, or still ill. Moreover, nutritional treatment of malnourished patients at hospital discharge and further on in outpatient conditions, has been shown to be also cost-effective [26].
With respect to the clinical parameters, paradoxically we found an increase in the mean stay in the internal medicine ward, which shifted the whole sample to a non-significant increase. In this group, only 16.3% of the patients were CIPA positive, so that nutritional treatment in these patients had only a small influence on the obtained data. Therefore, little was to be improved in the clinical results of this patient group.
A further limitation of our work was the lack of adequate randomisation of patients across groups, as some patients were assigned to specific beds for reasons of clinical practice, either because wings had different patient profiles or because the responsible doctor for that patient worked on one of the specific wings. We evaluated whether possible clinical practice variables could have biased our results. To this end, we analysed patients’ mean stay according to the responsible doctors for each group during the 6 months prior to initiating the study. On the internal medicine ward, different doctors were responsible either for the control or the CIPA patients, while on the surgery wards the same doctors supervised both control and CIPA patients. In this post-hoc study, we observed that doctors on the internal medicine ward who were later assigned to CIPA patients discharged their patients later than those assigned to the control patients (n = 200 and 141, respectively: 11.3 ±2.2 days vs. 9.6 ±2.0; p < 0.001). Consequently, this issue could have biased the study outcomes in the subgroup of internal medicine patients, and hampered the randomisation according to bed assignment, especially in the internal medicine subsample.
A decrease in the mean stay, though not significant, was observed in the General and Digestive Surgery Service, which together with other variables, such as a lower number of patients transferred to critical care units and the best perception of quality of life in the 3 months after discharge, made the economic savings in the CIPA group even bigger. In addition, a non-negligible proportion of the patients in the control group received nutritional support despite not being screened (15.7%), due to the increased awareness of the nutritional aspect among doctors in this hospitalization ward, which translated into regular prescription of oral nutritional supplements in the peri-surgical period. This fact may have diminished differences between the groups due to the well-known better clinical course of adequately treated, malnourished patients [12–14].
There were no differences between groups with regard to other clinical parameters, either in complications or in death or readmission rates in the 3 months after discharge, although there was a large, though barely significant number of patients transferred to critical care units in the control group, which increased these patients’ costs.
Our findings indicate that there is a high degree of uncertainty regarding the cost-effectiveness of the CIPA screening tool. The tool seems to save health care resources and simultaneously improve individuals’ health when applied to patients on the surgical ward. Nonetheless, it did not yield a cost-effective outcome in the internal medicine subsample.
We had observed positive outcomes in 23–38% of the patients in former studies conducted with the CIPA screening tool [7, 8, 11] and yet, in this work, the proportion was below 20%. This translated into a number of nutritional treatments – the basis for improvement in the clinical prognosis of malnourished patients – lower than expected. In addition, some of the doctors who attended the control group are generally very sensitive to the importance of the patient’s nutritional status and prescribed more nutritional supplements than is usually the case. That led to 44 patients receiving these supplements compared to 102 in the intervention group; hence the difference between the groups was much smaller than typically expected for this type of centre.
The large number of study patients needed to demonstrate the cost-effectiveness of these screening tools is indeed a reason for the lack of published work in this field. A recently published systematic review on the possible advantages of hospital nutritional screening, promoted by the Spanish Ministry of Health [27], highlighted that there is no gold standard tool, but that their use in hospitals of more than 1000 beds could bring economic savings of at least 48 million euros, which confirms the great relevance of the subject of this work and the importance of conducting cost-effectiveness analyses.
Based on the outcomes of this work, for now we can recommend the use of the CIPA nutrition screening in patients with general and digestive surgical pathologies, as lower costs as well as a better clinical prognosis were observed. It is reasonable to think that a larger patient sample could unmask a more pronounced decrease in the mean stay than detected in this work. In view of the aforementioned data, the design and possible biases that may have affected the results in internal medicine patients should be re-evaluated in future studies.
The main lesson we can draw with respect to the design of future evaluations is related to the finding that the small number of patients with a positive screening result and nutritional treatment was insufficient to achieve significant improvements in clinical outcomes and cost-effectiveness. Future studies should ensure that a larger and more heterogeneous sample of patients is included. In this regard, our team is planning a cluster-randomised clinical trial, taking advantage of the upcoming implementation of the CIPA screening tool in other hospitals in the region.
In conclusion, the findings of this study indicate that the CIPA screening tool is likely to be cost-effective when applied to patients on surgical wards, but did not yield a cost-effective outcome in the internal medicine patients. Future studies should aim at increasing the sample size and include more heterogeneous patients, which might better capture the expected differences in costs and health outcomes across screened and unscreened patients.