
Introduction
Short stature is defined as a weight and/or height that is more than 2 standard deviations (SD) below the growth curves of the reference population, or by a marked deceleration in growth rate. Its prevalence is estimated at 2.5%, with a greater predominance in boys [1].
This delay can be attributed to various etiologies; hence, it is crucial to differentiate between constitutional or genetic origins and acquired pathologies, especially those of a chronic nature. To accomplish this, a thorough and well-conducted diagnostic approach is essential.
Although growth hormone deficiency (GHD) is responsible for only 20% of cases, accurately diagnosing GHD is crucial because treating it is costly and involves recombinant growth hormone (GH). Estimating the exact incidence of GHD in children worldwide is challenging. However, several studies suggest that it affects between 1 in 4,000 and 1 in 10,000 children [2].
GH secretion is pulsatile. Consequently, a single-point measurement is unreliable and only provides limited information about GHD. To accurately assess GH reserve, it is necessary to conduct dynamic tests. The most commonly used are the insulin tolerance test (ITT), glucagon stimulation test, arginine, clonidine, and L-Dopa [3, 4]. Two abnormal test results are required to confirm GHD [5].
Developed in the 1960s, the ITT is considered the gold standard for detecting somatotropic deficiency. The aim of this test is to induce biochemical hypoglycemia (a blood glucose level of ≤ 2.2 mmol/l) in order to correctly assess the somatotropic axis. Once this level is reached, counter-regulatory hormones, including GH, are activated to counteract hypoglycemia, suppress insulin levels, and activate hyperglycemic defense mechanisms. The diagnosis of somatotropic deficiency is confirmed when the peak GH level is less than 10 ng/ml [6].
The symptoms of adrenergic and neuroglycopenic hypoglycemia accompanying the achievement of the hypoglycemic threshold value make the test unpleasant and potentially dangerous for the patient [7]. Therefore, close medical supervision by experienced medical staff is necessary to manage adverse effects and complications [8].
The maintenance of the hypoglycemic threshold is justified by its good sensitivity and specificity, but without consideration of its associated risks and adverse effects. Several authors have questioned the need to reach this threshold, deeming it somewhat severe [9, 10]. The argument is that some children may exhibit a normal GH peak as soon as hypoglycemic symptoms appear at higher blood glucose values (> 2.2 mmol/l) [5].
In some cases, children failed to reach the hypoglycemic threshold during the test due to the development of potentially severe warning symptoms, which resulted in the medical team stopping the test [11, 12].
Therefore, it would be valuable to ascertain whether the response in these children remains adequate and, if so, whether the occurrence of hypoglycemic symptoms alone is adequate for eliciting the GH response, potentially allowing for earlier termination of the test before reaching the threshold of 2.2 mmol/l (0.4 g/l).
To the best of our knowledge, the assessment of a higher threshold has rarely been discussed worldwide, and there have been no publications on this subject in Africa.
The primary objective of this study was to compare GH responses during the ITT in children who reached biochemical hypoglycemia (≤ 2.2 mmol/l or ≤ 0.4 g/l) and those in whom the test was terminated due to the onset of hypoglycemic symptoms without achieving biochemical hypoglycemia (> 2.2 mmol/l or > 0.4 g/l). The secondary aim was to establish a new, higher glycemia cut-off that would still elicit an appropriate GH response without increasing the adverse effects of insulin-induced hypoglycemia.
Patients and methods
We conducted a single-center, cross-sectional study over a 23-year period from 2000 to 2023, including children with short stature who presented at the endocrinology department of the Farhat Hached University Hospital in Sousse, Tunisia.
Patients with short stature, as defined by the European Society of Endocrinology [5], were included in this study if they met one or more of the following criteria: height ≤ –2 SD from the mean height for age and sex without a detected organic etiology, a slowdown in growth velocity, or a significant delay in bone age (> 2 years), which was a key criterion for inclusion of older adolescents. This ensured that all patients, regardless of chronological age (up to 17 years), had open growth plates and thus potential for further linear growth, making the evaluation of the somatotropic axis clinically relevant.
Children who were under 5 years old, had congenital or rhythmic cardiac issues, a history of neurological disorders, untreated hypothyroidism, Addison’s disease, or celiac disease, were excluded from the study. In addition, individuals using long-term corticosteroid therapy, psychotropic drugs, or iodine-based treatment and those with an allergy to insulin were also excluded.
Assessment of the somatotropic axis
ITT
The test is performed after a 12-hour fast. Once the patient has been examined and vital signs noted, an intravenous injection of 0.1 IU/kg of rapid insulin (Actrapid® or Insuman Rapid®) (or 0.15 IU/kg if the child is obese) is given 30 minutes after insertion of a peripheral venous catheter. Blood samples for GH serum and glycemia measurements are obtained in the basal state and at the time of symptomatic hypoglycemia (determined by clinical findings and capillary blood glucose levels) and after 10, 20, 30, 45, 60, 90, and 120 minutes.
Close medical monitoring of consciousness and signs of hypoglycemia is necessary to detect any serious complications, such as convulsions, loss of consciousness, drowsiness, or hypothermia. If hypoglycemia occurs or capillary blood glucose levels drop to ≤ 2.2 mmol/l (≤ 0.40 g/l), both blood glucose and GH levels are measured.
If hypoglycemia is not tolerated, the test is halted, and an intravenous injection of 30% serum glucose is administered. Subsequent blood samples are then taken, considering that pituitary stimulation would have been sufficient.
The test was conducted under fasting conditions between 8 am and 9 am. Samples were taken in a dry tube and serum levels of various hormones were measured using the Immuno Radio Metric Assay method. The serum levels of these hormones were measured using the radioimmunoassay method with a commercially available kit (Beckman Coulter) with a sensitivity of 0.1 ng/ml for GH. The intra-assay and inter-assay coefficients of variation were respectively 5.8% and 2.1%.
Statistical analysis
We used statistical software (SPSS version 25.0) for data entry and analysis. Assay results were expressed as mean ±SD. To compare patients in the two subgroups, we used Student’s t-test for quantitative variables and the χ2 test, when validity conditions allowed, for qualitative variables. The study of the association between two quantitative variables was carried out using the Pearson correlation coefficient after verification of the normality of its distribution by the Kolmogorov–Smirnov test. The receiver operating characteristic (ROC) curve was used to find the blood glucose threshold for good sensitivity and specificity in the ITT test.
Results
The study population comprised 129 patients, including 91 males (70.5%) and 38 females (29.5%). The mean age was 12.06 ±3.48 years, with a mean age between 5 and 17 years.
The patients were divided into two groups (Table I): G1, which included 93 patients (72.1%), and G2, which included 36 patients (27.9%).
Table I
Glycemic means and hypoglycemia frequencies in both groups under the insulin tolerance test
The distribution of patients by age was comparable in the two groups (p = 0.71). G1 consisted of 70 boys (75.3%) and 23 girls (24.7%), while G2 included 21 boys (58.3%) and 15 girls (41.7%). The gender distribution of patients in the two groups was similar (p = 0.058). The mean height was 133.12 ±15.92 cm for boys, ranging from 96 to 160 cm, and 128.24 ±14.15 cm for girls, with heights ranging from 87 cm to 148 cm.
The mean weight was 31.27 ±10.75 kg, ranging from 12.5 kg to 60 kg, in boys and 28.48 ±9.69 kg, ranging from 12 kg to 53 kg, in girls. The mean bone age was 9.66 ±3.25 years in G1 and 9.65 ±3.87 years in G2 (p = 0.977). Bone age was lower than chronological age in 91.4% of cases in G1 and 94.4% of cases in group 2 (p = 0.725).
In G1, 78 patients (83.9%) had low insulin-like growth factor 1 levels, compared with 28 patients (77.8%) in G2 (p = 0.417). Each patient received a dose of rapid insulin of 0.1 IU/kg (or 0.15 IU/kg if the child was obese) with a mean of 3.22 ±1.298 IU in G1, ranging from 1 to 8 IU, and 3.47 ±1.291 IU in G2, ranging from 1 to 6 IU (p = 0.320) (Table II).
Table II
Growth hormone (GH) means and peak frequencies in both groups under the insulin tolerance test
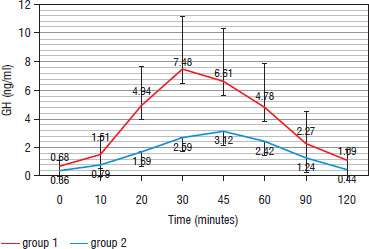
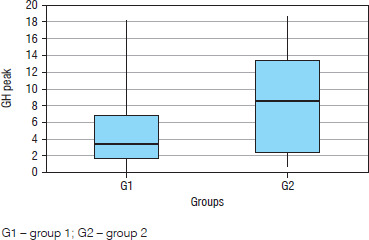
During ITT, GH in G1 reached a mean peak of 4.71 ±3.20 ng/ml, ranging from 0.1 to 18.20 ng/ml, significantly lower than GH in G2, which was 8.56 ±5.99 ng/ml, ranging from 0.7 to 18.6 ng/ml (p = 0.01) (Figure 1). The GH peak most frequently occurred at the 30-minute mark (G1: 36.6% vs. G2: 50%) (p = 0.08) (Figure 2).
Figure 1
Mean growth hormone (GH) level for each time in both groups during the insulin tolerance test
In our study population, 77.5% of patients (n = 100) exhibited somatotropic deficiency (Table III). During the ITT, minor symptoms of hypoglycemia occurred in 112 patients: 76 patients (81.7%) in G1 and all patients in G2.
Table III
Evaluation of the somatotropic axis in G1 and G2
| Somatotropic axis | G1 [n (%)] | G2 [n (%)] | p |
|---|---|---|---|
| Total somatotropic deficiency | 64 (68.8) | 15 (41.7) | 0.01 |
| Partial somatotropic deficiency | 16 (17.2) | 5 (13.9) | |
| No somatotropic deficiency | 13 (14) | 16 (44.4) |
Adverse clinical effects were frequently observed during the 20th minute of the ITT in both groups (G1: 55.3% vs. G2: 52.8%), with a comparable distribution (p = 0.8). The most frequent adverse effects were sweating in 58.1% of cases, pallor in 56.6% of cases, hunger in 53.5% of cases, headache in 48.1% of cases, and palpitations in 30.2% of cases. No serious symptoms were reported during the test.
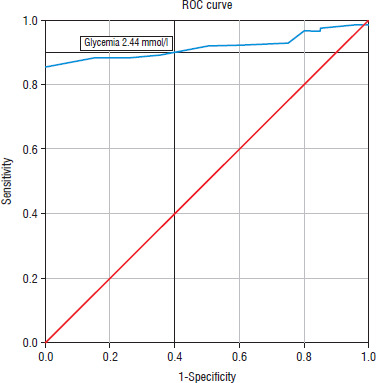
The glycemic nadir threshold was evaluated using the ROC curve, which identified a value above 2.2 mmol/l as providing a good balance of sensitivity and specificity.
ROC curve analysis revealed a threshold of 2.44 mmol/l with a sensitivity of 90% and a specificity of 60%. The area under the curve (AUC) was 0.915, with a 95% confidence interval of 0.87–0.96 (p < 10-3). Analysis of the same curve revealed a cut-off that increased with increasing sensitivity (Figure 3).
Discussion
In our study, the glycemic nadir of G1 was most frequently observed between the 20th and 30th minute, with percentages of 52.7% and 37.6%, respectively. Peaks were noted at 30 minutes in other series [12–14], and this can be attributed to the protocol used in these studies, following the Glasgow Royal Infirmary and Glasgow Western Infirmary guidelines [8]. This protocol involves taking 6 blood samples at intervals of 0, 30, 45, 60, 90, and 120 minutes [8].
The mean glycemic nadir of G1 patients was 2.17 ±0.67 mmol/l. Our results align with the findings of Rhee et al. [15], who identified a nadir of 2.11 mmol/l, most frequently observed at the 20th minute. Other studies have reported even lower nadir values [8, 16].
The average GH peak was 4.71 ±3.20 ng/ml, frequently occurring at 30 and 45 minutes (36.6% and 35.5% respectively). These findings align with the results reported by Lone et al. [10] and Rhee et al. [15]. Notably, peaks at 60 minutes were observed in studies conducted by Ibrahim et al. [14] and Yeoh et al. [13].
Furthermore, the observation of only one child with a GH peak at 120 minutes in our study group is in line with the observations of Jabbar et al. [17], who suggested that the exclusion of blood sampling at 120 minutes only marginally affected the cost-effectiveness of ITT for the diagnosis of GHD.
In our cohort, 77.5% of patients exhibited somatotropic deficiency. This prevalence aligns with that reported by Lone et al. [10] (66%), Rhee et al. [15] (69.2%), and Ibrahim et al. [14] (81.9%). These studies were comparable to ours in terms of the number of patients and a similar protocol.
Most previous studies have indicated that blood glucose levels need to reach 2.2 mmol/l (0.40 g/l) to initiate a stress response, which may be essential at the beginning of ITT [11].
In our endocrinology department, we also apply this cut-off value for ITT, and in the current study, a majority of patients (72.1%) reached a blood glucose level of ≤ 2.2 mmol/l during the test.
It is worth noting that under certain conditions, there may be a mismatch between blood glucose levels and symptoms of hypoglycemia. Hypoglycemia is defined by a threshold of 2.8 mmol/l (< 0.50 g/l) [18].
When blood glucose levels drop, activation of the autonomic nervous system induces neurogenic symptoms, allowing hypoglycemia to be perceived. These symptoms tend to disappear when blood glucose levels return to normal [19].
The counter-regulatory response to hypoglycemia begins when blood glucose levels reach a threshold of < 3.9 mmol/l (0.7 g/l). The initial response involves a decrease in insulin levels. As blood glucose levels drop, glucagon is released and catecholamines increase [19]. Despite the rapid impact of glucagon and catecholamines on blood glucose regulation, the cortisol and GH responses during hypoglycemia are delayed [20, 21]. The severity of this response is influenced by the depth of hypoglycemia achieved [20, 22]. However, Amiel et al. [22] found that the cortisol and GH response did not depend on the severity of glycemic drop.
A study by Simsek et al. [11] compared GH and cortisol responses in patients with and without biochemical hypoglycemia (2.2 mmol/l; 0.4 g/l) during the ITT. Interestingly, despite lower blood glucose levels, patients with biochemical hypoglycemia had lower peak and AUC values for GH and cortisol than the group without biochemical hypoglycemia. The study suggests that the depth of the response of the counter-regulatory system to hypoglycemia does not necessarily depend on the severity of the hypoglycemia. They proposed that clinically symptomatic hypoglycemia should be taken into account rather than relying solely on biochemically confirmed blood glucose (≤ 2.2 mmol/l or ≤ 0.4 g/l).
Therefore, further insulin administration may be avoidable in patients who have not achieved biochemical hypoglycemia but who have shown symptoms on initial insulin administration. ITT inevitably leads to uncontrolled hypoglycemia, which represents a potential risk to patients and medical staff. Ajala et al. [23] also found that the hypoglycemia achieved during ITT was considerably lower than the required threshold. Borm et al. [24] reported that low-dose glucose infusion did not influence the cortisol and GH peak responses during ITT; however, it is essential to note that their study included only 16 healthy subjects, and no patients with hypopituitarism were involved.
In a study by Lee et al. [25], fasting blood glucose was identified as the most crucial determinant of the insulin dose required to achieve adequate biochemical hypoglycemia (blood glucose ≤ 2.2 mmol/l or ≤ 0.4 g/l) during the ITT. In our study, we aimed to identify a value above 2.2 mmol/l that would ensure a good balance of sensitivity and specificity. The nadir blood glucose threshold determined by the ROC curve was 2.44 mmol/l, with a sensitivity of 90% and a specificity of 60%.
By adopting this new glycemic threshold of 2.44 mmol/l (0.44 g/l), the number of patients achieving a peak GH ≥ 10 ng/ml not only persisted but increased.
Protocols may differ as to the depth of hypoglycemia required to be considered adequate [23]. Most teams refer to 2.2 mmol/l (0.4 g/l), 2.5 mmol/l (0.45 g/l), or 2.8 mmol/l (0.50 g/l) [10, 12, 15, 26]. Some American authors define adequate hypoglycemia as a threshold below 2.5 mmol/l (0.45 g/l) or a blood glucose level more than 50% lower than the initial blood glucose level at T0 [27]. According to the consensus of the Italian Medicines Agency, the test is considered valid in the presence of symptoms of hypoglycemia and/or a 50% reduction in blood glucose from baseline at T0 or more and/or a blood glucose level < 2.5 mmol/l (0.45 g/l) [28].
Conclusions
Our study suggests that we should raise the hypoglycemic threshold to 2.44 mmol/l during the ITT. This proposal has several advantages, including reducing the risks associated with the test for both the patient and medical staff, maintaining good accuracy in test interpretation, and shortening the time to hypoglycemia onset. This may also help to reduce the overall cost of testing, especially if we only consider the early post-hypoglycemia period.


