BACKGROUND
Middle childhood and adolescence are associated with a variety of normative developmental challenges. In this stage, certain developmental tasks fundamental to the acquisition of social, emotional and cognitive skills are known to take place. These include school transitions, making friends, establishing first romantic relationships, and making efforts to seek autonomy from parents. In this period, adolescents seek identity, assume more responsibilities, and develop different views than adults, which can cause a decrease in the control of adults. As a result, they spend more time with the same age group. In this process, the relationships that adolescents establish with their peers play an important role in their development.
Developing and maintaining friendships, being loved by peers, and developing social relationships with peers are important developmental tasks of childhood (Rubin et al., 2015a). Fulfilling these developmental tasks supports the development of adolescents in more ways than one. Studies show that adolescents with quality friendships report more happiness, life satisfaction, and self-esteem (Raboteg-Saric & Sakic, 2014), safe peer groups have a determining effect on social and emotional well-being (Foubister, 2017), and strong peer relationships increase social cohesion (Asher et al., 2008). In addition, children who are accepted by their peers are known to have high academic success (Lubbers et al., 2006).
With the transition from childhood to adolescence, the importance of peers increases, which causes changes in individuals, social context, and social norms (Brown & Larson, 2009). In this process, children share their common interests and feelings at a certain level owing to the relationships they establish with their peers. In this process, the peer relationship functions as a support process to strengthen shared values and qualities. Relationships with peers provide unique opportunities to not only recognize social norms and processes, but also to learn new social skills (Boivin, 2005). Adolescents learn how to interact with others by acquiring skills such as conflict management, listening, empathy, and intimacy in their relationships with their peers. In this regard, peer relationships may include characteristics such as love, intimacy, reliable partnership, academic performance, a sense of belonging to the group, and self-esteem.
Many factors emerging from different perspectives are known to influence children’s peer relationships. These perspectives have been theorized by various researchers: social learning theory – children can develop positive relationships with their peers as long as they behave socially appropriately (Berk, 2013; Prat et al., 2010; Saltalı & İmir, 2018); cognitive theory – children learn from each other by talking, sharing, playing, discussing, and learning new ways of approaching as well as solving problems by working together and watching each other (Kerwin & Day, 1985); ecological theory – premised on the fact that the systems around children affect each other, and supporting interpersonal skills contributes to peer relationships; similarly, peer relationships that children establish may affect parent-child relationships (Cabrera et al., 2014; Taylor & Gebre, 2016); group socialization theory – socialization outside the home in peer groups with children’s advancing age is a determinant of the personality development of adolescents (Reitz et al., 2014).
Attachment theory is another approach that guides research on children’s peer relationships and forms the conceptual basis of the scale developed in this research. Attachment theory argues that attachment to peers is important in the development of individual differences and that attachment relationships affect adolescents’ attitude towards close friendship (Armsden & Greenberg, 1987; Immele, 2000). The degree of peer activity, having a best friend, perceived acceptance by peers and peer commitment are indicators of strong peer relationships. The theory argues that being safe in peer relationships is more likely to be perceived as prosocial and less likely to be perceived as aggressive, destructive, and timid (Dykas et al., 2008). During adolescence, the child starts to turn to his peers more. In this period, attachment behaviors emerge as sharing emotions, anxieties and fears with the attachment figure rather than seeking physical intimacy (Karakuş, 2012). Attachment theory reveals the relationship between intimacy and attachment (Bauminger et al., 2008).
THE PROBLEM SITUATION AND IMPORTANCE OF THE RESEARCH
Studies on children’s relationships with their peers have been proven to provide important opportunities in developing interpersonal skills (Parker et al., 2006). For this reason, valid and reliable measurement tools that can measure peer relationships play an important role in conducting research on children’s peer relationships. Many studies have been conducted to evaluate the peer relationships of children and adolescents (Armsden & Greenberg, 1987; Bukowski et al., 1994; DeWalt et al., 2013; Finger et al., 2008; Hudson, 1990; Hulsey, 2008; Kaner, 2000; Klarin, 2000; Parada, 2000; Parker & Asher, 1993; Pierce et al., 1991; Rigby & Slee, 1993; Yao et al., 2012). Upon examination of the scales, most of them were revealed to have been developed more than 20 years ago. In the 21st century, different perspectives on peer relationships have emerged (Perren et al., 2011). The increase in social media use among adolescents in recent years (Twenge et al., 2019) has weakened face-to-face interaction (Mims, 2017). This has led to changes in communication and social relations. As a result, peer relationships have brought a new perspective (Nesi et al., 2018). This transformation process of peer relationships shows that the scales developed in recent years will be more effective in measuring peer relationships. However, there are some limitations in the recently developed scales. Some of these scales created scale items based on a theory (Yao et al., 2012); groups with chronic diseases (DeWalt et al., 2013); application in children/adolescents addicted to substances (Yao et al., 2012) or cases of peer bullying (Hulsey, 2008); or testing on limited age groups (Finger et al., 2008). When the scales developed are examined in general, it can be said that they have disadvantages such as not being theoretically based, being developed in limited age groups and special groups (such as chronic disease, substance addiction), evaluating peer relationships based on peer bullying, and not being current. The theoretical basis of modern research on children’s peer relations has been established over 80 years (Rubin et al., 2015b), although the focus of attention in recent years appears to be limited to measurement of peer relations. Moreover, the developed scales have limitations as they were developed based on an inclusive group, not including only a special group in the study (such as disabled, substance addicts, chronic illnesses), but including different age groups (11-18); and not using attachment theory, which forms the conceptual basis of the scale in previous measurement tools. This is seen as important in terms of being up to date and capable of measuring 21st century peer relationships. Attachment theory is thought to be important because 21st century skills require development in communication and social relations, because in the 21st century, it has been observed that technology weakens social relations. Considered within the framework of attachment theory, peers will be able to regulate their behavior by observing each other during their interaction with each other. Thus, they will be able to exhibit appropriate social behaviors. Developing a measurement tool that can evaluate these competencies within the framework of attachment theory is considered important in terms of revealing the peer relationships of children in the 21st century. Therefore, the study aimed to develop a valid and reliable scale for measuring the peer relationships of adolescents studying in secondary and high schools.
PARTICIPANTS AND PROCEDURE
RESEARCH MODEL
This study was conducted in a methodological, descriptive, cross-sectional manner in order to develop a valid and reliable measurement tool capable of measuring peer relationships of adolescents.
PARTICIPANTS
The research was conducted in the city center of Erzincan, a small city in eastern Turkey. Erzincan is an agricultural city with a medium socio-economic level. In the study, 543 adolescents attending secondary schools and high schools during the 2020-2021 academic year were included within the scope of the scale’s construct validity studies. After the construct validity of the scale was tested, for the criterion validity and test-retest reliability, 100 adolescents from secondary schools and high schools were randomly selected. The measurement tool developed for this study group was applied twice for one month for test-retest reliability. The demographic characteristics of participants included in the test of the scale’s construct validity are shown in Table 1.
Table 1
Participants’ demographic characteristics
An examination of Table 1 reveals that 53.6% of the adolescents are girls; 55.4% of them are in the 15-18 age group; 54.7% of them are in high school; 58.4% of them have two or fewer siblings. Secondary school is the education level after basic education. Secondary school students include adolescents studying in the 5th, 6th, 7th and 8th grades. High school is the education level after secondary school. High school students include adolescents studying in the 9th, 10th, 11th and 12th grades.
DATA COLLECTION TOOLS
In this study, the personal information form with the Peer Relationship Scale for Children and Adolescents (CA-PRS), the Peer Support Scale and Stirling Children’s Well-being Scale were used to test the criterion validity of the scale.
Personal information form. In the personal information form, questions are included to obtain demographic information of the adolescents, such as gender, age, school level, number of siblings, birth order and education level of parents.
Peer Support Scale. The Peer Support Scale, a sub-dimension of the Perceived Social Support Scale (PSSS-R) developed by Yıldırım (2004), measures the social support perceived by the individual from his/her friends. There is evidence that the scale can be applied to children studying at secondary and high schools (Şahan & Duy, 2017; Yıldırım, 2004; Yiğit et al., 2018). The scale, comprising 13 items, is a 3-point Likert type and is scored as 1 – not suitable for me, 2 – partially suitable, 3 – suitable for me. High scores indicate a high level of perceived social support. Factor analysis and similar scales validity were performed to examine the validity of the scale. Significant relationships were found between the scale and sub-scale scores of the Beck Depression Inventory and the Everyday Distress Scale. The Cronbach’s α reliability coefficient was first calculated for the reliability of PSS-R and subscales. Subsequently, the test-retest reliability was also examined. The internal consistency coefficient for the Peer Support Scale is .83. Test-retest correlation coefficients are .93, .81 and .81, respectively (Yıldırım, 2004).
Stirling Children’s Well-being Scale. Developed by Liddle and Carter (2015) and adapted to the Turkish version by Akın et al. (2016), the scale measures the social and emotional well-being levels of primary, secondary and high school students. The scale consists of one dimension and 12 items. The scale, designed as a 5-point Likert type, is scored as 1 – never, 2 – very little, 3 – sometimes, 4 – often, 5 – always. The lowest score that can be obtained from the scale is 12, with the highest possible score being 60. High scores indicate that children’s social and emotional well-being levels are high. After the confirmatory factor analysis (CFA), the scale was found to fit well (χ2 = 96.87, df = 54, RMSEA = .073, SRMR = .051, CFI = .93, IFI = .93, GFI = .90). Item-total correlation coefficients of the scale ranged from .57 to .73, and the Cronbach’s α was found to be .90.
PROCEDURE
For data collection, approval was obtained from Erzincan Binali Yıldırım University Human Research Ethics Committee (protocol no. 04/07, date: 30/04/2020). Thereafter, the directors of the schools where the research was to be conducted were informed about the purpose of the study. Consent forms were signed by adolescents’ families and delivered through the schools to the adolescents, who were then informed about the research and asked to fill out the forms. The forms were collected after the adolescents filled them out.
ANALYSIS OF DATA
For the validity analysis of the scale, content validity and criterion validity analyses were utilized. Content validity was examined by exploratory factor analysis (EFA) and confirmatory factor analysis (CFA). While performing exploratory factor analysis (EFA), Bartlett and Kaiser-Meyer-Olkin (KMO) tests were applied to confirm the suitability of the data set for EFA. The relationship between item-total score and item-subscale total scores was analyzed using Pearson correlation analysis. RMSEA, RMR, SRMR, CFI, NFI, RFI, GFI and χ2 fit indices were checked for the purpose of CFA. For criterion validity, the relationship between the Peer Support Scale and Stirling Children’s Well-being Scale was tested with correlation analysis. To ascertain the reliability of the scale, test-retest, Cronbach’s α internal consistency coefficient and split-half reliability analysis were utilized.
DEVELOPMENT OF THE SCALE
In the process of developing the scale, the conceptual definition of the features to be measured was performed first. To this aim, the scale was prepared on the basis of attachment theory. According to this theory, adolescents adopt normal behaviors as a result of their interactions with each other, and in this respect, peers are effective in the development of many social skills of adolescents. For this reason, how adolescents spend time with their peers and what kind of benefits they gain in this process are the issues that attract the attention of the theory. This theory states that adolescents who trust each other have stronger peer interactions, and those with a high level of bonding among each other are also competent in emotion regulation skills (Dykas et al., 2008). Attachment theory posits that adolescents who establish close friendships and support each other exhibit stronger social relationships and exhibit accepted behaviors (Immele, 2000). Attachment theory argues that feelings of intimacy and intimacy are important (Collins & Feeney, 2004). Also, likeability or social acceptance (popularity or rejection) by peers indicates the level of commitment in the group with other children (Gifford-Smith & Brownell, 2003). Based on this idea, efforts have been made to develop a scale in line with competencies such as establishing close relationships in peer relationships, mutual trust, being appreciated when acting in accordance with the norm among peers, being shown as an example, being tolerant and understanding.
After determining the conceptual structure of the scale, the process of item creation was commenced. In this process, the relevant literature was scanned and similar scales were examined. In addition, interviews were conducted with the teachers of the adolescents attending secondary and high schools. Opinions were obtained from teachers about the behaviors observed by adolescents in their peer relationships, which behaviors of the adolescents are adopted by their peers, and what are the strong indicators of peer relationships. As a result, an item pool of 54 items was created. The form of measurement was determined simultaneously with the creation of the items. Accordingly, it was decided that the scale should be a 5-point Likert type listed as strongly disagree, disagree, undecided, agree, and completely agree.
In order to determine the suitability of the items, seven experts, two linguists and five field experts (three child development specialists, two guidance and psychological counselor teachers), were consulted. Experts were asked to mark one of the unsuitable, partially suitable and unsuitable options for each item and to explain their opinions. As a result of expert opinions, the items were corrected in terms of expression and content. In addition, 4 items were removed from the pool because the experts did not measure the structure to be measured and stated that there were similar items. Later, the scale was administered to 20 adolescents individually. The necessary corrections were made in line with the adolescents’ criticism of the length and comprehensibility of the items. As a result, the draft scale consisting of 50 items was included in the validity and reliability analysis.
RESULTS
During the scale’s development process, validity and reliability analyses were undertaken and the results are reported as follows.
CONTENT VALIDITY
Exploratory and confirmatory factor analyses were performed within the scope of the content validity of the scale and the results were reported. Items included in the item pool consisted of 50 items forming a draft scale. As a result of the analysis, a scale consisting of 29 items was obtained. The suggested processes of the peer relations scale were pre-applied and item fit was examined. Accordingly, item-total correlation values were examined and each item’s level of agreement with the overall scale was determined. At this stage, two criteria were taken into consideration. The Cronbach’s α value for the overall scale is .70 and above, and each item has a total correlation value of at least .30 (Seçer, 2015). During the examination of item total correlation values, the Cronbach’s α value of the scale consisting of 50 items was found to be .82, but the correlation value of 16 items was found to be .20 and below. Therefore, in line with the suggestions made in previous studies (Büyüköztürk, 2012; Schriesheim & Eisenbach, 1995; Seçer, 2015), these items were removed from the scale and the analysis was repeated. This repeated analysis revealed that the Cronbach’s α value increased to .94 and the item total correlation values varied between .31 and .37. In this form, EFA was applied in the second step to determine the factor structure of the scale with 34 items. It was suggested that the variance value explained in EFA should be at least 30%, the explanatory coefficient for each factor should be 5%, there should be no overlapping item, and the factor load value of each item should be at least .30 (Schriesheim & Eisenbach, 1995; Seçer, 2013, 2015).
In the EFA, Kaiser-Meyer-Olkin (KMO) and Bartlett tests were applied, which were accepted as a prerequisite for the analysis and revealed the suitability of the data set obtained from the study group for EFA. In this context, KMO was found to be .94 and the Bartlett test χ2 value was observed to be 6830.34 (p < .001). The KMO was higher than .60 and the Bartlett test was significant, so the data were considered suitable for factor analysis (Field, 2009; Pallant, 2001; Seçer, 2015). After determining the suitability of the data set, EFA was applied and the factor load values of the 3 items in the scale were determined to be below the recommended critical value of .30 during the analysis. In addition, 2 items were removed from the scale and the data set because their characteristics revealed overlapping items. EFA was repeated after removing the items, and in the maximum likelihood technique, the scale was found to have a sufficient variance explanation coefficient in a structure comprising four factors and 29 items. Findings regarding EFA are presented in Table 2.
Table 2
Results of exploratory factor analysis
An examination of Table 2 reveals that the Peer Relationship Scale has a four-factor structure. The factor load values of the items in factor 1 vary between .30 and .87. The load values of the items in factor 2 vary between .38 and .85, the load values of the items in factor 3 range from .51 to .80, and the load values of the items in factor 4 vary between .56 and .80. Item total correlation values vary between .31 and .72. Therefore, considering the item-total correlation values and the four-factor structure obtained as a result of EFA, it can be inferred that the Peer Relationship Scale has a four-factor latent structure.
CFA was applied in the third stage to examine the model fit of the four-factor structure obtained from EFA. Under the CFA analysis, a four-factor structure consisting of 29 items was tested, and different fit indices were used in the process of evaluating the analysis findings. The fit indices used are CFI, NFI, GFI, AGFI, RMR, SRMR, RMSEA and χ2. Different criteria are proposed for the mentioned fit indices in CFA. Schumacher and Lomax (2004) and Tabachnick and Fidell (2013) stated that model fit indices should be .90 for acceptable fit, and ≥ .95 for perfect fit for RFI, TLI, CFI, NFI, NNFI and IFI for GFI and AGFI. According to them, it should be .85 for acceptable fit and ≥ .90 for perfect fit, and ≤ .08 for acceptable fit and ≤.50 for perfect fit for RMR, RMSEA, and SRMR (Tabachnick & Fidell, 2013). Figure 1 illustrates the CFA results regarding the model fit of the Peer Relationship Scale.
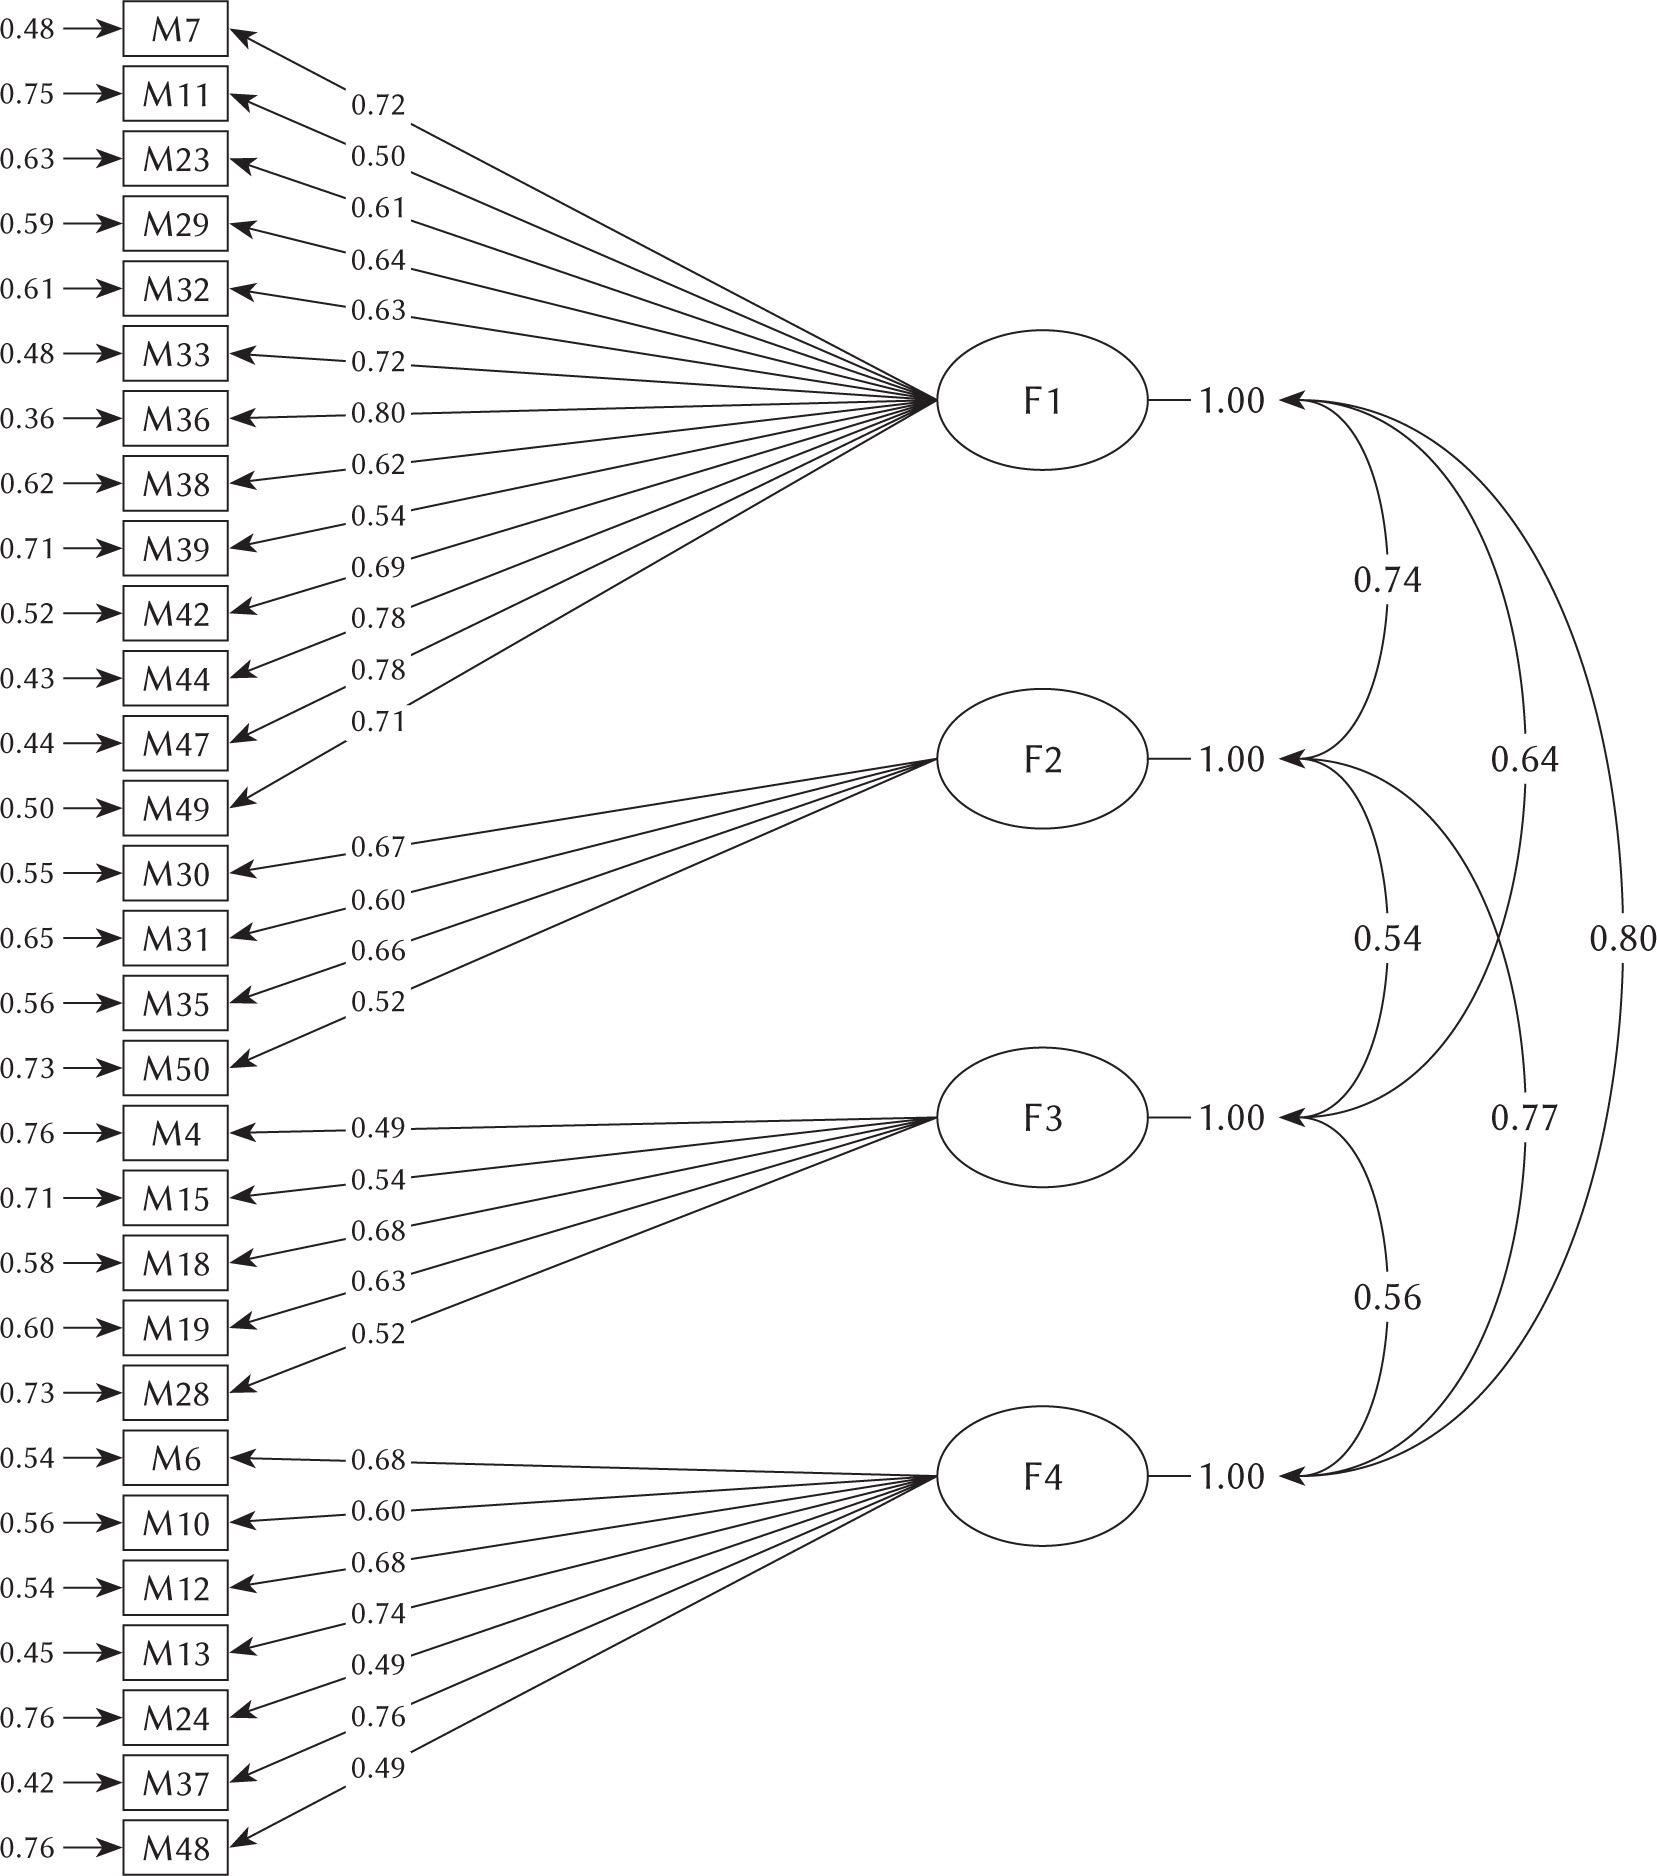
An examination of Figure 1 reveals that the structure of the Peer Relationship Scale, which consists of 29 items and four sub-dimensions, has a good and sufficient level of adaptation. When the model fit indices of the scale are examined (χ2/df = 2.96, RMSEA = .068, RMR = .041, SRMR = .061, CFI = .97, NFI = .98, RFI = .97, GFI = .96), they are found to be above the recommended critical values (Schumacher & Lomax, 2004; Seçer, 2015). The four-factor structure of the scale consisting of 29 items is observed to have a good level of adaptation. In addition, no modification process was applied and the items in each sub-dimension fit well. As a result of EFA and CFA, the structure of the Peer Relationship Scale, consisting of 29 items and four factors, was determined to have statistically good values and the scale was evaluated to have construct validity.
CRITERION VALIDITY
The analysis results regarding the criterion validity of the Peer Relationship Scale are given in Table 4.
Table 3
Analysis results regarding the criterion validity of the Peer Relationship Scale
Table 4
Cronbach’s α and split-half reliability analysis results
| Sub-dimensions | Cronbach’s α internal consistency | Split-half reliability |
|---|---|---|
| Intimacy | .94 | .87 |
| Popularity | .90 | .82 |
| Trust | .87 | .79 |
| Insightfulness | .84 | .77 |
| Scale total | .93 | .85 |
The Peer Support Scale and Stirling Children’s Well-being Scale were used to test the criterion validity of the scale. A relationship between the Peer Support Scale and the following sub-dimensions of the developed scale was found: for the intimacy sub-dimension .616; for the popularity sub-dimension .469; for the trust sub-dimension .512; for the insightfulness sub-dimension .263. The relationship between the Peer Support Scale and the developed scale was found to be .607. A relationship between the Stirling Children’s Well-being Scale and the following sub-dimensions of the developed scale was found: for the sub-dimension intimacy .244; for the popularity sub-dimension .431; for the trust sub-dimension .292; for the insightfulness sub-dimension .324. Furthermore, the relationship between the Stirling Children’s Well-being Scale and the developed scale was found to be .356. Therefore, it can be inferred that the scale has a strong, positive relationship with the Peer Support Scale and the Stirling Children’s Well-being Scale in a moderate and positive direction (Akoglu, 2018).
CRONBACH ALPHA AND SPLIT-HALF RELIABILITY
Cronbach’s α and split-half reliability analyses of the scale are shown in Table 4. An examination of Table 4 reveals that the internal consistency value for the overall scale is .93 and for the sub-dimensions this value is .94, .90, .87 and .84, respectively. The split-half reliability values are as follows: .85 for the total scale and .87, .82, .79 and .77 for the sub-dimensions, respectively. Given that scales with a reliability coefficient of .70 and above in the scale development and adaptation processes are considered reliable, it can be inferred that the internal consistency and semi-reliability coefficients of the Peer Relationship Scale for Children and Adolescents are sufficient (Landis & Koch, 1977; Robinson et al., 1991).
TEST-RETEST RELIABILITY
In order to determine the reliability of the scale by the test-retest method, the scale was applied to a group of 100 people at an interval of three weeks. The correlation coefficient among the applications was determined as .82. This result demonstrates that the test-retest reliability of the scale was ensured (Tavşancıl, 2019).
DISCUSSION AND CONCLUSIONS
Relationships with peers become more important in the middle school and high school years, which coincides with the adolescence period, when social circles are wider, peers’ views are valued more than those of adults, and identity development is important. For this reason, valid and reliable measurement tools capable of measuring peer relationships are needed to examine the conceptual basis of peer relationships of adolescents in these ages, so as to investigate the factors affecting peer relations, as well as to determine the trends/expectations towards peer relations in today’s world.
Although there are different tools for measuring the peer relationships of adolescents, the lack of a measurement tool within the framework of current and attachment theory reveals the necessity of the measurement tool developed in this study. Since the measurement tool is developed on the basis of attachment theory, it is necessary to understand the manner in which adolescents will behave by observing each other during their interactions with each other, keeping their behavior under control, exhibiting appropriate social behaviors, being a preferred friend and establishing interactions based on trust and mutual understanding. This, in turn, reveals how skills for building relationships should be developed and helps evaluate peer relationships in this context. It is these abilities that are expected from peer relationships. The results obtained from the developed scale revealed that sub-factors related to attachment theory were obtained. When the sub-dimensions of the scale are examined, intimacy contributes to expressing and sharing thoughts and feelings with another person, which is the distinguishing feature of adolescent friendship (Bauminger et al., 2008). Meanwhile, popularity is the determinant of the child’s level of love among peers, the number of friends, and the efficacy with which they get along with others (Burt & Donnellan, 2015). That element of trust has a strong, positive effect on organizational commitment levels and supportive behaviors towards each other. As a result, peer interactions are stronger (Chin, 2014; Tamer & Dereli, 2014), and insightfulness demonstrates appropriate behaviors in interpersonal relationships, problem solving and reasoning. To that end, it can be said to provide competence (Vannatta et al., 2009).
Scale development studies were conducted based on attachment theory in order to measure the peer relationships of adolescents. In line with expert opinions, 4 items were removed from the pool. The remaining 50 items were analyzed. A scale consisting of four sub-dimensions and 29 items was developed as a result of validity and reliability studies. The findings of this study revealed that the scale has sufficient psychometric properties. Items included in the sub-dimensions and sub-dimensions of the scale are presented in Table 5.
Table 5
Sub-dimensions and items of the Peer Relationship Scale
The Peer Relationship Scale for Children and Adolescents consists of four sub-dimensions. While the scale can be used as a whole, the sub-dimensions of the scale can also be used separately. The intimacy sub-dimension measures the level of intimacy and intimate relationships in peer relationships of adolescents. This sub-dimension comprises 13 items. The highest score that can be obtained from this sub-dimension is 65, whereas the lowest score is 13. Adolescents who score high in this sub-dimension are said to have close relationships with their peers. The popularity sub-dimension measures the popularity level of adolescents among their peers. There are 4 items in this sub-dimension. The highest score that can be obtained from this sub-dimension is 20, with the lowest possible score being 4. Thus, it is evident that adolescents with high scores in this sub-dimension are popular among their peers. The trust sub-dimension measures the level of trust of adolescents among their peers. There are 7 items in this sub-dimension. The highest score that can be obtained from this sub-dimension is 35, whereas the lowest possible score is 7. It can be said that adolescents with high scores in this sub-dimension have a high level of trust among their peers. The insightfulness sub-dimension measures the level of insightfulness of adolescents in peer relationships. There are 5 items in this sub-dimension. The highest score that can be obtained from this sub-dimension is 25 and the lowest possible score is 5. Thus, it can be inferred that adolescents who score high in this sub-dimension are understanding in peer relationships. There are no reverse scored items in the scale, and the level of peer relationships is measured as the total score. The highest score that can be obtained from the total of the scale is 145 and the lowest possible score is 29. A high score obtained from the total of the scale indicates that peer relationships are at a high level.
Within the scope of validity analysis of the scale, construct validity was performed by carrying out EFA and CFA. Within the scope of EFAs, 50 draft items were included in the analysis. It was observed that the scale had a sufficient variance explanation coefficient in a structure consisting of four factors and 29 items. The CFA revealed that the structure of the scale consisting of four sub-dimensions has a good and sufficient level of adaptation. The validity of the scale was evaluated with criterion validity. A strong, positive relationship was found between the developed scale and the Peer Support Scale. A moderate, positive relationship was found between the scale and the Stirling Children’s Well-being Scale. Thus, the criterion validity was confirmed. Within the scope of the reliability studies of the scale, it was determined that the Cronbach α and split-half reliability coefficients were quite high, whereas the test-retest reliability was at an acceptable level. Thus, it can be inferred that the scale, which was developed based on the results obtained from validity and reliability studies, is a measurement tool that can be used in studies involving adolescents studying at the level of secondary and high school (11-18 age group).
It was concluded that the scale developed based on attachment theory is compatible with the theory. Attachment theory guides socially oriented behaviors (Dykas et al., 2008). The sub-dimensions (intimacy, popularity, trust, insightfulness) obtained from the scale are related to attachment theory. The theory refers to relationships that create voluntary, sincere, and dynamic relationships based on cooperation and trust (Gifford-Smith & Brownell, 2003). The sub-dimensions refer to intimacy among peers, strong relationships, mutual understanding, and acceptance among peers. Furthermore, it argues that intimate bonds with others are an important feature for personal and spiritual development (Collins & Feeney, 2004). It is argued that attachment is associated with greater acceptance among peers, and thus, popularity (Szewczyk-Sokolowski et al., 2005). Trust is a fundamental construct in Bowlby’s and Ainsworth’s attachment theory (Smetana, 2010), which states that considering the perspectives of children, they will develop insightfulness towards their friends (Koren-Karie & Oppenheim, 2018). As can be seen, the scale is related to the conceptual basis of attachment theory. The sub-relationships of the scale also clearly show that the scale can build unity under its theory. Moreover, it can be said that the safe child shows more social competence and has a more positive peer group status (Dykas et al., 2008). Therefore, it can be stated that the child is more accepted and popular among peers. Importantly, the acceptance level of understanding is also positive (Oppenheim & Koren-Karie, 2013). According to these results, the sub-dimensions are related to each other as well as to attachment theory.
IMPLICATIONS, LIMITATIONS, AND FUTURE RESEARCH DIRECTIONS
In this research, peer relationships were developed in the context of attachment theory. Scales can be developed on the basis of different theories of peer relations.
In the study, peer relationships were evaluated only in terms of intimacy, popularity, trust and insightfulness. Scales can be developed to evaluate peer relationships across different dimensions.
It may be suggested to apply the scale in the developed groups and to carry out further studies on the subject.
It can be concluded that the scale is a valid and reliable measurement tool that can measure Turkish adolescents’ peer relationships. This is simultaneously the limitation of the research. Therefore, adaptation of the scale to different cultures can be suggested.