Introduction
Coronavirus disease 2019 (COVID-19) is a pandemic caused by SARS-CoV-2, which first originated in Wuhan, the capital of Hubei province, China in December 2019 and then spread to almost all countries [1]. As of 30th April 2020, the number of cases worldwide was recorded to be 3,256,570 with 233,363 deaths. Most of the data regarding COVID-19 clinical, radiological, and outcome features come from adult subjects. The Centre for Disease Control (CDC) COVID-19 Response Team reported that 1.7% of the COVID cases reported as of 2nd April 2020 occurred in paediatric patients aged < 18 years, and 20% of them required hospitalization, compared to 33% among adults [2]. The cumulative number of children COVID-19 cases based on data available from the American Academy of Paediatrics and the Children’s Hospital Association as of 25th February 2021 is 3,168,274 COVID-19 cases, and children represented 13.1% (3,168,274/24,134,958) of all cases. The overall rate is 4209 cases per 100,000 children in the population [3]. The true incidence of COVID-19 in the paediatric population is not known due to the lack of widespread testing and the prioritization of testing for adults and those with severe disease. Hospitalization admission rates in children with COVID-19 are significantly lower than hospitalization rates in adults, suggesting that children may have less severe illness from COVID-19 compared to adults [4].
The virus is thought to have a milder effect on children, with fever and cough being the most frequent presentations. However, children can be asymptomatic carriers of the virus and may play a role in the spread of COVID-19 [5]. Usually, the disease has a good prognosis in children, and it is very uncommon to progress to severe lower respiratory disease or require assisted ventilation [6].
Because the time between onset of symptoms and the development of acute respiratory distress syndrome (ARDS) is usually short, especially in risk groups, early recognition of the disease is essential for the management of these patients [7]. At present, the real-time reverse transcription polymerase chain reaction (RT-PCR) assay remains the standard of reference, but it was reported that false-negative RT-PCR was not rare, and in these patients initial chest CT might present abnormal findings indicating COVID-19 [2]. Moreover, a shortage of laboratory test kits limited the use of RT-PCR with the spread of the epidemic, especially in severely affected regions. The guidelines of Diagnosis and Treatment of Pneumonitis Caused by SARS-CoV-2 (trial 6th version) published by the Chinese government recommended chest CT as an effective method to screen suspicious cases. The addition of chest CT for diagnosis of COVID-19 resulted in tens of thousands of clinically diagnosed cases in China, which played an important role in controlling the epidemic situation in China [5].
All previous systematic reviews in the paediatric population describe the radiological characteristics of COVID-19; however, no previous reports focused on the diagnostic test accuracy. Therefore, comprehensive and timely evaluation of the effectiveness of chest CT for COVID-19 diagnosis remains urgent and mandatory. In the present study, we assess the diagnostic accuracy of chest CT in the diagnosis of COVID-19 in children through a systematic review and meta-analysis of diagnostic test accuracy among symptomatic and asympto-matic patients. Also, we aimed to gain a better understanding of the characteristics of clinical and chest CT features of COVID-19 infection in children.
Material and methods
Literature search
The research questions used were: “What are the diagnostic accuracy of chest CT in the diagnosis of COVID-19 in the paediatric population?” and “What are the chest CT and clinical features of COVID-19 in children?”. Under the PRISMA-DTA guidelines [8], we conducted a systemic literature search in the following databases: PubMed, Google Scholar, and Web of Science (WOS), to identify relevant articles published from 1st December 2019 until 30th April 2020. The search keywords used were as follows: “Chest CT” AND “COVID- 19” OR “coronavirus” OR “SARS- COV-2” AND “Children” OR “Pediatric”.
Study selection
References retrieved from the database search were reviewed and duplicates were excluded. First, 2 radiologists with 13 and 11 years of clinical experience independently screened titles and abstracts for inclusion and exclusion criteria. Next, if the abstract fulfilled the criteria as stated below or was unclear, both readers reviewed the complete original article. Disagreements were settled by consulting a third reviewer (a radiologist with 13 years of clinical experience).
The defined inclusion criteria for article eligibility were as follows: i) original articles, case series with 5 cases or more; ii) articles in English language; iii) full text article; iv) paediatric age group (age < 18 years) either separately or extracted from papers that demonstrate stratified data for both adults and paediatrics; v) COVID-19-confirmed patients by PCR; and vi) CT chest imaging characteristics are one of the outcomes. The defined exclusion criteria were as follows: i) adult age groups; ii) non-original research articles (review, commentaries, books, editorial); iii) non-imaging studies; iv) studies that did not report the results of chest CT; v) studies written in languages other than English; and vi) non-relevant studies that did not report sufficient details of the main outcomes were excluded following a reading of eligible articles in full text.
Data extraction
Data extraction was conducted by AHE, RE, NH, and MA. For each study, the following characteristics were extracted using pre-designed standardized sheets:
Study characteristics: first author’s name, date of publication, study design, country of origin, single-/multi-centre, sample size.
Patient characteristics: age, gender distribution, clinical findings, clinical severity classification, laboratory (abnormal CBC and elevated CRP), treatment, morbidities, and outcomes. Patients were classified as having minimal, common, severe, and critical illness [9]. Mini-mal disease patients have subtle clinical symptoms. Common cases have symptoms such as fever and mild coughing. Severe cases are the ones meet any of the following criteria: (i) resting blood oxygen saturation ≤ 93%; (ii) respiratory rate ≥ 30 beats/min; or (iii) oxygen concentration ≤ 300 mmHg. Critical patients should meet one of the following: (i) respiratory failure needing mechanical ventilation; (ii) shock; (iii) organ failure needing ICU management.
Chest CT characteristics: The recorded chest CT imaging features mainly included the following aspects: (i) normal or abnormal CT study and sub-grouping if available into asymptomatic and symptomatic; (ii) patterns of the lesion (GGO, consolidation, GGO mixed consolidation, halo sign, reticular pattern, nodules and shadows, air bronchogram, interlobular septal thickening, crazy paving pattern, bronchiectasis, adjacent pleura thickening, pleural effusion, pericardial effusion, lymphadenopathy); (iii) lesion distribution (bila-teral or unilateral, right or left, peripheral, central or central and peripheral), lobar distribution right upper lobe (RUL), right middle lobe (RML), right lower lobe (RLL), left upper lobe (LUL), or left lower lobe (LLL) and the number of lobes involved. Terms like white lung and high-density shadows or patches were replaced by consolidation.
An additional 17 articles with 26 patients published in the same period including case reports, case series and cases, and cross-sectional studies with number of eligible paediatric cases < 5 were included in a separate descriptive summary analysis.
Quality assessment of the included studies
The methodological quality of the included articles was assessed using the revised tool for the quality assessment of diagnostic accuracy studies (QUADAS-2) [10] by one author and checked by another (M.G & D.SH.). The results were based on consensus discussion.
Statistical analysis
Percentages and means ± standard deviation (SD) were calculated to describe the distributions of categorical and continuous variables, respectively. The meta-analyses were performed using the software OpenMeta (Analyst) [11] and Comprehensive Meta-Analysis ve.3.3® licensed for Universidad Tecnológica de Pereira, Colombia. Pooled prevalences and their 95% confidence intervals (95% CIs) were used to summarize the weighted effect size for each study grouping variable using the binary random-effects model (the weighting took into consideration the sample sizes of the individual studies), except for median age, for which a continuous random-effect model was applied (DerSimonian and Laird procedure) [12]. We performed pooled analysis of sensitivity rates using an open-source free software for meta-analysis of diagnostic and screening tests (Meta-DiSc®, Clinical Biostatistics Unit, Ramón y Cajal Hospital, Madrid, Spain version 1.4).
For CT sensitivity we calculated the sensitivity for each paper according to the equation sensitivity % = [true positive cases (cases with abnormal CT findings)]/[cases with true positive (cases with abnormal CT findings + cases with false negative (normal CT findings)] × 100. The aubgroup analyses were performed for sensitivity of abnormal CT findings between symptomatic and asymptomatic groups.
Statistical heterogeneity between studies was evaluated with Cochran’s Q test and the I2 statistic [13]. The heterogeneity of the study results was evaluated by calculating the I2 statistic. I2 values can vary from 0 to 100%. Percentages of < 25% (I2 = 25), 25-75% (I2 = 50), and > 75% (I2 = 75) were classified as low, medium, and high heterogeneity, respectively. Publication bias was evaluated by constructing a funnel plot and by Egger’s test [14]. For Egger’s test, a p-value < 0.1 was considered statistically significant.
Results
Study selection and characteristics
We retrieved 1190 articles using the search strategy. After removal of duplications, 744 articles were screened by abstract and title, and 80 articles were selected for full-text assessment. Of these, 22 were excluded due to lack of chest CT as primary outcome, 3 were excluded because of language (Chinese), 4 were excluded because of inability to extract data, 4 were excluded due to lack of information on molecular diagnosis, and 2 were excluded as there was risk of duplication of cases published in these papers. Twenty-eight papers were included for qualitative analysis and quantitative meta-analysis (Figure 1). The key chara-c-teristics of the included studies are shown in [15-42] (Table 1). The included 28 studies that were published between 2 March 2020 and 29 April 2020, all of them originated from China, and 987 paediatric patients were reported in total.
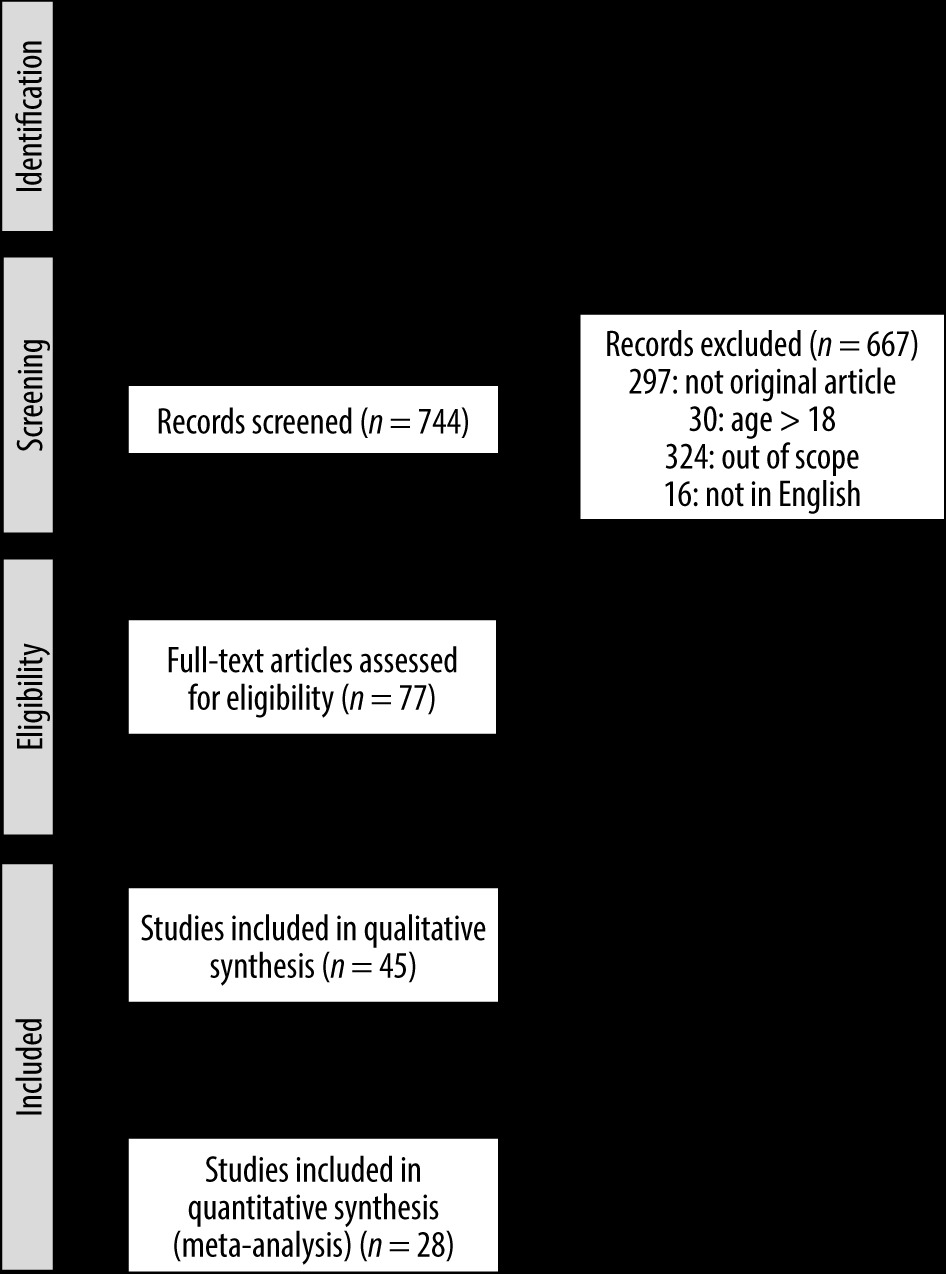
Table 1
Included studies and demographic data of the subjects
| First author; date available online | Time window of the study | Study design | No. of children | Male, n (%) | Age (years) | Average hospital stay (days) | Reference | |
|---|---|---|---|---|---|---|---|---|
| Mean/median | Range | |||||||
| Chen et al.; 2-Mar | 18-Jan/11-Feb | Retrospective | 12 | 6 (50.0) | 14.5 | 9.3-15.8 | NA | [15] |
| Chen et al.; 3-Mar | 11-Jan/12-Feb | Prospective | 31 | 13 (41.9) | 6.75 | 1.5-17.0 | NA | [16] |
| Tang et al.; 10-Mar | 16-Jan/8-Feb | Retrospective | 26 | 9 | 6.9 ± 0.7 | 1.0-3.0 | 13.6 ±1.0 | [17] |
| Li et al.; 11-Mar | 28-Jan/8-Feb | Retrospective | 5 | 4 | 1.1 ± 0.4 | 0.8-6.0 | 10.6 (1.0-14.0) | [18] |
| Xu et al.; 13-Mar | 14-Jan/20-Feb | Prospective | 10 | 6 | 6.6 | 0.2-15.5 | NA | [19] |
| Zheng et al.; 14-Mar | 1-Feb/10-Feb | Retrospective | 25 | 14 | 3 | 3.0-14.0 | NA | [20] |
| Yu et al.; 18-Mar | 1-Feb/10-Feb | Retrospective | 82 | 51 | NA | 0-16.0 | 11.2 | [21] |
| Sun et al.; 19-Mar | 24-Jan/24-Feb | Unclear | 8 | 6 | 5 | 0.2-15.0 | 18.5 | [22] |
| Qiu et al.; 25-Mar | 17-Jan/1-Mar | Retrospective | 36 | 23 | 8.3 ± 3.5 | 1.0-16.0 | 14.0 (10.0-20.0) | [23] |
| Su et al.; 25-Mar | 24-Jan/24-Feb | Retrospective | 9 | 3 | 5.2 | 0.9-9.0 | 14.0-21.0 | [24] |
| Chen et al.; 28-Mar | 1-Feb/10-Mar | Retrospective | 10 | 5 | NA | 2.0-15.0 | 18.0 (2.0-26.0) | [25] |
| Liu et al.; 29-Mar | NA | Unclear | 5 | 4 | 5.2 | 0.9-13.0 | 9.8 | [26] |
| Li et al.; 31-Mar | 26-Jan/20-Feb | Retrospective | 8 | 3 | 2.5 | 1.0-5.0 | NA | [27] |
| Liu et al.; 2-Apr | 7-Jan/13-Jan | Retrospective | 5 | 2 | 3 | 1.0-4.0 | 7.5 | [28] |
| Chen et al.; 6-Apr | 25-Jan/15-Feb | Retrospective | 14 | 8 | 4.7 | 0.2-10.0 | NA | [29] |
| Shen et al.; 7-Apr | 8-Jan/19-Feb | Retrospective | 9 | 3 | 8 | 1.0-12.0 | 15.3 | [30] |
| Zhu et al.; 8-Apr | 24-Jan/22-Feb | Retrospective | 10 | 5 | 9.5 | 1.5-17.0 | NA | [31] |
| Xie et al.; 9-Apr | 5-Feb/30-Mar | Retrospective | 13 | 7 | 16 | 10.0-18.0 | NA | [32] |
| Qiu et al.; 9-Apr | 20-Jan/15-Mar | Retrospective | 25 | 9 | NA | 0-10.0 | 10.8 | [33] |
| Tan et al.; 10-Apr | 27-Jan/10-Mar | Retrospective | 10 | 3 | 8.8 | 1.1-12.1 | NA | [34] |
| Wu et al.; 10-Apr | 20-Jan/27-Feb | Retrospective | 74 | 44 | 6 | 0.1-15.1 | 11.0 (9.0-14.0) | [35] |
| Du et al.; 16-Apr | 23-Jan/15-Feb | Retrospective | 14 | 6 | 6.2 | 0-16.0 | NA | [36] |
| Xia et al.; 16-Apr | 21-Jan/14-Mar | Retrospective | 114 | 69 (60.5) | NA | NA | 13.0 | [37] |
| Hua et al.; 23-Apr | NA/29-Feb | Retrospective | 43 | 26 (60.5) | 8.2 | 0.8-14.0 | NA | [38] |
| Lu et al.; 23-Apr | 28-Jan/26-Feb | Unclear | 171 | 104 (60.8) | 6.7 | 0-15.0 | 20.2 (3.0-32.0) | [39] |
| Song et al.; 24-Apr | 31-Jan/17-Mar | Unclear | 16 | 10 (62.5) | 8.5 | 1.0-14.0 | 15.6 | [40] |
| Lu et al.; 28-Apr | 22-Jan/9-Feb | Retrospective | 9 | 5 (55.6) | 7.8 | 0.2-15.0 | NA | [41] |
| Xiong et al.; 29-Apr | 21-Feb/20-Mar | Retrospective | 193 | 120 (62.2) | 3.6 | 0.2-10.2 | 12.0 (8.0-17.0) | [42] |
Publication bias
Publication bias was assessed with a funnel plot for the standard error by logit event, with no evidence of bias (Table 2). The Egger test (p = 0.801) suggested that there was no notable evidence of publication bias. Quality and applicability charts for included articles are presented in (Supplementary Figure 1).
Table 2
Risk of bias and applicability of included studies
| Study [reference] | Risk of bias | Applicability | |||||
|---|---|---|---|---|---|---|---|
| Patient selection | Index test | Reference standard | Flow and timing | Patient selection | Index test | Reference standard | |
| Chen et al. [15] |  | |  | | | | |
| Chen et al. [16] | | | | | | | |
| Tang et al. [17] | | | | | | | |
| Li et al. [18] | | | | | | | |
| Xu et al. [19] | | | | | | | |
| Zheng et al. [20] | | | | | | | |
| Yu et al. [21] | | | | | | | |
| Sun et al. [22] | | | | | | | |
| Qiu et al. [23] | | | | | | | |
| Su et al. [24] | | | | | | | |
| Chen et al. [25] | | | | | | | |
| Liu et al. [26] | | | | | | | |
| Li et al. [27] | | | | | | | |
| Liu et al. [28] | | | | | | | |
| Chen et al. [29] | | | | | | | |
| Shen et al. [30] | | | | | | | |
| Zhu et al. [31] | | | | | | | |
| Xie et al. [32] | | | | | | | |
| Qiu et al. [33] | | | | | | | |
| Tan et al. [34] | | | | | | | |
| Wu et al. [35] | | | | | | | |
| Du et al. [36] | | | | | | | |
| Xia et al. [37] | | | | | | | |
| Hua et al. [38] | | | | | | | |
| Lu et al. [39] | | | | | | | |
| Song et al. [40] | | | | | | | |
| Lu et al. [41] | | | | | | | |
| Xiong et al. [42] | ? | | | | | | |
Demographical characteristics and comorbidities
The age range of patients across 28 studies was 0-18 years, with male sex representing 55.9% (95% CI: 51.6-59.9.1%) of all patients. Congenital heart disease (CHD) was the most common comorbidity among the reported patients, followed by leukaemia.
Clinical manifestations
Symptomatic children represented the major sector (76.9%; 95% CI: 69.2-84.7%). Among symptomatic children, fever was the most common presentation (64%; 95% CI: 58-71.2%). Cough (58.5%; 95% CI: 50.4-66.6%) was the second most prevalent clinical manifestation followed by sore throat (12.3%), rhinorrhoea (6.8%), sputum (6.8%), dyspnoea and tachypnoea (6%), diarrhoea (6.2%), and nausea and vomiting (5.7%). Other less frequent clinical presentations were fatigue (4.2%), nasal congestion (4.2%), headache (2.4%), myalgia (1.4%), abdominal pain (0.6%), constipation (0.5%), and polyuria (0.5%). As regards clinical severity, common disease (49.3%; 95% CI: 38.7-59.9%) was the most frequent category followed by minimal (19%), then severe (3%), and critical disease (2.3%). Discharge from hospital was the most common outcome (79.9; 95% CI: 69.6-90.2%), and 1 patient (0.8%; 95% CI: 0.2-1.4%) died. Among the patients 20% (95% CI: 9.7-30.3%) were still hospitalized at the time of data publication.
Laboratory findings
Regarding laboratory findings, neutropaenia (28.8%; 95% CI: 13.8-43.7%) was the most prevalent laboratory finding, followed by leucopaenia (17.6%), increased neutrophils (14.6%), lymphopaenia (13.5%), elevated CRP (13.1%), and leukocytosis (12.5%). Leukocytosis (12.5%), lymphocytosis (10.1%), thrombocytosis (5.8%), anaemia (3.2%), and thrombocytopaenia (1.9%) presented but with lower prevalence. Table 3 demonstrates a pooled analysis of the included studies regarding clinical, laboratory, and outcome features.
Table 3
Pooled analysis of included studies regarding clinical, laboratory, and outcome features
Chest computed tomography evaluation
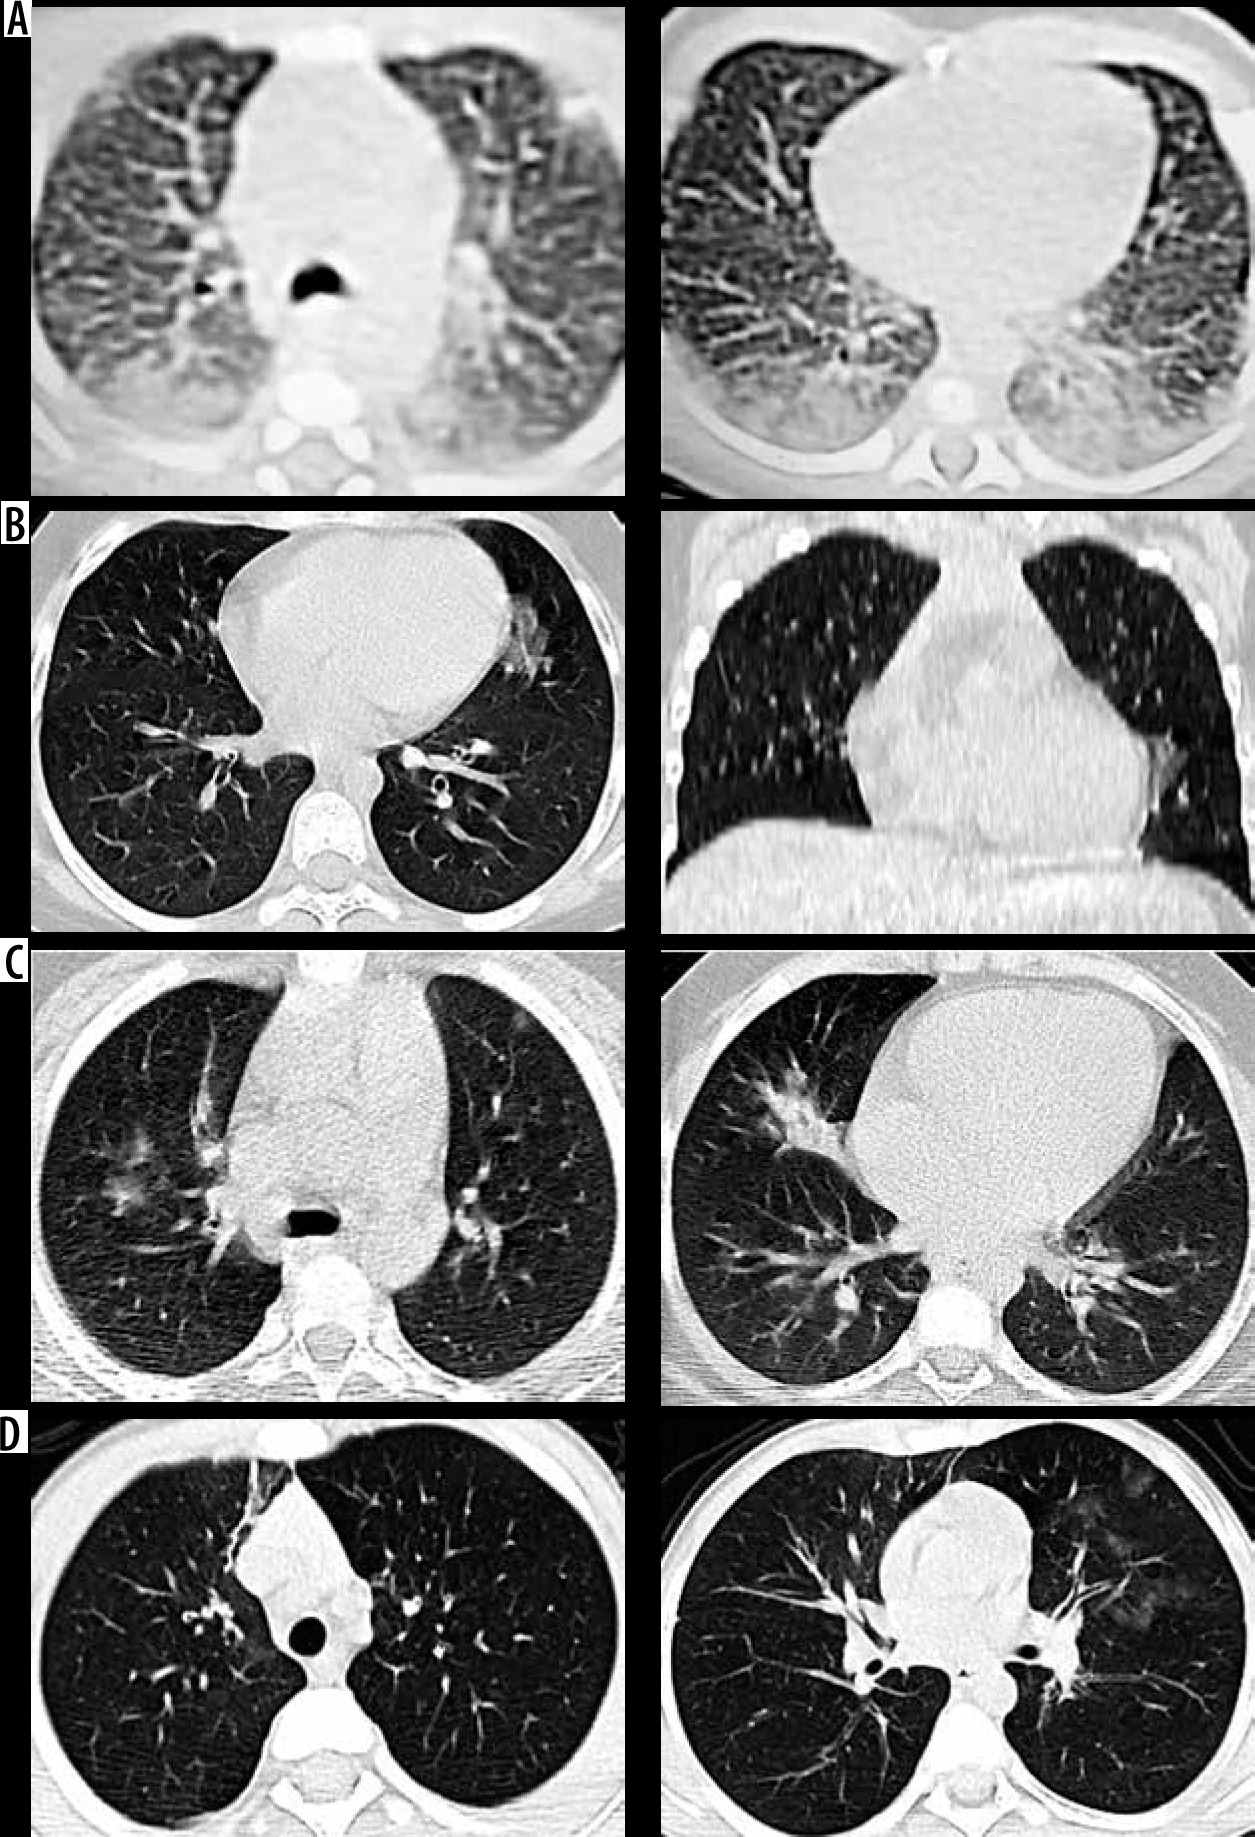
Patients with abnormal CT represented 65.8% (95% CI: 58.1-73.6%) compared to patients with normal CT findings (34.2%; 95% CI: 26.4-41.9%). The characteristics of chest CT findings of the included COVID-19 patients with abnormal CT images are summarized in (Table 4). Although the reported proportion might vary across different studies, GGO (52.5%; 95% CI: 40.5-64.7%) was the most prevalent feature in chest CT. Patches and consolidation were the second and third most common CT findings, with reported rates of about 24.5% (95% CI: 11.5-37.5%) and 11.9% (95% CI: 4.5-19.2%), respectively. Other less common features were nodules (2.8%) interlobular septal thickening (0.7%), reticular pattern (0.7%), GGO mixed with consolidation (0.6%), halo sign (0.6%), pleural effusion (0.6%), air bronchogram (0.6%), and LNs (0.6%), reported in 1 case each. Figure 2 shows demonstrative cases from our institute for children with a COVID-19-positive PCR test.
Table 4
Pooled analysis of included studies regarding radiological findings
Figure 2
A) Axial chest computed tomography (CT) images for a newborn with mother having COVID-19 proven by RT-PCR show peripheral ground glass opacities are noted bilaterally with posterior predominance. B) Axial and coronal chest CT images for 10-year-old girl with COVID-19 proven by RT-PCR show single unilateral centrally located ground glass opacity in the left lung. C) Axial chest CT images for 8-year-old boy with COVID-19 proved by RT-PCR show bilateral central and peripheral ground glass opacities with right middle lobe small consolidation. D) Axial chest CT images for another 8-yearold boy with COVID-19 proved by RT-PCR show right anterior reticular subpleural bands with bilateral ground glass opacities
Unilateral lung lobe (56.8%; 95% CI: 47.6-66.0%) affection was higher than bilateral (42.18%; 95% CI: 33.2-50.9%), and right (32%) was more common than left side (21.5%). RLL affection was the most common lobe affected (49%; 95% CI: 40.1-59.1%) followed by LLL (41.9%; 95% CI: 57.9-4.21%). The least affected lobe was RML (18.1%; 95% CI: 6.2-30.0%). Peripheral lesion distribution (44.1%; 95% CI: 23.8-54.4%) was the common distribution reported. Single lobe affection (51.7%; 95% CI: 35.6-67.9%) was the most common number of lobes affected, followed by 2 lobes (32.4%; 95% CI: 22.8-42.0%). Follow-up imaging was available only in 10 studies, and most of them showed total resolution of initial findings.
Diagnostic test performance
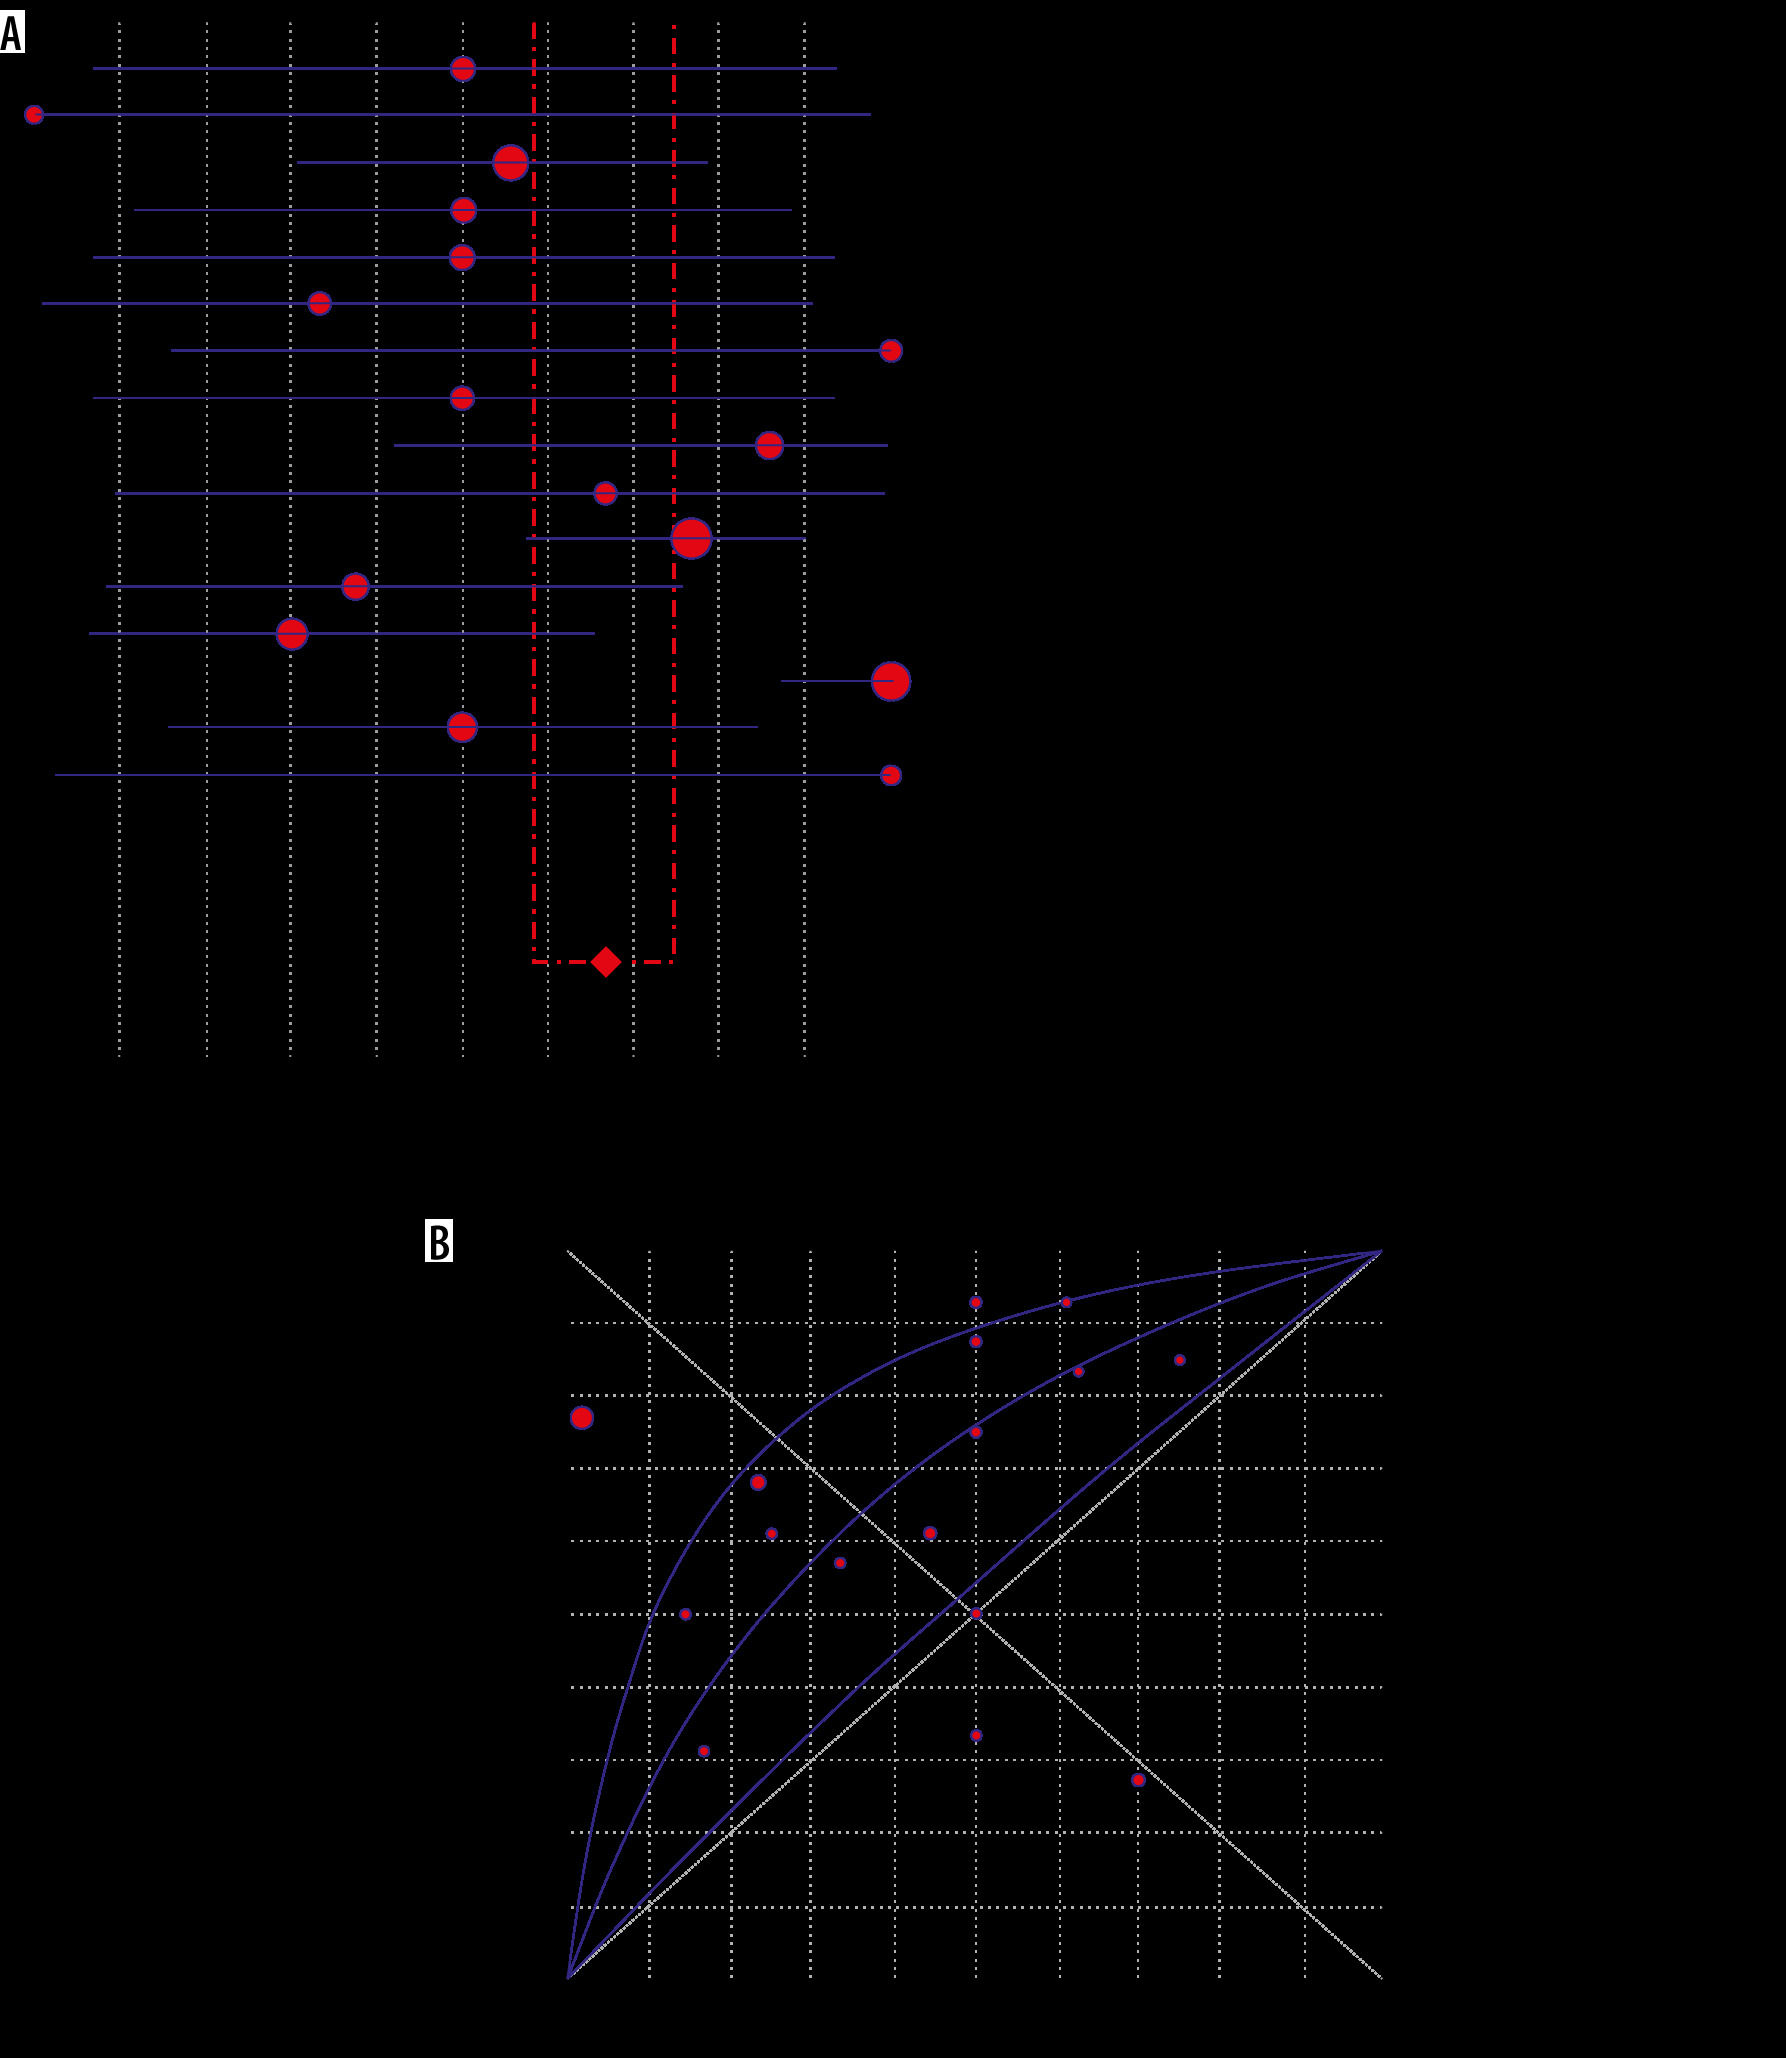
We were able to calculate only the sensitivity of CT in the diagnosis COVID PCR-positive patients. The pooled sensitivity of abnormal CT findings in all COVID patients was 67% (95% CI: 64-70%), but it showed high heterogeneity (I2 = 80.3%, p < 0.0001). However, pooled sensitivities of abnormal CT findings were significantly different in symptomatic patients and asymptomatic patients: 71% (95% CI: 67-74%) and 33% (95% CI: 25-42%) with medium heterogeneity (I2 = 67.9% and 65.2% and p < 0.001 and 0.0002, respectively) (Figure 3). When we considered the symptomatic PCR-positive patients as the gold standard, SROC curves detected a pooled sensitivity of 71%, pooled specificity of 67%, and AUC of 0.6829 in symptomatic patients (Figure 4).
Figure 3
Forest plot shows sensitivity of computed tomography in all patients, symptomatic, and asymptomatic patients, respectively. Red circles indicate sensitivity from selected studies, and size reflects statistical weight. Horizontal lines indicate 95% confidence interval (CI) of each included study. Dashed line represents overall pooled estimate from meta-analysis, and diamond represents 95% CI of overall frequency
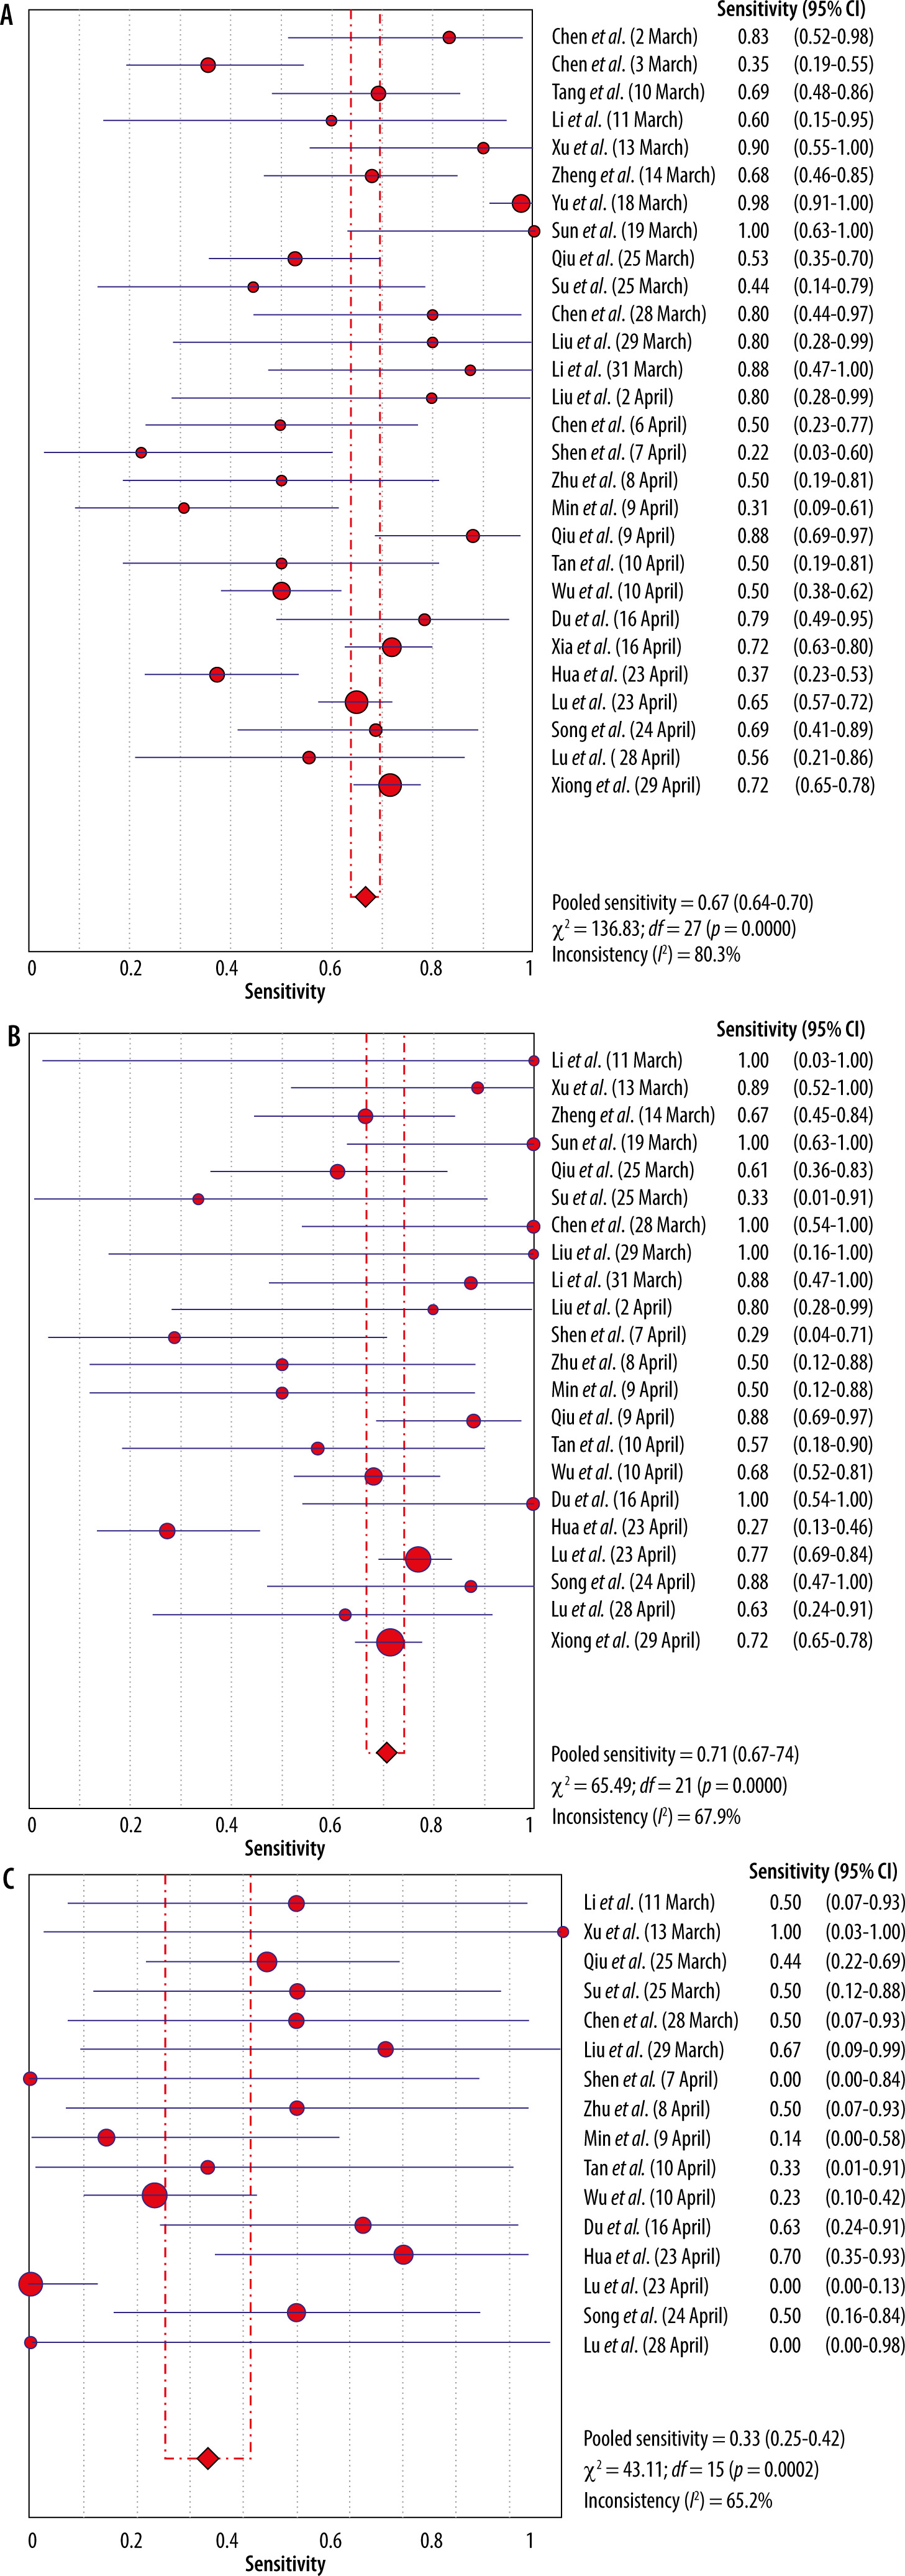
Figure 4
A) Forest plot shows specificity of computed tomography (CT) in symptomatic patients. Red circles indicate specificity from selected studies, and size reflects statistical weight. Horizontal lines indicate 95% confidence interval (CI) of each included study. Dashed line represents overall pooled estimate from meta-analysis, and diamond represents 95% CI of overall frequency. B) Symmetric ROC curves for CT sensitivity and specificity of CT among symptomatic patients. Area under the curve is estimated to be 0.682
The forest plot showing the pooled incidence of GGO, pulmonary patches, and consolidations detected by CT chest among patients from all 28 selected studies, are presented in Supplementary Figure 2, while the forest plots showing the pooled incidence of unilateral and bilateral distribution detected by CT chest are presented in Supplementary Figure 3.
Clinical and radiological data from secondary analysis
An additional 17 articles with 26 patients published from 1st December 2019 until 30th April 2020 including case reports, case series, and cross-sectional studies with the number of eligible paediatric cases < 5 [43-59] were included in a separate descriptive summary analysis. The analysis includes 26 patients and reports originating from china and other countries (United States of America, Korea, Japan, France, and Iran). This analysis provided similar results to our primary meta-analysis in terms of high incidence of GGO among symptomatic patients and single lobe affection, and unilateral and peripheral distribution of the lesions detected by chest CT. Mild course was found in 17 out of 26 patients whereas fever and cough were the most common clinical presentations.
Discussion
The main finding of this meta-analysis is that chest CT in symptomatic paediatric patients showed only mode-rate sensitivity and specificity, and that CT should not be used a screening tool in suspected asymptomatic cases. Secondly, paediatric COVID-19 usually runs a mild course and has a good prognosis with most patients, especially in the absence of comorbidities. The proportion of COVID-19 detected by chest CT scanning among the paediatric population is relatively high, and total resolution of initial findings occurs in most reported follow-up scans. GGO with unilateral single lobe involvement is the most frequent CT characteristic in COVID-19-affected children.
In this study, symptomatic children represented the major sector (76.9%) of the study population. Among symptomatic children, fever was the most common presentation (64.0%) followed by cough (58.5%). Previous studies show that fever was less common in children compared to adults [29,36]. Similarly to adult patients [60], less common presentations in children are upper respiratory tract or gastrointestinal manifestations. Neutropaenia is the commonest laboratory finding among paediatric patients, unlike adult patients, whereas lymphopaenia was reported to be a dependable indicator to categorize the severity of illness [61].
The proportion of COVID-19 detected by chest CT scanning among the paediatric population is still lower than the proportion of COVID-19 detected by chest CT scanning among adults (2386/2738) as reported by a recent meta-analysis of 13 studies [62]. GGO is the most frequent imaging finding in children with COVID-19. Similarly, isolated GGO or mixed with consolidations (44.2%) were the most common lesions found by a systematic review that included 4410 adults with COVID-19 [63]. Other findings such as nodules and inter-lobular septal thickening were not commonly reported in children, in contrast to adult patients with COVID-19 pneumonia [62,63]. Halo sign and reticular pattern have both been reported in paedia-tric patients, although halo sign is more frequent than reticular pattern. Other features, such as pleural effusion and lymphadenopathy, are rare in all ages [29]. We found that lesions detected by CT chest tend to be unilateral; however, in a meta-analysis that included 919 adult patients, bilateral distribution was 87.5% [64]. Single pulmonary lobe involvement is a common feature in paediatric patients, in agreement with Chen et al. [29], who reported higher numbers of involved pulmonary lobes in adults. Regarding distribution, lesions are commonly seen peripheral based with lower lobe predominance, which is similar to the lesion distribution among adults [62,63].
Temporal changes of pulmonary lesions in affected children are poorly described throughout the included studies. In this meta-analysis, only 10 studies reported follow-up imaging data, and most of them showed total resolution of initial findings. A negative CT during the first 2 days after symptom onset with GGO developing 0-4 days after symptom onset and peaking at 6-13 days were reported in adults [65]. Previous reports of coronavirus infections such as severe acute respiratory syndrome (SARS) and Middle East respiratory syndrome (MERS), and data from the COVID-19 pandemic, imply the potential fibrotic sequel of SARS-CoV-2 infection [66]. There are no available reports describing the fibrotic sequel of COVID-19 in children. However, resolution of parenchymal changes is reassuring regarding the unlikelihood of long-term damage.
This meta-analysis showed higher pooled sensitivity and specificity among symptomatic versus asymptomatic patients. Thus, it is unlikely that imaging will confirm the diagnosis or exclude the possibility of infection with high confidence if imaging is normal, CT should not be used a screening tool in suspected asymptomatic cases for the cost of radiation. There is an overlap between the imaging presentation of COVID-19 and other pulmonary conditions such as viral pneumonias, atypical bacterial pneumonia, or hypersensitivity and eosinophilic pneumonias, which can lead to false-positive results [67-69]. In our studies there was a lack of data about the specificity of the CT as regards other pulmonary infections. Bao et al. [62] reported high specificity to distinguished COVID-19 from viral pneumonia on chest CT in adults. However, there are no available similar data to support these findings in children.
These findings are in concordance with the American College of Radiology recommendation, which is against the use of CT as a first-line screening to diagnose COVID-19 and states that chest CT should be reserved for symptomatic hospitalized patients [70]. Furthermore, the International Expert Consensus Statement on Imaging in Paediatric COVID-19 reserved CT to answer a specific clinical question in acute setting or worsening clinical scenarios [71].
The data regarding the role of radiography in the diagnosis of paediatric COVID-19 is scarce. However, available limited data indicates that the sensitivity of chest radiographs in diagnosis of COVID-19 is less than that of CT. Yoon et al. [72] detected parenchymal abnormalities in 3 out of 9 patients (33.3%) by chest radiography, while all 9 patients showed abnormalities in chest CT. Nevertheless, chest radiographs are essential in the paediatric population because of the higher probability of radiation sensitivity in children.
The potential for increased radiation exposure to a paediatric population is one of drawbacks of using CT for screening [73]. Balancing the need for effective imaging while minimizing the radiation dose is pivotal for the management of COVID-19 children. Low-dose CT demonstrated sensitivity, specificity, positive predictive value, negative predictive value, and accuracy of about 90% in the diagnosis of COVID-19 in patients aged 62 ± 18 years [74]. Throughout the selected studies, data related to radiation dose of CT examination in children was sparse. Bearing in mind that the pulmonary findings may persist, it does not necessarily imply ongoing infection, clinically not indicated or routine follow-up CT should not be performed, to avoid higher risk of radiation.
The major drawback of the included studies is that none of them described multisystem inflammation in children (MIS-C). MIS-C is a new syndrome associated with coronavirus disease (COVID-19) and it was initially reported in Italy, the United Kingdom, France, and the United States [75-79]. MIS-C typically presents with multiorgan injury, predominantly involving the cardiovascular system. Chest radiographs typically show cardiomegaly, pulmonary oedema, and pleural effusions, in keeping with acute left-sided heart failure. Cardiac MRI typically displays diffuse T2 hyper-intensity of the left ventricular myocardium secondary to myocardial oedema and hyperaemia with absence of late gadolinium enhancement [78], contrary to COVID-19–related myocarditis in adults, which is typically presented by extensive transmural late gadolinium enhancement, reflecting extensive necrosis and/or fibrosis. The most frequent abdominal imaging signs in MIS-C are ascites, hepatomegaly, and echogenic kidneys. Pulmonary manifestations are distinctly uncommon with MIS-C [79].
This study has some limitations. The included studies lacked standardized reporting of the imaging features of COVID-19 and the severity index of CT scans, as reported in adults. The radiological society of North America expert consensus [80] proposed 4 categories (typical, indeterminate, atypical, and negative) to report chest CT findings of COVID-19 in adults; however, no similar reporting system was dedicated to categorizing COVID-19 in the paediatric population. Second, there was significant heterogeneity in radiographic terms and use of non-standard terminologies in the included studies. Additionally, all the studies included in this meta-analysis originated from China, which suggests the possibility of overlapping cohorts. Nevertheless, all selected papers were of low risk of bias, and we included a secondary analysis for case reports and series that were published in the same period from other countries (United States of America, Korea, Japan, France, and Iran), which revealed similar results to the primary analysis. Lastly, several manuscripts from the last few months were not included in analysis; however, we tried to provide the most up-to-date data from the current literature in the discussion section.
There are still multiple areas of research interest regarding the imaging of COVID-19 in children, which should be investigated, such as a correlation between imaging features and clinical severity, accuracy of low-dose radiation protocols in diagnosis of COVID-19, and comparing it to conventional radiographs in the paediatric population, and the role of CT in long-term follow-up and detection of fibrotic sequel if present.
Conclusions
Chest CT showed moderate sensitivity and specificity among symptomatic patients. This means that CT should not be used a screening tool in suspected asymptomatic cases for several reasons: to avoid exposure to ionizing radiation, unnecessary contamination of CT rooms, and exposure of staff and other patients to COVID-19. Additionally, the findings on CT are not expected to change the management of these patients because the significance of finding GGO in a PCR-positive child is doubtful. Children diagnosed with COVID-19 have an overall excellent prognosis. Chest imaging findings in children with COVID-19 are usually mild, with unilateral changes and ground-glass opacity being the most encountered finding.
What chest CT can add to the management and follow-up of symptomatic children is still controversial and needs further studies; however, there are clinical situations that demand CT in children diagnosed with COVID-19. CT examinations should be reserved for complicated admitted patients to evaluate for COVID-19-related complications such as pulmonary embolism, and not to evaluate the lung disease, because this can be evaluated with chest radiographs. In some patients it is important to detect COVID-19 infection with high accuracy; for example, in a cancer patient prior to chemotherapy or prior to bone marrow transplant. In such cases, CT may be justified as a problem-solving tool.