Introduction
Infectious diseases may cause a severe systemic inflammatory reaction, which can lead to sepsis or septic shock [1]. Sepsis has become a serious threat to humans, with 30 million cases per year and a total mortality rate of 17% [2]. A timely and accurate diagnosis, followed by prompt and appropriate treatment of sepsis, is vital for reducing its mortality [3]. To date, commonly adopted clinical parameters such as clinical manifestations, complete blood count (CBC), C-reactive protein (CRP) and procalcitonin (PCT) are still not so accurate for a timely diagnosis of severe infection. An increased leukocyte count and CRP level are less sensitive and specific in identifying systemic inflammatory responses caused by infection or non-infective conditions [4, 5]. Procalcitonin has a sensitivity of 77% and a specificity of 79% for the diagnosis of bacterial infection [6]. About 40% of patients with sepsis had negative results for the culture of microorganisms [7]. Therefore, other parameters should be sought for making a timely and accurate diagnosis of severe infections.
The hematocrit (HCT) and plasma albumin (ALB) levels in healthy people are stable in normal conditions, with a range of 40–45% for the HCT level [8] and of 35–45 g/l for the ALB level [9]. In clinical practice, the alterations of HCT and ALB levels are changed significantly in the systemic capillary leak syndrome [10] due to the systemic inflammatory reaction [11, 12]. Recently, we found that the HCT minus ALB level (HCT-ALB) > 12.65 could be used as a potential biomarker to discriminate preeclampsia and eclampsia in patients with hypertensive disorders of pregnancy, with a sensitivity > 58.1% and a specificity > 98.9% [13]. The mechanism of capillary leakage in preeclampsia and eclampsia is similar to that for sepsis [13–15], which was mainly dependent on excessive permeation of plasma out of the capillary. We hypothesized that the HCT-ALB values could also be used as a potential biomarker for severe infections. In this study, we compared the differences of HCT-ALB among patients with severe infections, non-infective conditions (patients with non-infectious diseases) and healthy individuals (these subjects had no reported infections or chronic diseases according to the physical examination tests), to test this hypothesis.
Material and methods
Subjects and collection of data
The current study was a retrospective case-control study that was conducted between January 2012 and August 2018. Clinical data for patients with severe infections and healthy individuals were collected during January 2012 to August 2016, and data for patients with non-infectious diseases were collected during September 2016 to January 2018 because we wanted to collect more control samples. All these subjects were recruited at the First Affiliated Hospital of Kunming Medical University. We used the same methods and/or equipment for analyzing blood markers during the data collection. The information collected for each subject included age, sex, body mass index (BMI), routine blood test (including HCT, ALB, globulin and microbial culture at the time of hospitalization), as well as the diagnosis on admission and discharge. Patients were classified as infected or non-infected based on the judgments of the investigators using the medical records, which included disease history, clinical manifestations, blood routine examination and site of bacterial infection. We followed the diagnostic criterion for severe sepsis or septic shock in the report of the 2016 International Conference on Sepsis Definition [1]. The clinical data of patients with cancer were obtained before the surgical operations or chemotherapy. In addition, 141 patients were recruited at the emergency department between March 2018 and June 2018 and were tested as a prospective study to verify our findings.
Exclusion criteria: We excluded all patients who were under the age of 18. Patients who had blood diseases, autoimmune diseases, cirrhosis, nephrotic syndrome, congenital heart disease, chronic obstructive pulmonary disease and sleep apnea syndrome were also excluded, as the HCT or ALB levels in these patients were likely to be affected by many factors due to specific mechanisms of these diseases.
Inclusion criteria: All patients were adults. For the infected patient group (group 1), patients were selected based on the clinical diagnosis and positive culture results (including bacteria and fungi investigations [16] in blood, sputum, midstream urine, pleural effusion and secretions). For the non-infected patient group (group 2), patients were selected based on the review of medical notes and laboratory results by an investigator who found no evidence of infectious cause and the most likely diagnosis fell into ICD-10 non-communicable disease category. The control group (group 3) was composed of subjects who attended hospital for routine physical examination. Individuals showing evidence of infection or chronic disease based on the medical records and laboratory results were excluded from this group.
To further discern whether the HCT-ALB levels showed any differences among patients with different types of disease, we classified the patients in group 1 using four strategies: (1) main sites of infection, including abdominal infection, central nervous system infection, urinary system infection, hepatobiliary system infection and pulmonary infection; (2) severity of disease, including septic shock and sepsis; (3) humoral infection by bacteria, including blood, drainage fluid, sputum, midstream urine, secretions and pleural effusion (98 patients (9.5% of all patients) had multiple humoral infections); (4) microbial infection type, including Gram-positive bacterial infection, gram-negative bacterial infection, drug-resistant bacterial infection and fungal infection (321 patients (31.1% of all patients) had multiple microbial infection).
This study was approved by the ethics committee of the First Affiliated Hospital of Kunming Medical University (approval number: 2018-L-32). Informed consent was waived in view of the retrospective and non-interventional nature of this study.
Statistical analysis
The values of hemoglobin, HCT, ALB, globulin and HCT-ALB were presented as the mean ± SEM. The difference between two groups was compared using Student’s t-test, whereas differences between three or more groups were evaluated by one-way analysis of variance (ANOVA). Differences between the mean of HCT-ALB levels of each group, after being adjusted by age and body mass index (BMI), were computed by using covariance analysis. The receiver operating characteristic (ROC) curves of HCT-ALB of group 1 and group 2 were prepared using group 3 as the reference. The diagnostic value of HCT-ALB was assessed using sensitivity, specificity, positive (PPV) and negative predictive values (NPV), the area under the receiver operating characteristic curve (AUC) and Youden’s index (Youden’s index equals percent sensitivity plus percent specificity-100%). All statistical analyses were performed using SPSS (Ver. 21.0). A p-value < 0.05 was regarded as statistically significant.
Results
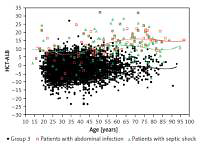
Group 1 included a total of 1,033 patients with infection and a positive etiology, proven by culture (including bacteria and fungi culture in blood, sputum, midstream urine, pleural effusion and secretion). Group 2 included 1,081 patients with non-infective conditions. This group contained 655 patients with cancer (lung cancer, bowel cancer, liver cancer, stomach cancer, pancreatic cancer, ovarian cancer, or uterine cancer), 256 patients with cardiovascular diseases (arrhythmia, myocardial infarction, cardiomyopathy, hypertension, coronary heart disease, mitral stenosis and aortic dissection), 59 patients with pulmonary diseases (pulmonary interstitial fibrosis, bronchitis and asthma) and 111 patients with other non-infective diseases (type 2 diabetes, varicose veins and deep venous thrombosis). The mean ages of patients in group 1 and group 2 were similar, whereas group 3 (n = 5,003) had a much younger age (Table I). The HCT and ALB levels in group 1 were significantly lower than in group 2 or group 3 (p < 1.00 × 10⁻⁴) (Table I). A significantly higher HCT-ALB level was observed in group 1 (8.3 ±7.2) than in both group 2 and group 3 (p < 1.00 × 10⁻⁴) using covariance analysis adjusted by age and BMI (Table I, Figure 1), and this was caused by the substantially reduced level of ALB in the patients of group 1 (Table I).
Figure 1
Distribution of HCT-ALB levels difference in three groups of patients. Group 1 – patients with infections; group 2 – patients with non-infective conditions; group 3 – healthy individuals from the general population. P-value was calculated using one-way ANOVA
The mean values and standard deviations (SD) are shown in the figure.
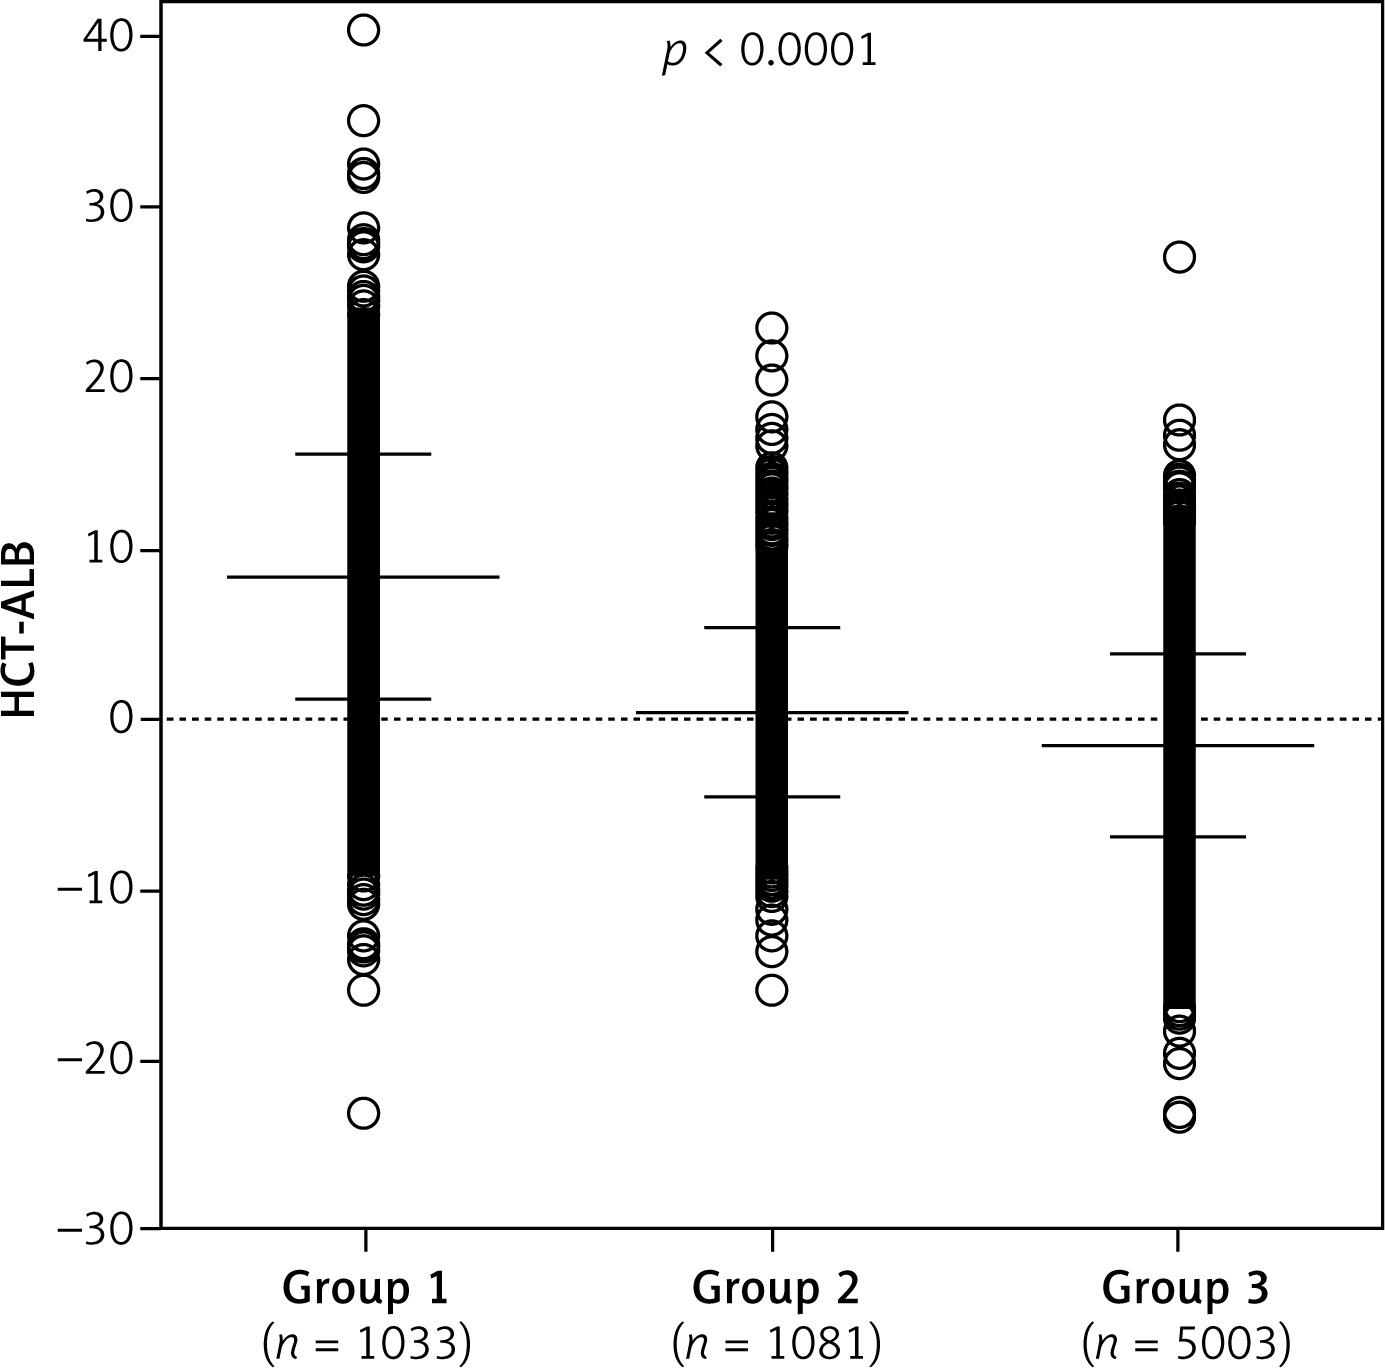
Table I
Clinical information of subjects in the three groups
| Parameter | Group 1 | Group 2 | Group 3 | Pa,* | Pb,* | Pc,* |
|---|---|---|---|---|---|---|
| No. of individuals | 1,033 | 1,081 | 5,003 | |||
| Age, mean ± SD (min.–max.) [year] | 54.7 ±17.6 (18–97) | 56.9 ±13.2 (18–91) | 37.8 ±12.2 (18–93) | 0.009 | < 1.00 × 10⁻⁴ | < 1.00 × 10⁻⁴ |
| Female/male | 360/673 | 474/607 | 2306/2697 | < 1.00 × 10⁻⁴ | 0.189 | < 1.00 × 10⁻⁴ |
| BMI, mean ± SD (min.–max.) [kg/m2] | 22.6 ±3.8 (13.3–40.2) | 22.6 ±3.3 (11.9–35.9) | 23.2 ±3.2 (14.3–50.1) | 0.701 | < 1.00 × 10⁻⁴ | < 1.00 × 10⁻⁴ |
| HCT, mean ± SD (min.–max.) (%) | 36.5 ±6.9 (15.6–64.0) | 41.8 ±5.2 (17.0–58.1) | 46.2 ±4.4 (25.9–62.6) | < 1.00 × 10⁻⁴ | < 1.00 × 10⁻⁴ | < 1.00 × 10⁻⁴ |
| ALB, mean ± SD (min.–max.) [g/l] | 28.2 ±6.8 (10.7–49.0) | 41.4 ±4.6 (18.1–52.6) | 47.8 ±4.3 (21.0–73.0) | < 1.00 × 10⁻⁴ | < 1.00 × 10⁻⁴ | < 1.00 × 10⁻⁴ |
| HCT-ALB, mean ± SD (min.–max.) | 8.3 ±7.2 (–23.1–40.2) | 0.4 ±4.9 (–15.9–22.8) | −1.5 ±5.3 (–23.4–27.0) | < 1.00 × 10⁻⁴# | < 1.00 × 10⁻⁴# | < 1.00 × 10⁻⁴# |
We took group 3 as the reference to draw the ROC curves of HCT-ALB level for group 1 and group 2. Group 1 had a higher AUC value (0.87, 95% CI: 0.86–0.89) than that of group 2 (0.60, 95% CI: 0.58–0.62) (Figure 2), suggesting that HCT-ALB level might be of potential auxiliary diagnostic value for infections but not for non-infective conditions. By calculating Youden’s index, we obtained a cut-point value of HCT-ALB level for group 1 of 4.75 with sensitivity of 73.3% (95% CI: 70.5–75.9%), specificity of 87.8% (95% CI: 86.8–88.7%), PPV of 55.4% (95% CI: 52.6–57.9%), and NPV of 94.1% (95% CI: 93.4–94.7%). To reach a higher specificity of 99.0% (95% CI: 98.8–99.3%), we recommended the HCT-ALB value of 10.25 (at a cost of sensitivity: 37.5% (95% CI: 34.5–40.5%), PPV: 89.6% (95% CI: 86.2–92.2%), and NPV: 88.5% (95% CI: 87.6–89.3%)) as the standard for diagnosis of severe infections (Figure 2). The clinical use of this HCT-ALB value could be proved in a subsequent test of 141 patients from the emergency department (Table II): patients with a HCT-ALB value larger than 10.25 were highly likely (7/10) to be diagnosed with severe infections. In order to avoid the potential differences between HCT and ALB caused by gender that would result in inaccuracy of diagnosis, we compared the difference between women in group 1 and those in group 3, and men in group 1 and those in group 3. The results showed that the prediction of the difference was not affected by gender (Figure 3).
Figure 2
ROC curves of the observed HCT-ALB levels difference in patients with infections (group 1) and non-infective conditions (group 2). A healthy sample (group 3) was used as the reference
Se – sensitivity, Sp – specificity, PPV – positive predictive value, NPV – negative predictive value, AUC – area under the receiver operating characteristic curve, 95% CI – 95% confidence interval.
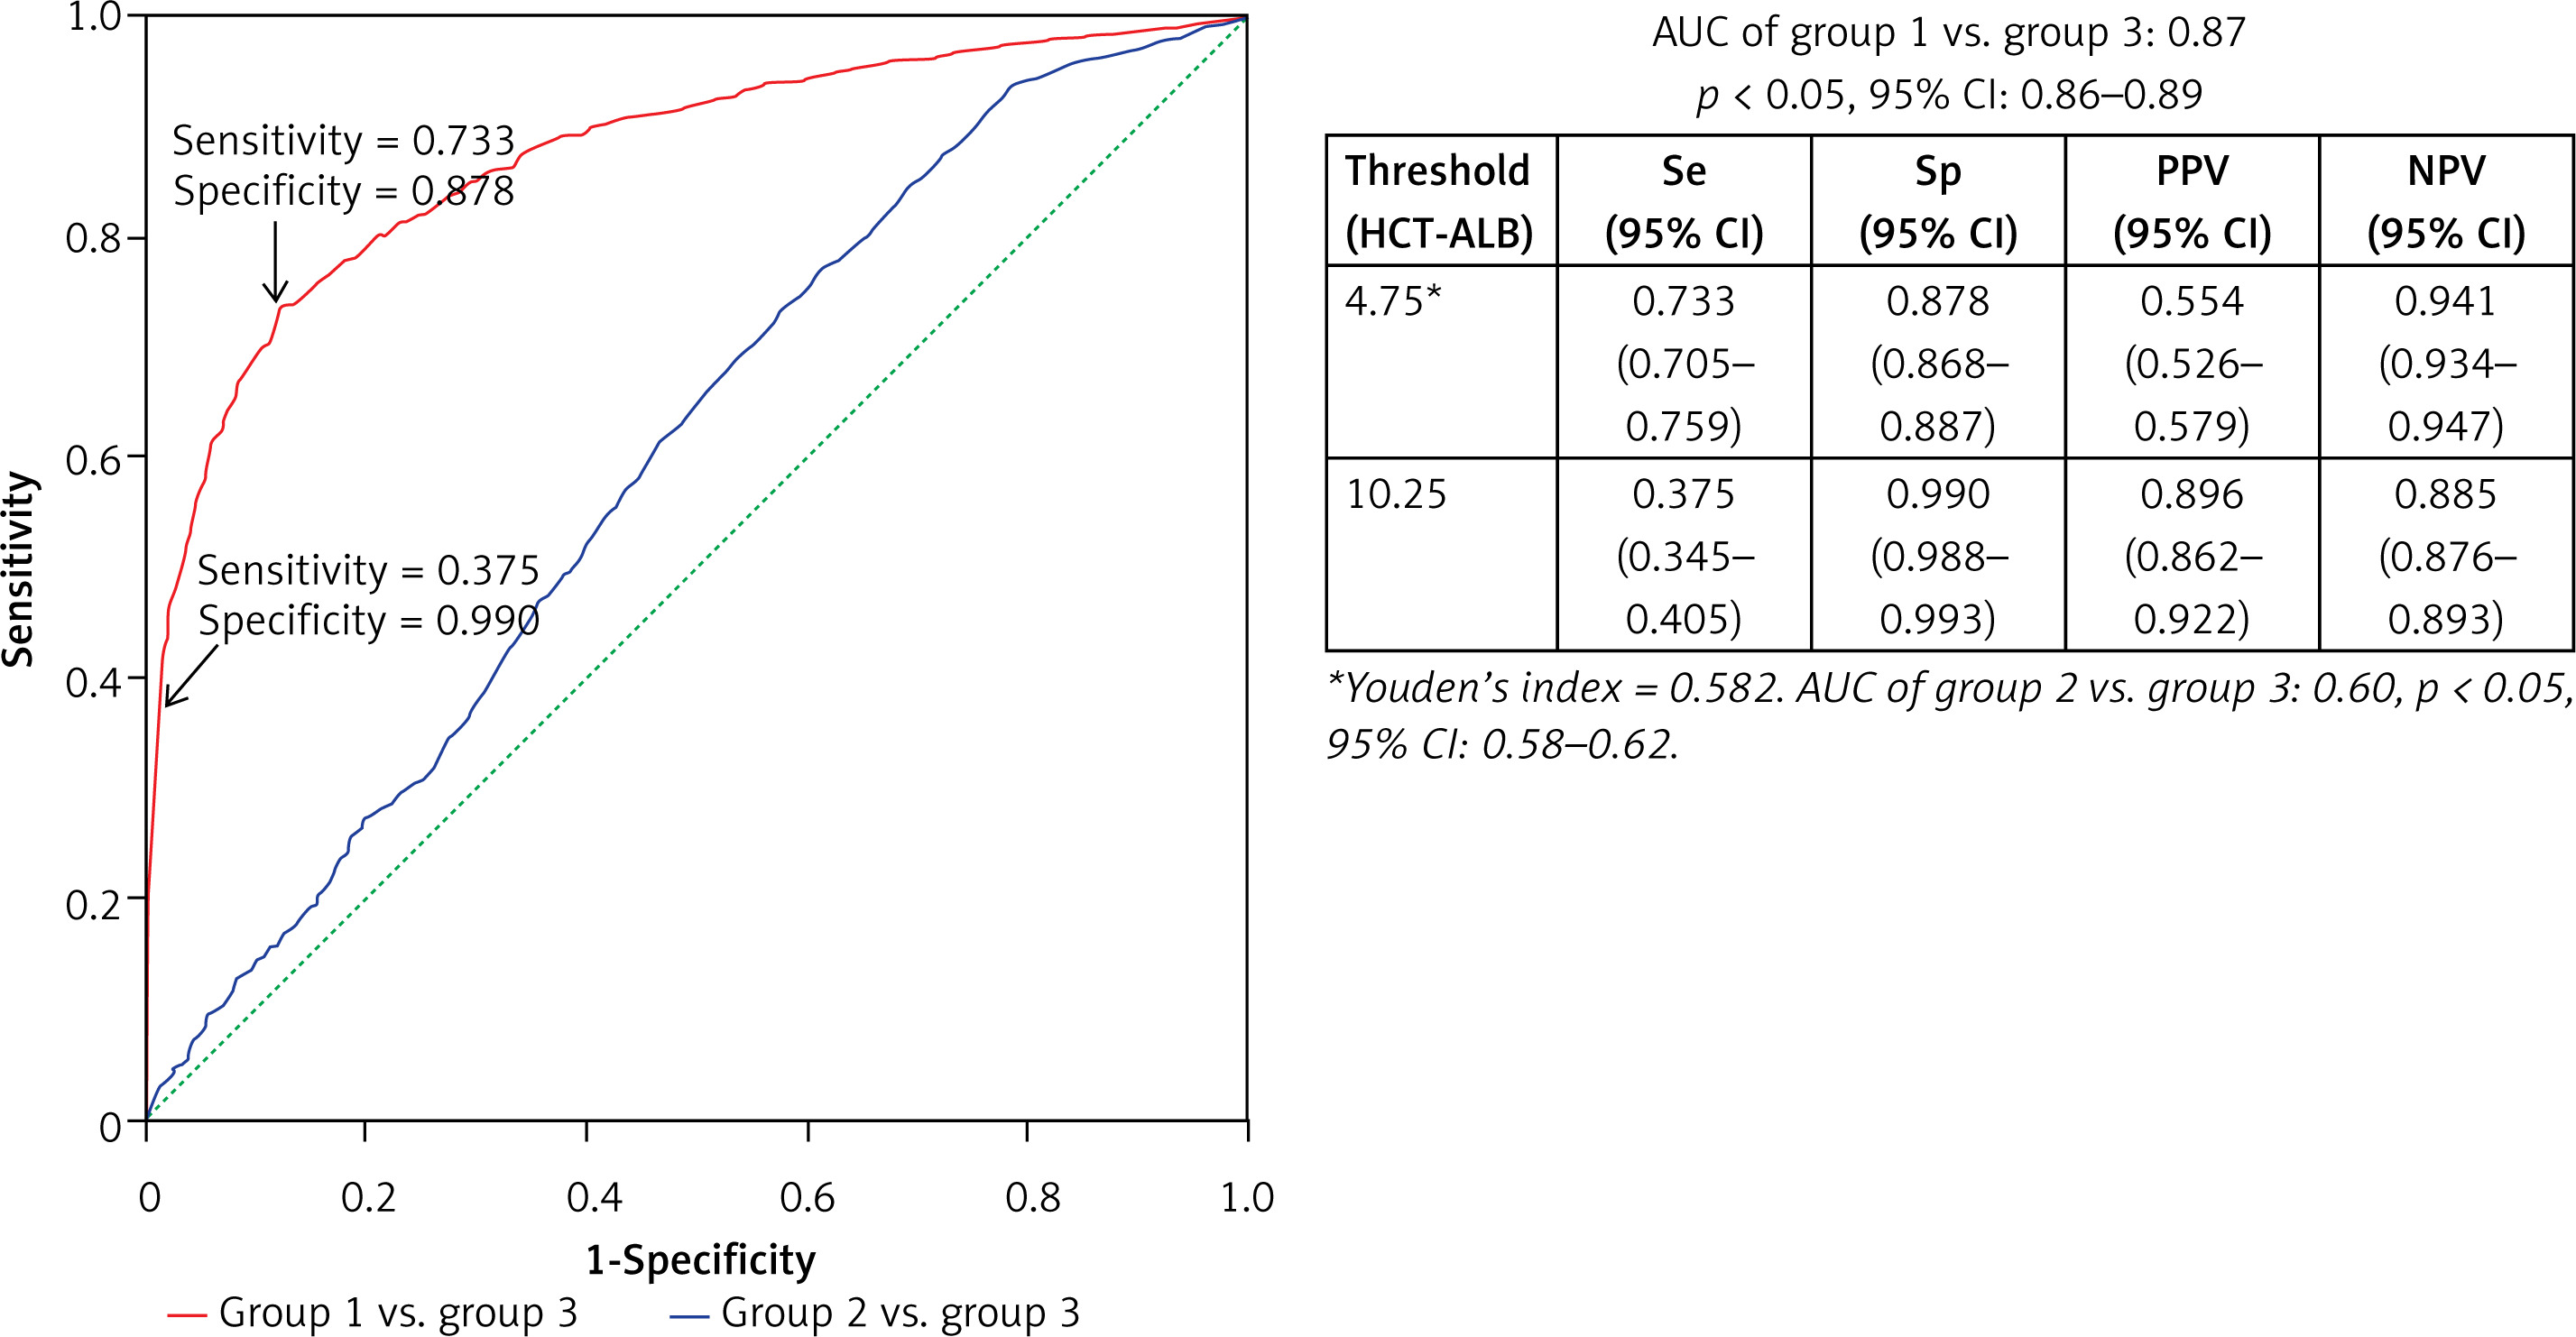
Figure 3
Distribution of HCT-ALB level difference in females and males of group 1 and group 3. Group 1 – patients with infections; group 3 – healthy individuals from the general populations. The P-value was calculated using Student’s t test
The mean values and SD are shown in the figure.
Table II
Prospective study of 141 patients using the HCT-ALB predictor
| HCT-ALB level | Infection | 141 patients in emergency department with final diagnosis | |
|---|---|---|---|
| No. of septic shock cases | No. of non-infectious disease cases | ||
| > 10.25 | Highly likely | 7 | 1 |
| 4.75–10.25 | Likely | 1 | 16 |
| < 4.75 | Unlikely | 2 | 114 |
The pathogen distribution information in group 1 is listed in Table III. We found that the patients with abdominal infection (11.3 ±6.7), septic shock (12.2 ±7.5) and pleural effusion (positive bacterial culture; 12.8 ±7.1) had a higher HCT-ALB level than the other categories, with a range of values of 5.2 to 9.9 (Table IV). Note that the HCT levels in patients with abdominal infection and non-abdominal infection were not significantly different (p = 0.990), but patients with abdominal infection had a much lower level of ALB than that of patients with non-abdominal infection (p < 1.00 × 10⁻⁴). A similar pattern was observed in patients with septic shock (ALB level, 23.3 ±5.8 g/l) and non-septic shock (29.0 ±6.6 g/l) (Table V, Figure 4). Both the HCT and ALB levels were changed in patients with pleural effusion (bacterial positive) compared with the bacterial negative culture group (p = 0.026 and p = 0.002, respectively) (Table V). There was no significant difference of the HCT-ALB level among patients with different types of microbial infections (one-way ANOVA, p = 0.088; Table IV).
Figure 4
Distribution of HCT-ALB level difference in patients with abdominal infection or septic shock and healthy individuals (group 3). The lines on the figure refer to fit curves for patients with abdominal infection (red), patients with septic shock (green) and healthy controls (black)
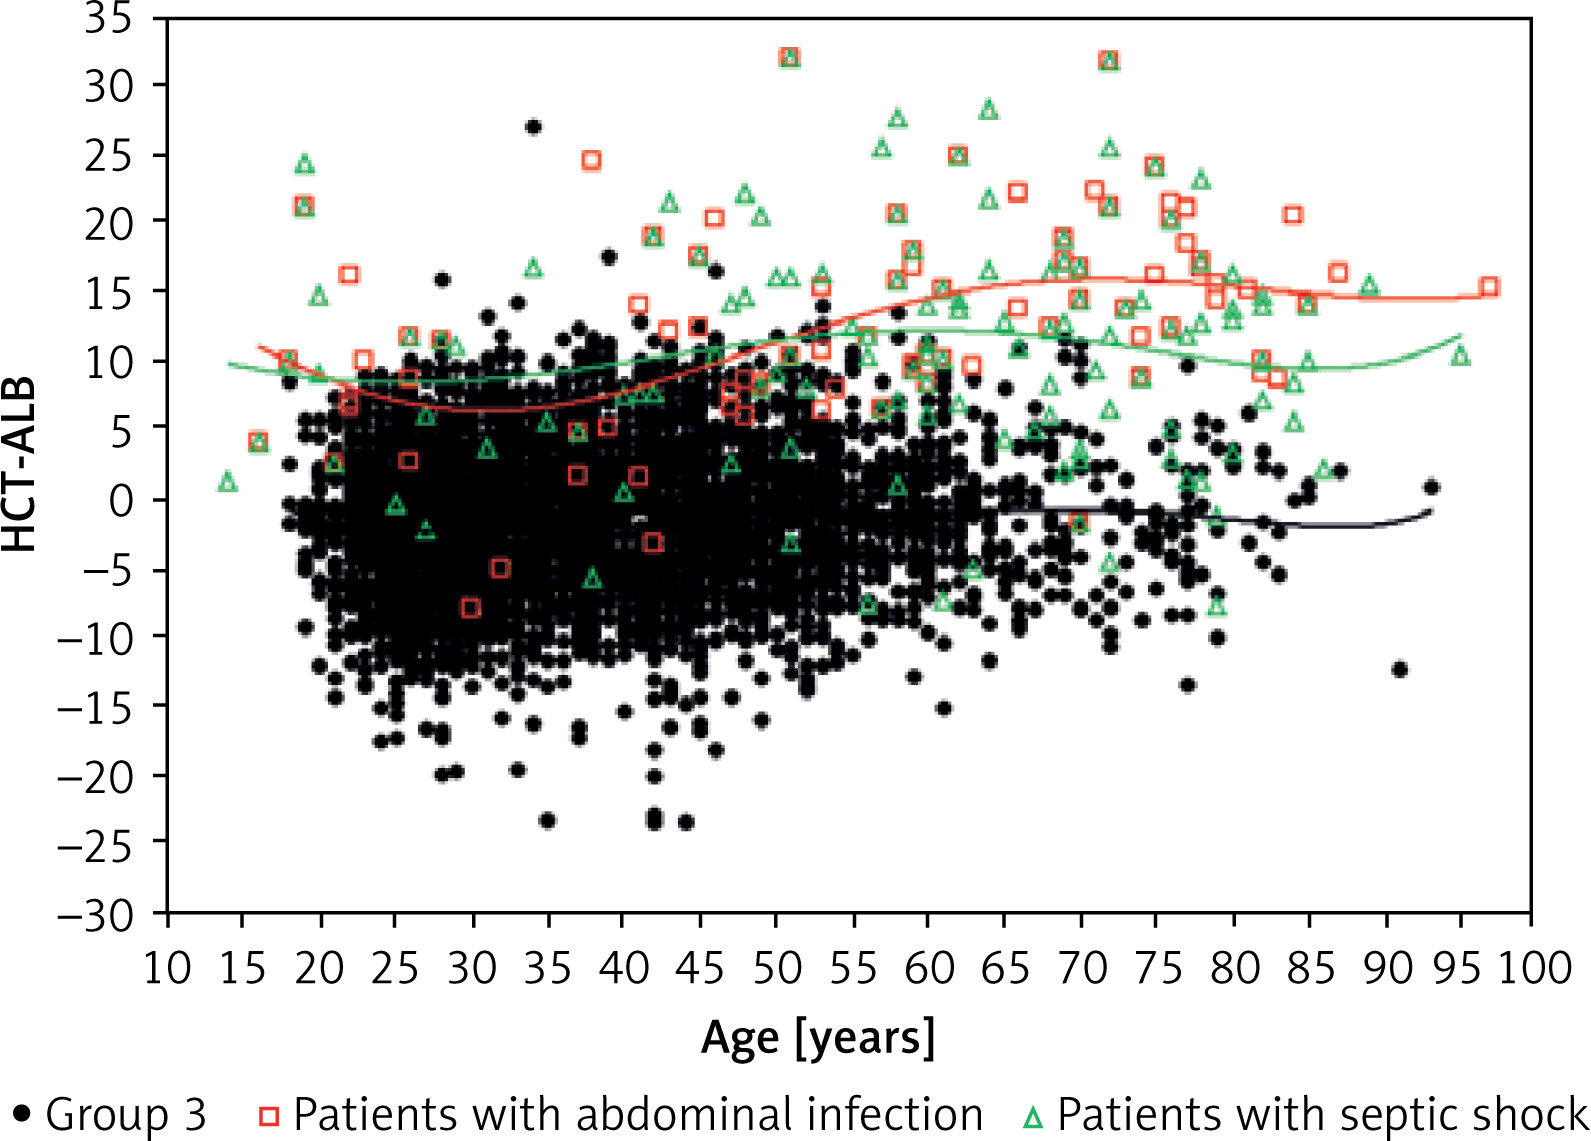
Table III
Pathogen distribution of humoral specimens in group 1
Table IV
Distribution of HCT-ALB levels in patients with different clinical manifestations
Table V
Comparisons of HCT, ALB and HCT-ALB levels in patients with the highest HCT-ALB relative to patients without the same clinical manifestation under study
| Patients | No. of Individuals | HCT (%) | ALB [g/l] | HCT-ALB |
|---|---|---|---|---|
| Abdominal infection (including acute diffuse peritonitis, patients with ascites positive bacterial culture) | 212 | 36.5 ±6.2 | 25.3 ±5.8 | 11.3 ±6.7 |
| Non-abdominal infection (patients in group 1 without abdominal infection) | 821 | 36.5 ±7.1 | 28.9 ±6.8 | 7.6 ±7.2 |
| P-value* | 0.990 | < 1.00 × 10⁻⁴ | < 1.00 × 10⁻⁴ | |
| Septic shock | 148 | 35.5 ±7.1 | 23.3 ±5.8 | 12.2 ±7.5 |
| Non-septic shock (patients without septic shock) | 885 | 36.7 ±6.8 | 29.0 ±6.6 | 7.7 ±7.0 |
| P-value* | 0.042 | < 1.00 × 10⁻⁴ | < 1.00 × 10⁻⁴ | |
| Pleural effusion infected (positive bacterial culture) | 65 | 38.4 ±7.5 | 25.6 ±6.2 | 12.8 ±7.1 |
| Pleural effusion non-infected (negative bacterial culture) | 968 | 36.4 ±6.8 | 28.4 ±6.8 | 8.0 ±7.1 |
| P-value* | 0.026 | 0.002 | < 1.00 × 10⁻⁴ |
Discussion
There are many efforts aiming to identify a useful marker for quick diagnosis, treatment and follow-up in the cases of severe infections and other diseases in clinical practice [2, 4, 6, 13, 16–20]. In this study, we examined the possibility of using HCT-ALB as a marker to aid in the diagnosis of severe infections. We compared patients with infection with healthy subjects or with patients with non-infective illness. We found that a HCT-ALB value of 4.75 gave a sensitivity of 70.4% and a specificity of 87.8% and a HCT-ALB value of 10.25 gave a higher specificity of 99.0%, with sensitivity of 37.5% for diagnosing severe infection in our study subjects (Figure 2). To our knowledge, this is the first study to show HCT-ALB as a viable marker for severe infections.
The HCT is the percentage of red blood cells in whole blood and has been shown to be affected by many factors [11, 12, 21]. For instance, altitude affects the erythrocyte hematocrit reference value as a response to hypoxia and this leads to an increased HCT value. A previous study showed that the normal reference range value of HCT in Han Chinese from Southwest China (living in the Yunnan-Guizhou Plateau region; male: 42.6% to 50.6%; women: 38.7% to 45.5%) was slightly higher than that of people living at low altitude (male: 39.9% to 49.9%; women: 36.5% to 44.5%) [21]. The HCT level of healthy control individuals in this study had a value within the range of the above reference value (46.2 ±4.4%; Table I), and therefore could be used as a good reference for comparison. It should be mentioned that gender had a minimum effect on the prediction of the HCT-ALB levels in this study (Figure 3).
The red blood cells undergo morphological changes in response to environmental stress and can penetrate smaller capillaries. In a normal situation, the gap between endothelial cells of capillaries is 6–7 nm [22], and red blood cells cannot permeate the gap, which results in a steady HCT level. ALB has a molecular weight of 69 kDa and the normal plasma concentration is 35–45 g/l [9]. In health, the rates of synthesis and decomposition of ALB are approximately equal and maintain a constant plasma colloid osmotic pressure. The capillary escape rate of ALB in the circulatory system has been shown to be 5–7% per hour, of which 90% of the ALB was recycled through the lymphatic system [9]. In the presence of sepsis, the capillary escape rate of ALB in the circulatory system accelerates, and can reach a value up to 300% per hour [9, 14, 15]. Critically ill patients with sepsis and systemic inflammatory response syndrome, due to increased permeability of systemic capillaries and ALB leakage, will develop hypoproteinemia. In some patients, such as in those with liver cirrhosis and malnutrition, the synthesis of ALB was impaired, and this also led to hypoalbuminemia [9]. For this reason, we excluded patients with cirrhosis from the study. In the presence of pathogenic microorganisms, endotoxins, cytokines, oxygen free radicals, and other related factors, the glycocalyx in the surface of vascular endothelial cells was exfoliated and the close junction between vascular endothelial cells was impaired, leading to increased vascular endothelial permeability [11, 23–30]. The imbalance between albumin leakage and recycling, together with the dysfunction of metabolism, finally causes hypoalbuminemia and the change of the osmotic pressure around the blood vessel. All these events related to vascular permeability and impaired metabolism contribute to the changes in HCT and ALB levels.
In cases of sepsis, such as from a serious lung infection, the vascular endothelial cells have been shown to undergo pathophysiological changes and have increased systemic vascular permeability, which finally leads to pulmonary edema and septic shock [31]. If the infection occurred in a local area, there would be no systemic inflammatory response syndrome and no massive vascular permeability, so the HCT-ALB level should be within the normal range. However, sepsis is a systemic inflammatory response to the invading pathogens and severe sepsis can cause multiple organ dysfunction syndrome [32, 33]. In the case of septic shock, hypotension resulted in low perfusion of tissues and organs, and the systemic inflammatory response increased systemic vascular permeability [34]. It might be greatly beneficial to diagnose septic shock early with a suitable HCT-ALB value (such as > 10.25) and to reduce deaths caused by delays in diagnosis. We found that the HCT-ALB values were different in patients with sepsis and septic shock patients (Tables IV and V), which might be explained by different systemic inflammatory responses and the illness severity. Moreover, patients with bacterial infection of a pleural effusion had a higher HCT-ALB level than that with other humoral infections (Tables IV and V). The exact reason underlying this change remains to be elucidated. The relatively small sample size of patients with bacterial infection of pleural effusion might be a potential reason for giving a bias to the results. A future study with a large sample size will be needed to validate this observation.
In our previous study, we found that the HCT-ALB level of pregnant women with preeclampsia or eclampsia was as high as 14.65 ±6.97, and could be used as an important indicator for gestational hypertension [13]. In this study, we tested whether the HCT-ALB value could be used to distinguish patients with infections from those without infections. We used a large healthy population as the reference to draw the ROC curve of the HCT-ALB difference for patients with infections or non-infective conditions. When the HCT-ALB had a value > 10.25, we could obtain a reasonably high sensitivity (37.5%) and specificity (99.0%) for the diagnosis of severe infections (Figure 2). Therefore, the HCT-ALB value can provide helpful information in clinical practice when treating patients with infections showing atypical clinical manifestations or having negative laboratory results, especially in groups such as in the elderly with abdominal pain. We performed a prospective study for some patients with the predictor, and found that these patients were highly likely to develop a severe infection later clinically (Table III).
Potential weaknesses in this study: The study was performed on the basis of patients from a single center and was retrospective. In addition, there was a difference in the time frame of data collection for different groups under study. There was also a significant difference in average age between the two patient groups and the healthy control group, which might introduce some biases. Other limitations: First, we pooled some patients with infectious diseases with those with other diseases, such as bleeding and surgery in this study, which might affect the HCT-ALB level to some extent. A well-defined grouping of patients with large sample size according to disease categories will be needed to further define the specificity and sensitivity of HCT-ALB. Second, there was a partially overlapping pattern in the range of HCT-ALB levels among the groups. Third, low HCT and ALB levels could also be affected by other physical conditions such as poor nutritional status or chronic disease. Therefore, we had to balance the specificity and sensitivity for using this parameter in clinical practice. Moreover, the correlation between CRP, PCT and HCT-ALB levels in diagnosis of infection still requires further analysis.
In conclusion, we found that the HCT-ALB level, which reflects capillary leakage, might be used as a valid biomarker for the early diagnosis of severe infections. A HCT-ALB value > 10.25 would have a reasonably good sensitivity and specificity. This cheap and readily available test may potentially be used alongside current clinical parameters in assisting early diagnosis of severe infection. It could be especially useful in providing additional information in cases where the clinical picture is unclear. Further multi-center prospective studies are needed to confirm whether the ALB-HCT value can accurately predict the likelihood of severe infection in different populations.