Introduction
Adenosine (Ado) is omnipresent and released from almost all cells. It has been shown to affect a variety of cellular functions including cardiovascular, central nervous system, blood coagulation, angiogenesis and the immunological system. Tissue ischemia, cellular apoptosis, tissue damage and inflammation lead to increased release of purine nucleotides, whose concentrations may rise 100-fold [1–3]. Adenosine is mostly generated in the extracellular space by breakdown of ATP through a series of ectoenzymes, including apyrase (CD39) and 5′-nucleotidase (CD73) or by degradation of nucleic acids via the uric acid pathway during cellular injury [4].
Four receptor subtypes – A1, A2A, A2B and A3 – specifically bind and are activated by elevated levels of adenosine. The adenosine receptors (ARs) are seven transmembrane glycoproteins coupled with different types of G proteins. They differ in their affinity for adenosine, and in the downstream signalling pathways that are activated in the target cells. A1 and A3 receptors are coupled to Gi/o proteins and their stimulation decreases intracellular cyclic AMP (cAMP) levels, while Gs-coupled A2A and A2B receptors increase cAMP levels through the activation of adenylyl cyclase [5]. Furthermore, depending on the cell type studied, ARs may also signal through activation of the mitogen-activated protein kinase (MAPK) signalling pathway. The MAPK pathways are critically important in the regulation of cell proliferation, migration and differentiation [6–8]. In cancer, adenosine receptors have been shown to be overexpressed in malignant tissues and play important roles in regulating cancer proliferation, apoptosis and chemotaxis [9, 10]. Importantly, adenosine, whose concentration increases within hypoxic regions of solid tumours, has been recognized to interfere with the recognition and destruction of tumour cells by cytolytic effector cells of the immune system [3]. It profoundly inhibits the function of phagocytes and T lymphocytes [3, 11, 12].
Rhabdomyosarcoma (RMS) is a tumour that derives from early skeletal muscle cells or pluripotent mesenchyme and displays characteristics of muscle cells such as abundant glycogen and myofibrils [13–15]. It is the most common soft-tissue sarcoma of the head and neck in childhood and comprises 4% of all paediatric malignancies, with 10% of all cases occurring in the orbit [16]. There are two major histological subtypes of RMS: alveolar (A)RMS and embryonal (E)RMS. Clinically ARMS subtype is more aggressive and has a significantly worse outcome than ERMS. It is well known that RMS cells, particularly ARMS cells, can infiltrate the bone marrow (BM) and, because they can resemble haematological blasts, are sometimes misdiagnosed as acute leukaemia blasts. Current management includes surgery, irradiation and chemotherapy depending on the stage [17, 18].
Multiple factors including application of the treatment strategies, hypoxia related to solid tumour environment and even local muscle activity or blood flow may cause adenosine release and elevate its concentration. What is more, purine nucleotides and adenosine may be released and their concentrations highly elevated as a result of radio- or chemotherapy-induced cell damage [19–21]. Based on the above, the present study was undertaken to examine the possible roles of adenosine and adenosine receptor agonists in regulating metastasis and proliferation of rhabdomyosarcoma cancer cells.
Material and methods
Reagents
Adenosine, AMP (adenosine 5’-monophosphate disodium salt), DPCPX (8-cyclopentyl-1,3-dipropylxanthine), EHNA hydrochloride, pentostatin (dCF), and dipyridamole (DPM) were obtained from Sigma Aldrich (St Louis, MO). PD 184352 (2-[(2-chloro-4-iodophenyl)amino]-N-cyclopropylmethoxy)-3,4-difluorobenzamide), U 73122 (1-[6-[[(17β)-3-methoxyestra-1,3,5(10)-trien-17-yl]amino]hexyl]-1H-pyrrole -2,5-dione), ANR 94 (8-ethoxy-9-ethyl-9H-purin-6-amine), PSB 603 (8-[4-[4-(4-Chloro phenzyl)piperazide-1-sulfonyl)phenyl]]-1-propylxanthine), MRS 1220 (N-[9-chloro-2-(2-fura nyl)[1,2,4]-triazolo[1,5-c]quinazolin-5-yl]benzene acetamide), pertussis toxin (50 ng/ml), IB-MECA (1-deoxy-1-[6-[[(3-iodophenyl)methyl]amino]-9H-purin-9-yl]-N-methyl-β-D-ribofuranuronamide), and CPA (N-cyclopentyladenosine) were purchased from Tocris (Ellisville, MO). SDF-1 was from PeproTech (London, UK).
Cell lines
We used human RMS cell lines RH30 (ARMS) and RD (ERMS) (purchased in ATCC). RMS cells used for experiments were cultured in Roswell Park Memorial Institute medium (RPMI) 1640 and Dulbecco’s Modified Eagle’s Medium (DMEM) (both Sigma, St. Louis, MO), supplemented with 100 IU/ml penicillin and 10 μg/ml streptomycin (Life Technologies, Inc., Grand Island, NY) in the presence of 10% heat-inactivated fetal bovine serum (FBS, Life Technologies). The cells were cultured in a humidified atmosphere at 37°C in 5% CO2 at an initial cell density of 2.5 × 10⁴ cells/flask (Corning, Cambridge, MA) and the media were changed every 48 h.
Immunofluorescent (IF) analysis of paraffin-embedded muscle tissue and RMS
Three-μm-thick muscle tissue sections were deparaffinized twice in xylene (40 min and 20 min), rehydrated in alcohol (100%, 95%, 80%, and 70%), and transferred to deionized water. After antigen retrieval in a microwave oven for 10 min in citrate buffer pH = 6 (Dako Denmark) and incubation with blocking serum, adenosine A1R, A2AR, A2BR, A3R antibody were added (rabbit polyclonal anti-A1R/A2AR/A3R antibody or goat polyclonal anti-A2BR antibody, Santa Cruz Biotechnology) at 1 : 100 dilution for 1 h at room temperature (RT). After incubation with primary antibody and washing twice in PBS, the samples were incubated with secondary antibodies at 1 : 200 dilution for 1 h at RT (A1R, A2AR, A3 chicken anti-rabbit Alexa Fluor 488, Thermo Fisher Scientific; RMS A2BR rabbit anti-goat Texas Red, Sigma Aldrich; muscle A2BR rabbit anti-goat Texas Red, Vector Laboratories). Nuclei were visualized with DAPI (Sigma Aldrich). Section images were acquired under an Observer Z1 microscope (Zeiss, Germany), with an AxioCam MRm camera (Zeiss, Germany) and micrographs were analyzed with the AxioVision Rel.4.8 system (Zeiss, Germany). Cells were seeded in 6-well culture plates on cover glasses at 3 × 10⁴ and cultured as above for 24 h. Next, the cells were fixed in 4% neutral buffered formalin (5 min). After double washing in PBS cells were permeabilised with 0.1% TRITON-X100 solution in PBS for 10 min and after washing in PBS incubated with blocking serum solution. Further steps of the staining procedure were the same as in the case of histological slides. All the steps were performed in the dark. The slides were examined with the AxioVision Rel.4.8 system (Zeiss, Germany).
Chemotaxis assay
The 8-μm polycarbonate membranes were covered with 50 μl of 0.5% gelatin. Cells were detached with 0.5 mmol/l ethylenediaminetetraacetic acid (EDTA), washed in culture medium, resuspended in RPMI 1640 or DMEM with 0.5% BSA, and seeded at a density of 3 × 10⁴ in 120 μl into the upper chambers of Transwell inserts (Costar Transwell; Corning Costar, Corning, NY). The lower chambers were filled with adenosine (0.05–1000 μM), AMP (0.03–3000 μM), DPCPX (50 nM, 500 nM), ANR 94 (1 μM, 10 μM), PSB 603 (500 nM, 1000 nM), MRS 1220 (1 nM, 10 nM), pertussis toxin (50 ng/ml), PD 184352 (5 μM), U 73122 (5 μM), IB-MECA (10 μM), CPA (10 nM) or 0.5% BSA RPMI 1640 or DMEM (negative control) or with SDF-1 (300 ng/ml) (positive control). After 24 h, the inserts were removed from the Transwells. Cells remaining in the upper chambers were scraped off with cotton wool and cells that had transmigrated were stained with HEMA 3 according to the manufacturer’s instructions (Fisher Scientific, Pittsburgh, PA) and counted either on the lower side of the membranes or on the bottom of the Transwells.
Cell proliferation
Cells were plated in culture flasks at an initial density of 103 cells/cm2 in the presence or absence of adenosine (0.05–1000 μM), AMP (0.03–3000 μM), DPCPX (50 nM), ANR 94 (1 μM), PSB 603 (500 nM), MRS 1220 (1 nM), DPM (5 μM), EHNA (10 μM) or dCF (50 μM). The cell number was calculated at 72 h after culture initiation. At the indicated time points, cells were harvested from the culture plates by trypsinization and the number of cells was determined using a Navios cytometer (Beckman Coulter).
Phosphorylation of intracellular pathway proteins and Western blotting
Western blots were performed on extracts prepared from RMS cell lines (3 × 10⁶ cells) that were kept in RPMI or DMEM medium containing low levels of bovine serum albumin (BSA, 0.5%) to render the cells quiescent. The protocol used herein is standard in our laboratory and was applied as previously described [22]. Briefly, the cells were divided and stimulated with optimal doses of Ado (50 μM), and AMP (300 μM) for 5 min at 37°C and then lysed (for 10 min) on ice in RIPA lysing buffer (Santa Cruz Biotech), containing protease and phosphatase inhibitors (Roche). Subsequently, the extracted proteins were separated by 12% sodium dodecyl sulfate-polyacrylamide gel electrophoresis (SDS-PAGE) and the fractionated proteins were transferred to a nitrocellulose membrane (Bio-Rad). Phosphorylation of the intracellular kinases, p44/42 mitogen-activated protein kinase (MAPK) (Thr 202/Tyr 204), was detected using commercial mouse phospho-specific monoclonal antibodies (mAbs) (p42/44) (Cell Signaling) with horseradish peroxidase (HRP)-conjugated goat anti-mouse IgG as a secondary antibody (Santa Cruz Biotech). Equal loading in the lanes was evaluated by stripping the blots and reprobing with appropriate mAbs: p44/42 anti-MAPK clone no. 9102 (Santa Cruz Biotech). A1 receptor expression was visualized with Adenosine A1-R (H-40) Antibody (Santa Cruz Biotech) and GAPDH as a loading control (Abcam). The membranes were developed with an enhanced chemiluminescence (ECL) reagent (GE Healthcare), dried, and visualized by a Chemidoc transilluminator (Bio-Rad).
Annexin V/PI assays for apoptosis
For annexin V/PI assays, cells were stained with Annexin V-FITC and PI, and evaluated for apoptosis by flow cytometry according to the manufacturer’s protocol (BD Pharmingen, San Diego, CA, USA). Briefly, 1 × 10⁶ cells were washed twice with phosphate-buffered saline (PBS), and stained with 5 μl of Annexin V-FITC and 10 μl of PI (5 μg/ml) in 1× binding buffer (10 mM HEPES, pH 7.4, 140 mM NaOH, 2.5 mM CaCl2) for 15 min at room temperature in the dark. The apoptotic cells were determined using a Navios flow cytometer (Beckman Coulter). Annexin V+ PI– cells represented the early apoptotic populations. Annexin V+ PI+ cells represented either late apoptotic or secondary necrotic populations.
Real-time quantitative reverse transcription PCR (RQ-PCR)
Total RNA was isolated from cells treated with Ado and from control cells with the RNeasy Kit (Qiagen). The RNA was reverse-transcribed with MultiScribe reverse transcriptase and oligo-dT primers (Applied Biosystems, Foster City, CA). Quantitative assessment of mRNA levels was performed by real-time RT-PCR (RQ-PCR) on an ABI 7500 instrument with Power SYBR Green PCR Master Mix reagent. Real-time conditions were as follows: 95°C (15 s), 40 cycles at 95°C (15 s), and 60°C (1 min). According to melting point analysis, only one PCR product was amplified under these conditions. The relative quantity of a target, normalized to the endogenous control β2 microglobulin gene and relative to a calibrator, is expressed as 2–ΔΔCt (fold difference), where Ct is the threshold cycle, ΔCt = (Ct of target genes) – (Ct of endogenous control gene, β2 microglobulin), and ΔΔCt = (ΔCt of samples for target gene) – (ΔCt of calibrator for the target gene). The following primer pairs were used:
β2 microglobulin F: 5′-AATGCGGCATCTTCAAACCT-3′,
β2 microglobulin R: 5′-TGACTTTGTCACAGCCCAAGATA-3′,
A1R F: 5′-TGCGAGTTCGAGAAGGTCATC-3′,
A1R R: 5′-GAGCTGCTTGCGGATTAGGTA-3′,
A2AR F: 5′-CGAGGGCTAAGGGCATCATTG-3′,
A2AR R: 5′-CTCCTTTGGCTGACCGCAGTT-3′,
A2BR F: 5′-CTCTTCCTCGCCTGCTTCGTG-3′,
A2BR R: 5′-TTATACCTGAGCGGGACACAG-3′,
A3R F: 5′-TACATCATTCGGAACAAACTC-3′,
A3R R: 5′-GTCTTGAACTCCCGTCCATAA-3′.
Knockdown of A1R with short hairpin RNA. In RNAi experiments, the short hairpin RNA (shRNA)-generating plasmid pLKO1 (Sigma Aldrich) was used. The oligonucleotide-targeting base sequence for human A1R was: 5′-CAAGATCCCTCTCCGGTACAA-3′. RMS cells were plated at 80% confluency and transfected with a shRNA vector using Lipofectamine (Invitrogen) according to the manufacturer’s protocol. A commercially available scrambled shRNA negative control plasmid was used (Sigma Aldrich). For stable transfection of shRNA-producing vectors, single-cell dilutions were prepared and the cells further expanded in the presence of puromycin (1 μg/ml, Invitrogen)
Results
Firstly, in attempt to characterize the function of adenosine receptors we evaluated A1R, A2AR, A2BR and A3R expression in normal skeletal muscle and the RMS cell lines RH30 and RD (Figure 1, Table I) that belong to ARMS and ERMS rhabdomyosarcoma subtypes, respectively. Additionally, we included smooth muscle tissue as a positive control. Both immunohistochemical staining and RQ-PCR analysis revealed increased expression of A1 and A2B receptors in RMS cell lines when compared to normal muscle tissue. The A2B receptor is present only in the RD cell line and skeletal muscle tissue, whereas it is absent on RH30 cells. The A3 receptor is relatively weakly expressed in RMS cells.
Table I
Immunoexpression of adenosine receptors in cell lines and tissue samples
| Variable | A1-R | A2a-R | A2b-R | A3-R |
|---|---|---|---|---|
| Skeletal muscle | + | + | ++ | ++ |
| RH30 cell line | +++ | ++ | + | + |
| RD cell line | +++ | ++ | ++ | + |
Figure 1
Immunofluorescent expression of adenosine receptors (ARs) in skeletal muscle tissue and cell lines (A). Skeletal muscle tissue fragments – A1R A2AR and A3R secondary antibodies Alexa Fluor 488, A2BR combined with Texas Red; objective magnification 60×, zoom 1.9; images fitted to a panel in size; merged with transmission light channel for more detailed tissue visualization (FV100 Confocal system). RH30 and RD cell lines A1R A2AR and A3R secondary antibodies Alexa Fluor 488, A2BR combined with Texas Red objective magnification 40× – images cut off from original size microphotographs (Axiobserver). Yellow arrows indicate positive reaction in RH30 and RD cells. RQPCR analysis of ARs mRNA levels in muscle tissue and RMS cell lines (B)
Adenosine receptors possess high (A1 and A3) and low (A2A and A2B) affinity to adenosine [23]. Thus, they may be stimulated by lower and higher doses of Ado. Recently it was shown that extracellular AMP is a putative ligand of the A1 receptor [24]. In further experiments, we used both Ado and AMP for adenosine receptor stimulation.
It was previously shown that adenosine receptors are involved in cell migration, and thus may play an important role in cancer cell metastasis. To better address this phenomenon we employed modified Boyden chambers in order to evaluate the chemotactic potential of extracellular adenosine and AMP. First, a dose response experiment allowed us to visualize cell migration upon stimulation by a range of doses of adenosine (0.05–1000 μM) and AMP (0.03–3000 μM). We found that increasing doses of both molecules strongly affected chemotaxis, reaching an optimum at 50 μM for adenosine and 300 μM for AMP (Figure 2). In all further chemotactic studies the optimal concentrations were used. In the next set of experiments, we employed specific antagonists of adenosine receptors, namely DCPX for A1R, ANR 94 for A2AR, PSB 603 for A2BR and MRS 1220 for A3R (Figure 3). Both RH30 and RD cells significantly decreased their mobility towards adenosine and AMP when increasing doses of DPCPX were applied, which makes A1R the key receptor involved in the chemotactic response to the gradient of Ado and AMP. We noted that chemotactic potential was also affected by blocking of the A3 receptor, but its expression is not high, so its effect on cell migration is small (Figures 1, 3). To further support this notion, we employed the shRNA technique in order to decrease A1 expression. The genetically modified RH30 cell line exhibited decreased A1 receptor expression (by 85%) and reduced chemotactic responsiveness to both adenosine and AMP gradients (Figure 4). Blockage of A2A and A2B receptors did not cause a significant decrease in cell migration, except for the A2B receptor in RD cells stimulated with Ado (Figure 3). The above experiments show that extracellular Ado and AMP are potent chemoattractants for RMS cells. The A1 receptor is a key element involved in the response. Of note, a chemotactic response may be evoked by a gradient of specific A1 and A3 agonists, CPA and IB-MECA, respectively (data not shown).
Figure 2
RH30 cell line migration induced by different concentrations of adenosine (A) and AMP (B) was detected by transwell migration assay. SDF-1 (300 ng/ml) served as a positive control. Data are shown as mean ± SEM. All experiments were repeated three times with similar results
*P < 0.05.
Figure 3
Blockage of migration induced by adenosine (50 μM) (A, B) and AMP (300 μM) (C, D) by selected inhibitors: DPCPX (8-cyclopentyl-1,3-dipropylxanthine) for A1R, ANR 94 (8-ethoxy-9-ethyl-9H-purin-6-amine) for A2A, PSB 603 (8-[4-[4-(4-chloro phenzyl)piperazide-1-sulfonyl)phenyl]]-1-propylxanthine) for A2B and MRS 1220 (N-[9- chloro-2-(2-furanyl)[1,2,4]-triazolo[1,5-c]quinazolin-5-yl]benzene acetamide) for A3R. RH30 (A, C) and RD (B, D)
*P < 0.05 versus adenosine.
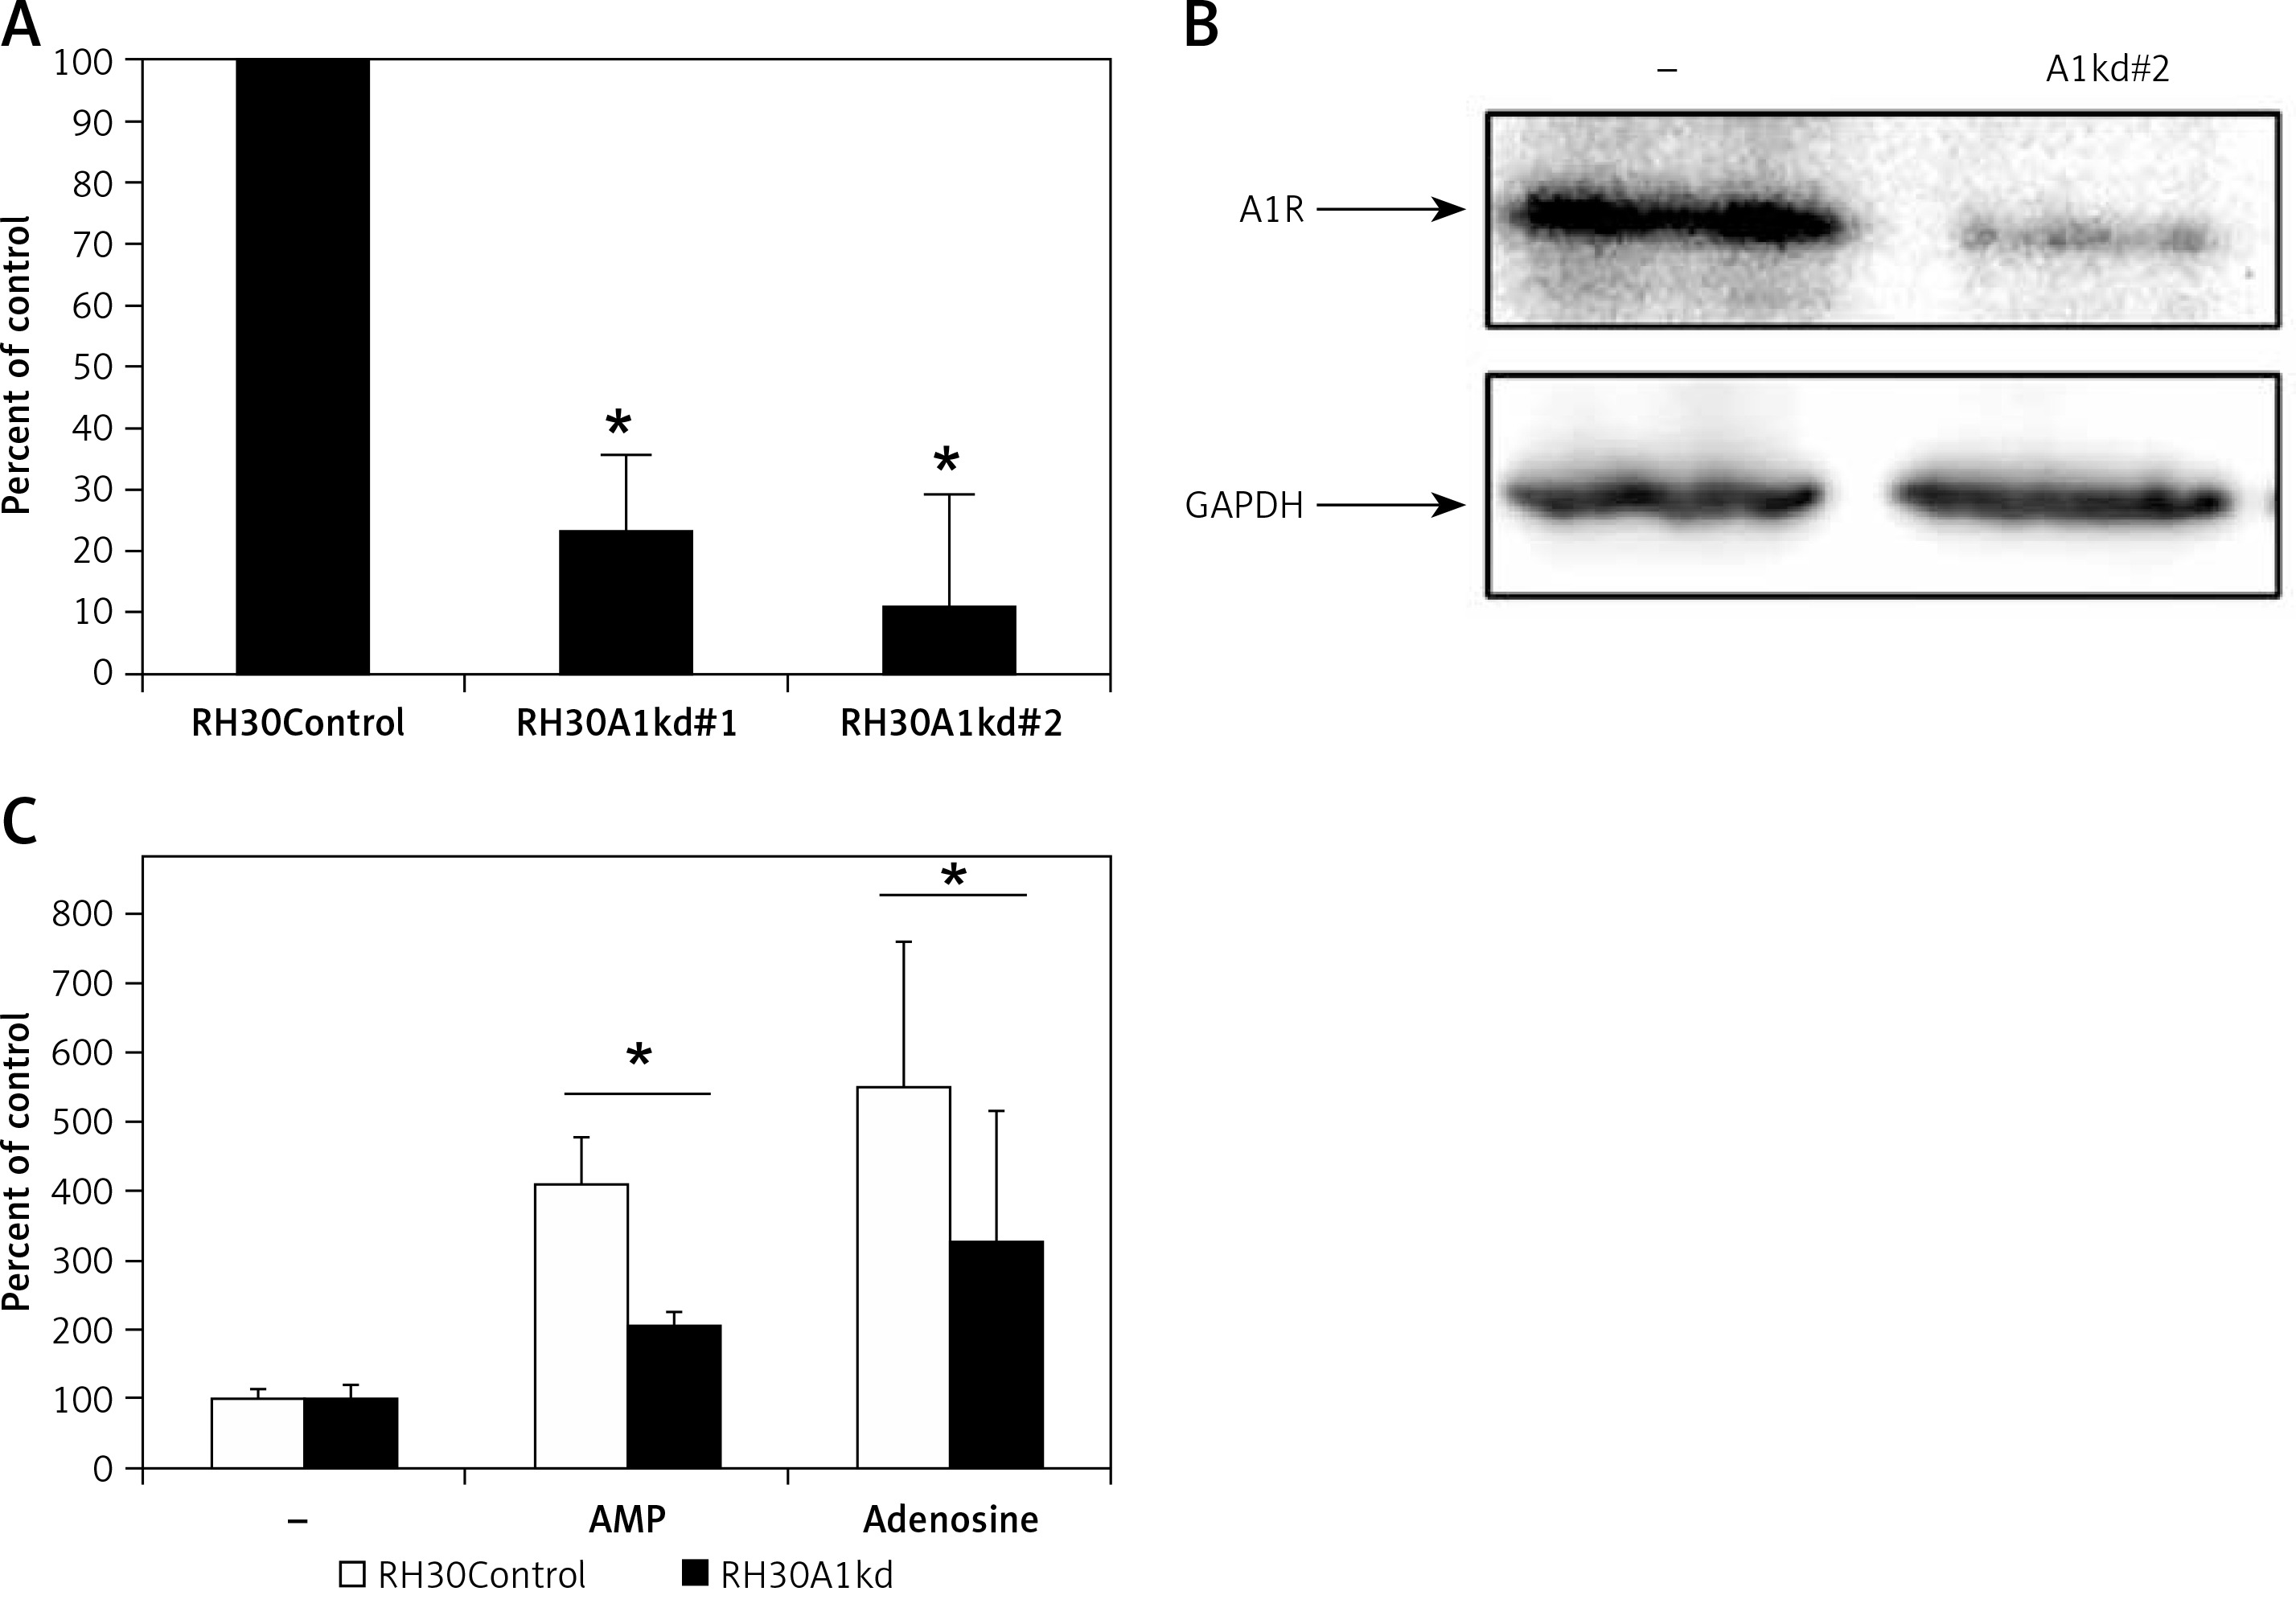
Figure 4
Downregulation of A1R expression in RH30 cell line by shRNA. Figure shows decrease in the expression in two selected clones (RH30A1kd) at the mRNA level (A) and protein level (B) visualized by Western blot. C – The chemotactic response of the RH30A1kd cells to a gradient of adenosine (50 μM) and AMP (300 μM)
*P < 0.05.
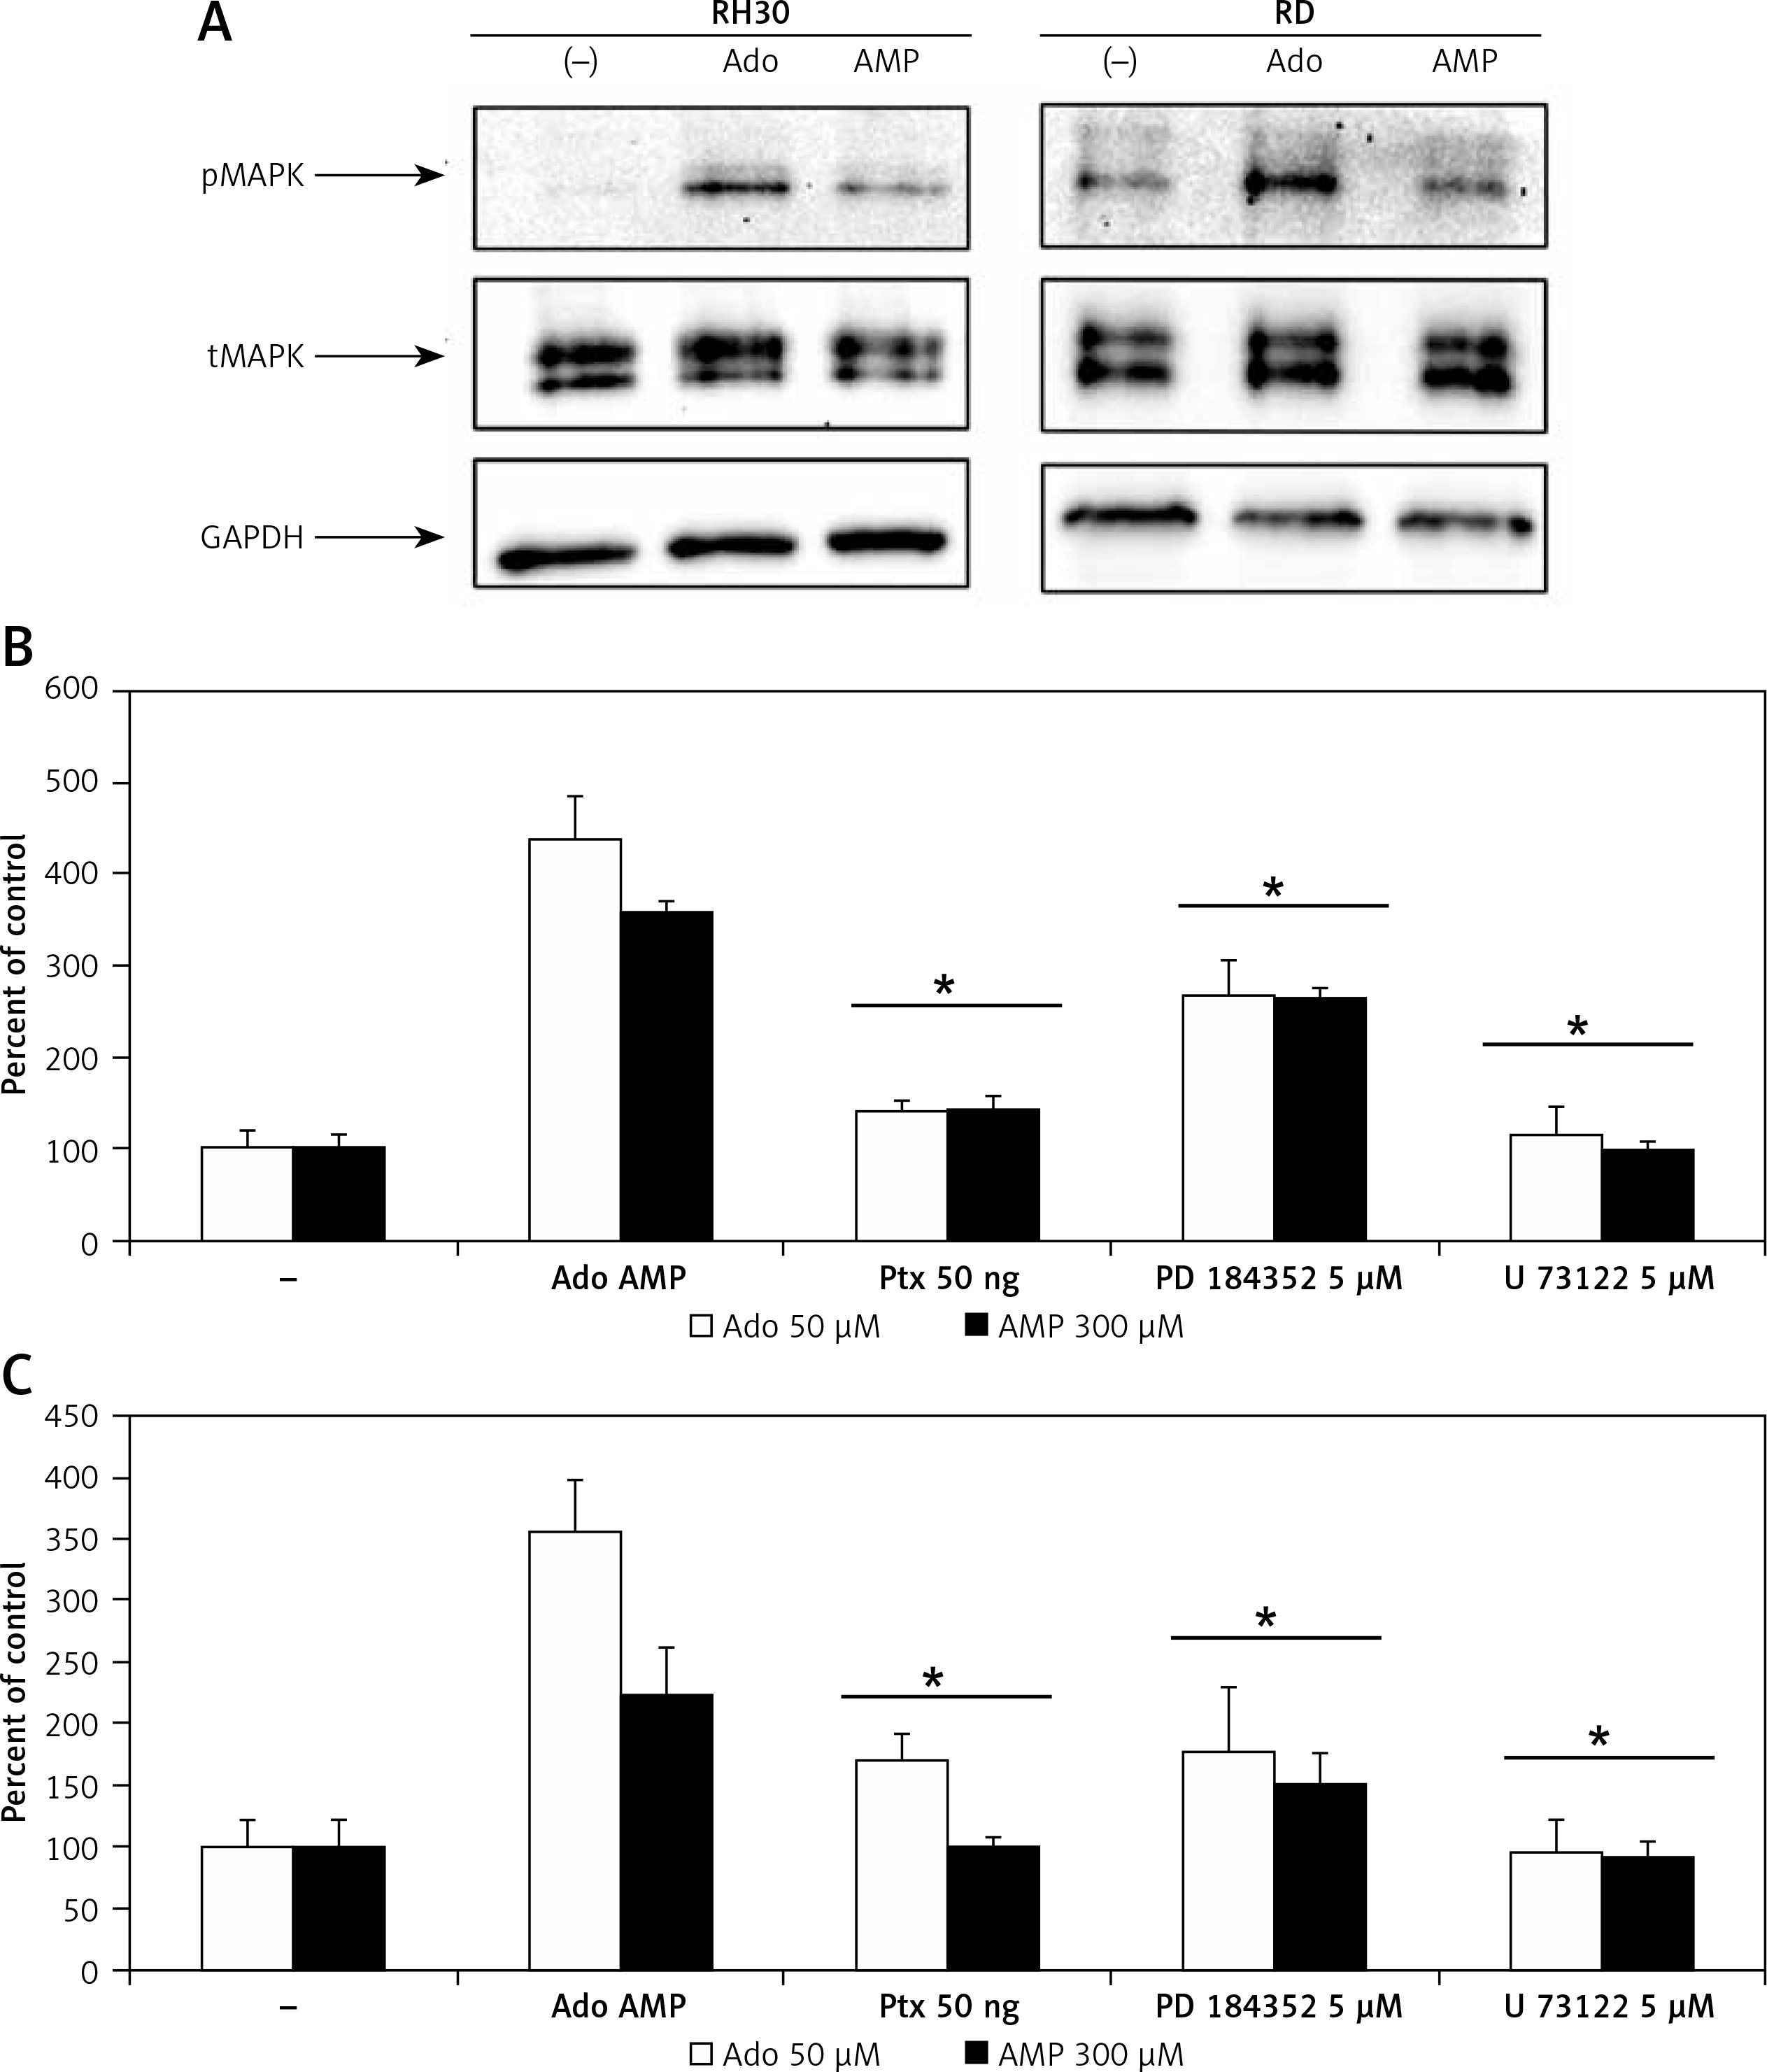
In order to better characterize responses triggered by adenosine and AMP, we evaluated signal transduction pathway activation by western blot visualization of MAPK p44/42 (Erk1/2) kinase phosphorylation at Thr202/Tyr204 and Thr185/Tyr187, respectively (Figure 5 A). Moreover, application of the MAPK inhibitor PD184352, as well as pertussis toxin or the phospholipase C inhibitor U73122, significantly blocked the chemotactic response of RH30 and RD cells (Figures 5 B, C).
Figure 5
Effect of adenosine and AMP signalling in rhabdomyosarcoma (RMS) cells. RH30 and RD cells were stimulated by adenosine (50 μM) or AMP (300 μM) for 5 min, and phosphorylation was assessed by Western blotting (A). The experiment was repeated three times with similar results. Inhibition of rhabdomyosarcoma (RMS) cell chemotaxis to adenosine (50 μM) and AMP (300 μM) by PD184352 (5 μM), U73122 (5 μM) and pertussis toxin (50 ng). Cells were pre-incubated with or without inhibitors for 30 min at 37°C. Inhibitors together with adenosine or AMP were placed in the lower wells of the chemotaxis chamber (B, C)
*P < 0.05.
Based on our results presented in Figure 2, we noted that application of upper-range doses of Ado and AMP (above 50 μM and 300 μM) led to a significant decrease in their chemotactic responsiveness. Therefore, we performed a proliferation test in order to evaluate the effect of Ado and AMP on cell survival in a time- and dose-dependant manner.
Figure 6 shows that treating cells with chemotactically optimal (50 μM and 300 μM) or higher doses of Ado and AMP, respectively, for 72 h led to decreased proliferation of both RH30 and RD cells. Specifically, it is the adenosine that has a significant anti-proliferative effect. RD cells are more sensitive to high doses of Ado and AMP. As shown in Figure 7, by employing PI staining and annexin-V binding we observed that increasing doses of Ado trigger an apoptotic reaction in RH30 cells. We may speculate that Ado accumulates in a time-dependent manner and negatively influences cell proliferation and cell survival. Since Ado is known to exert its effect through an extrinsic pathway (receptor-based) or intrinsic pathway (transporter based) [25] we applied receptor antagonists as well as deaminases and Ado transporter inhibitors.
Figure 6
Adenosine and AMP-dependent cell proliferation. RH30 and RD cells were treated with increasing doses of adenosine (0–5000 μM) or AMP (0–3000 μM) and their proliferative capacity was measured in plastic dishes by flow cytometry. Combined data from three independent experiments are shown
*P < 0.05 versus untreated controls.
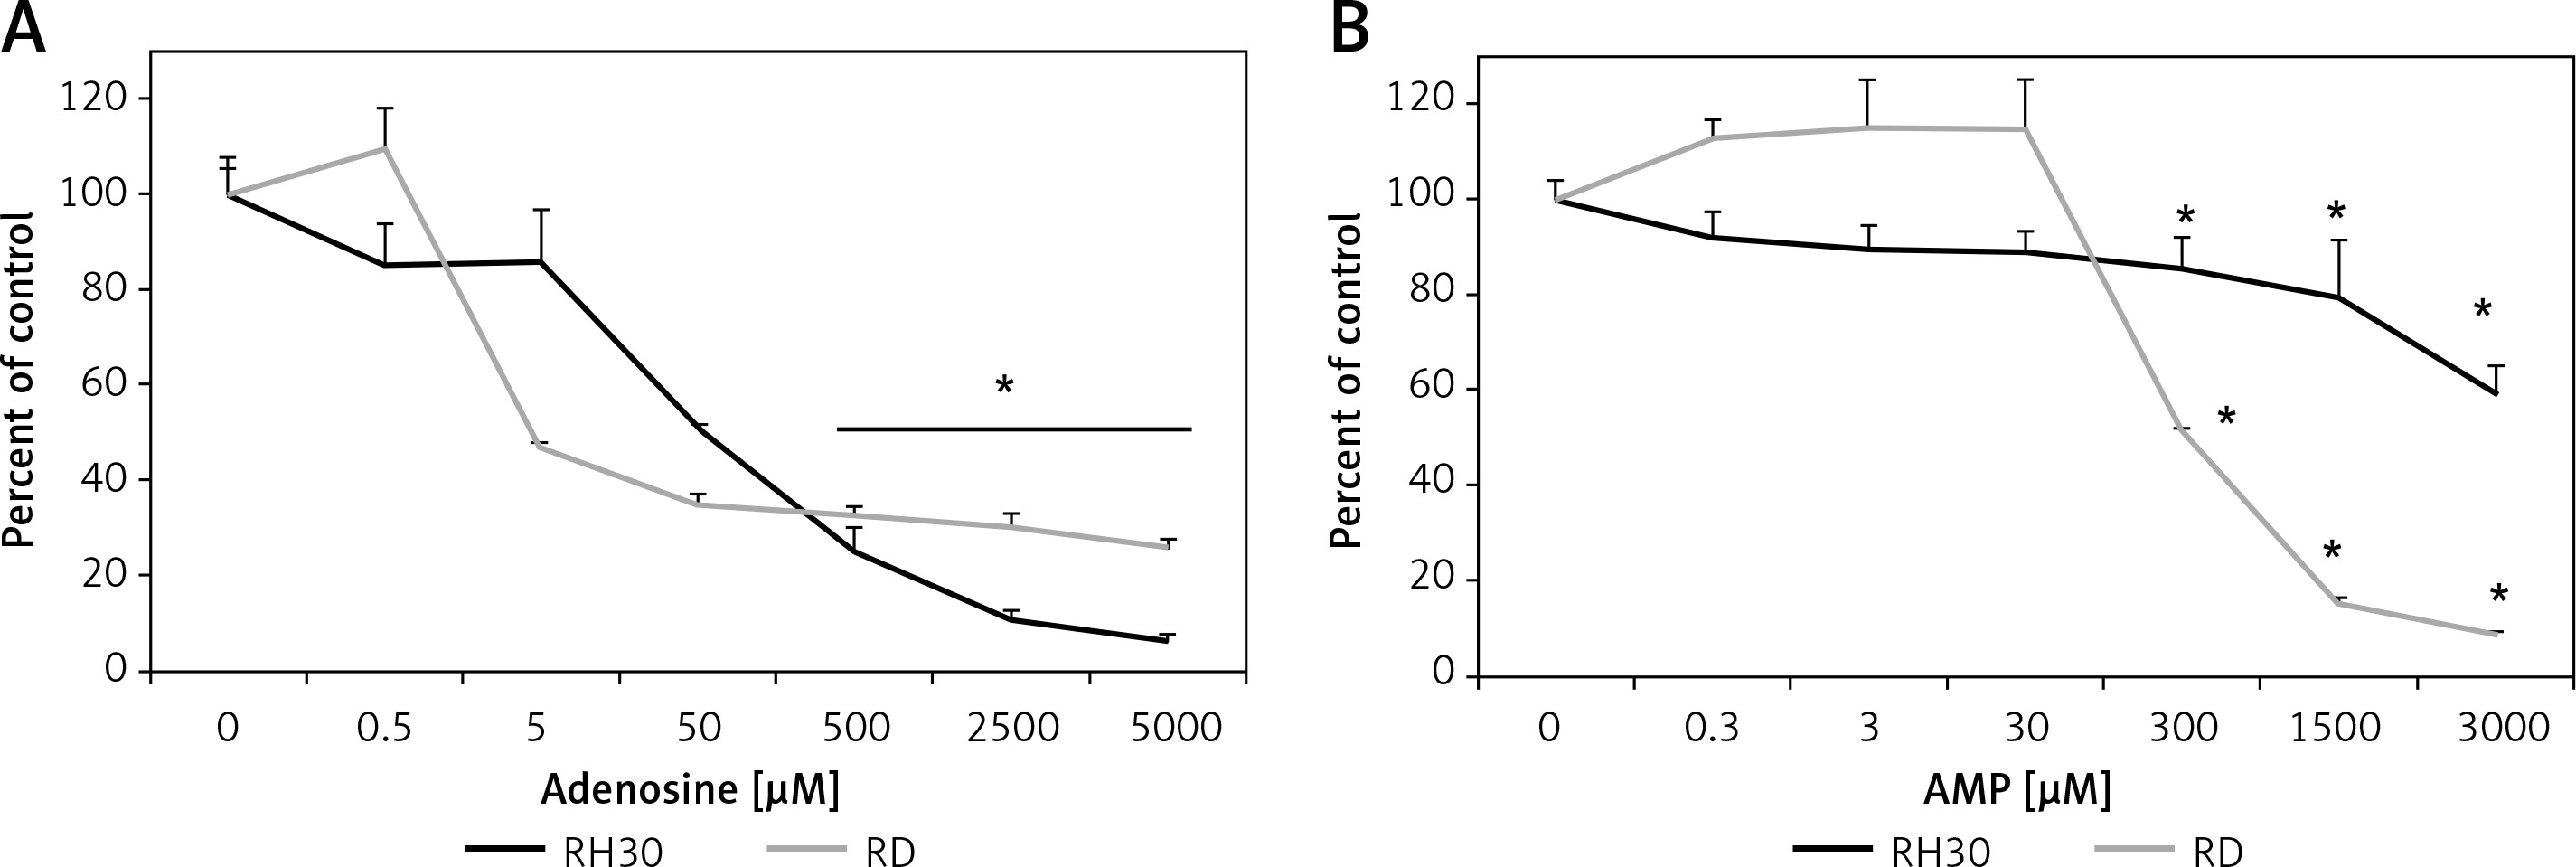
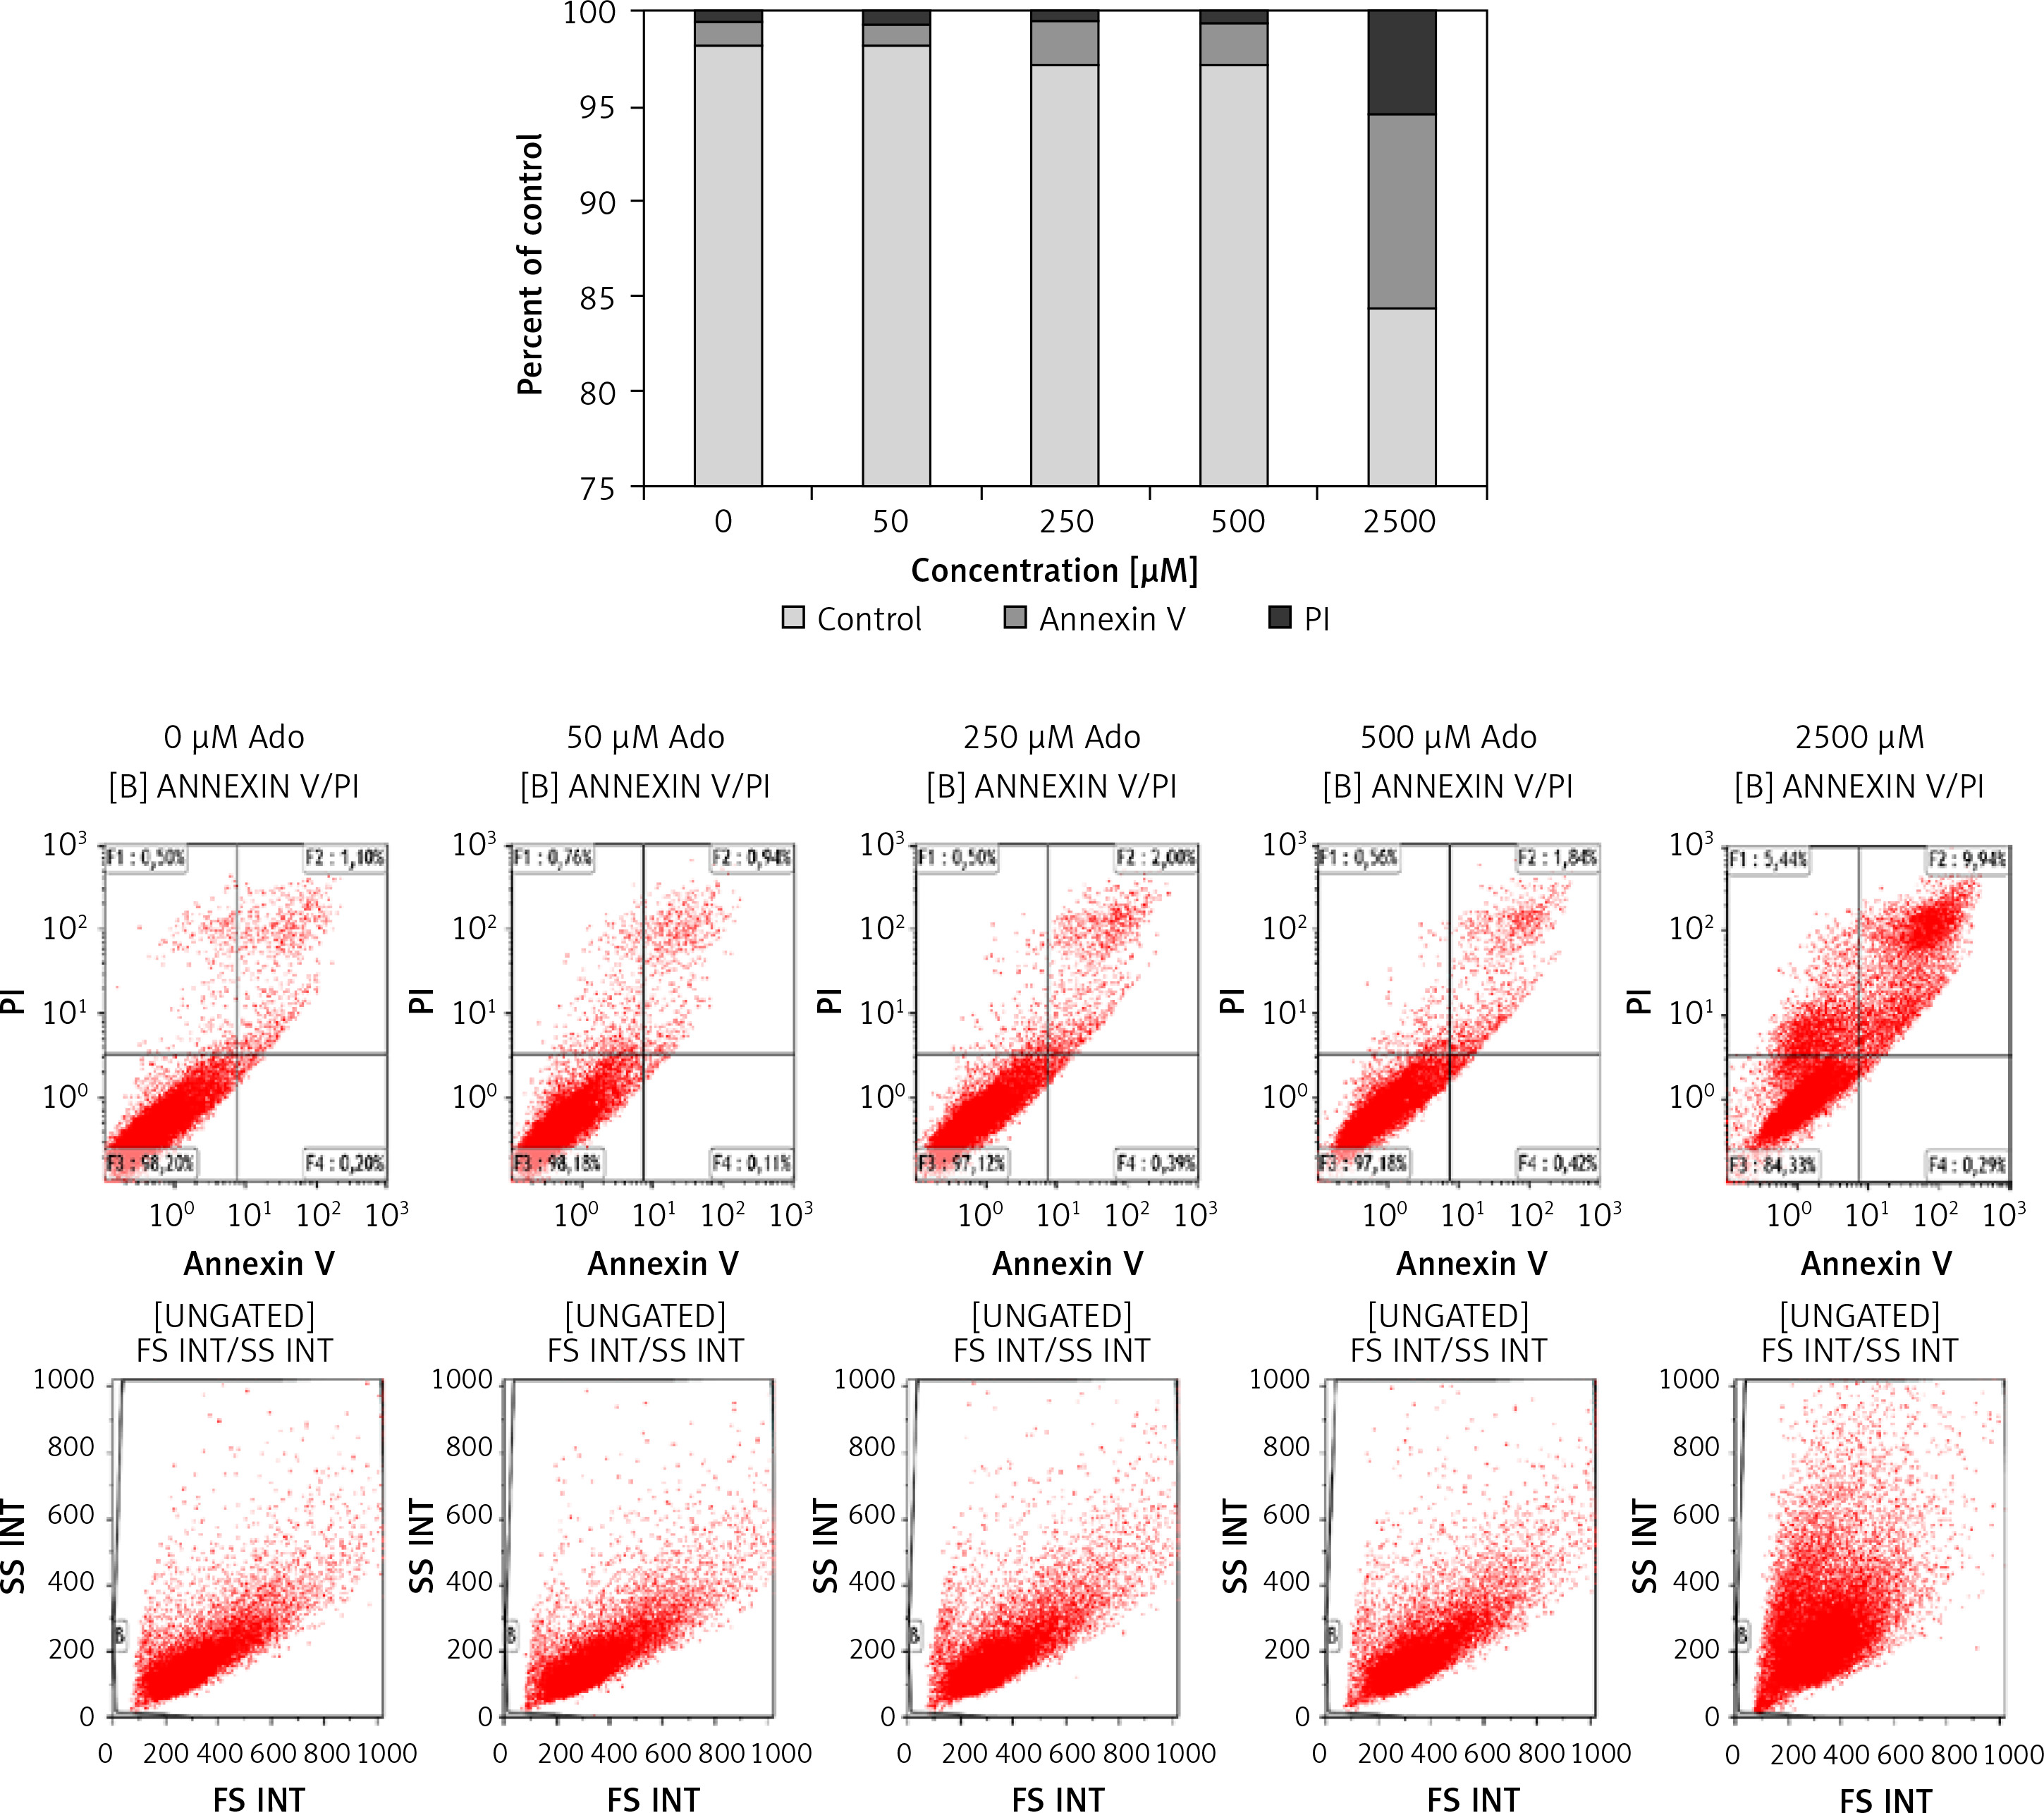
Figure 7
Representative study of apoptosis in adenosine-treated RH30 cells. Cells were treated with 0 μM, 50 μM, 250 μM, 500 μM, or 2500 μM of adenosine for 72 h and stained with propidium iodide and anti-annexin V antibody
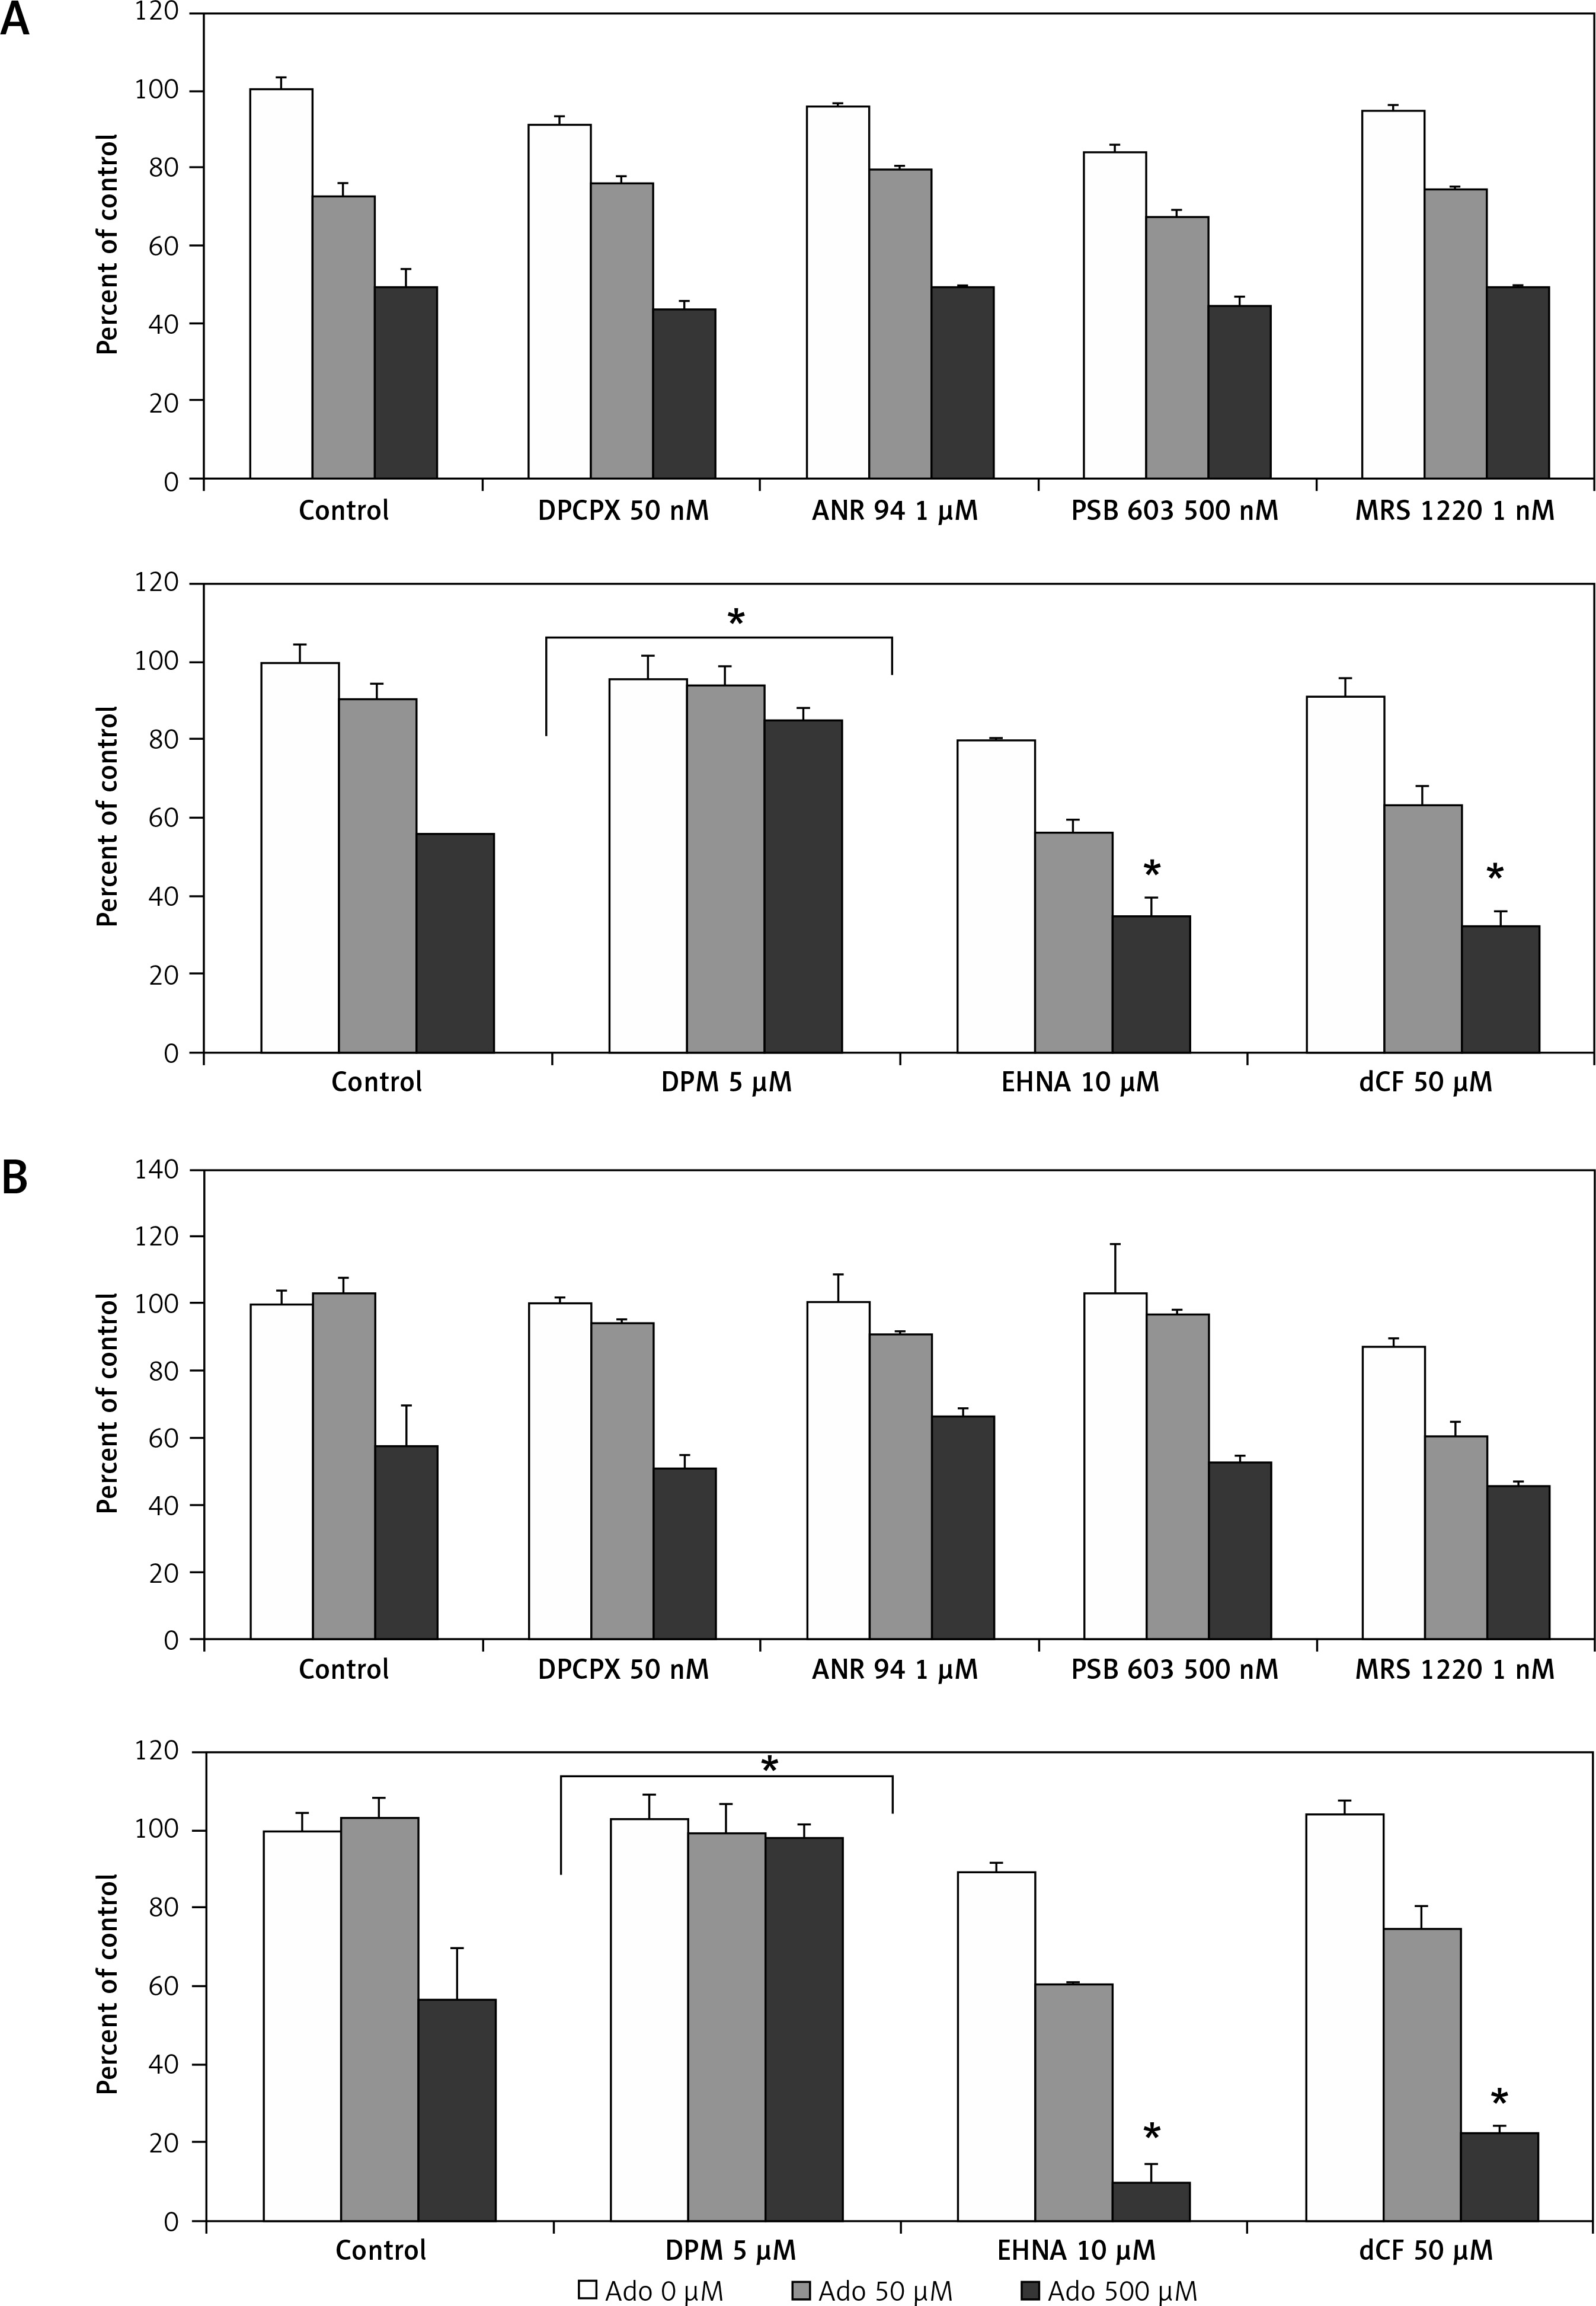
Therefore, in order to clarify this issue, we stimulated RMS cells with increasing doses of Ado (50 μM and 500 μM) for 72 h and systematically blocked 4 receptors with previously mentioned antagonists. The receptor antagonists did not prohibit cytotoxic Ado activity, and this was not mediated by adenosine receptors (Figure 8). Next, we employed specific inhibitors of nucleoside membrane transporter (dipyridamole – DPM), adenosine deaminase erythro-9-(2-hydroxy-3-nonyl)adenine (EHNA) and 2′-deoxycoformycin (dCf). Figure 8 shows that blockage of the adenosine transporter by DPM significantly increased survival of RMS cells stimulated by Ado, whereas when adenosine deaminase inhibitors were applied the survival was affected much more than by adenosine itself. We noted the same situation for both cell lines, with RD cells being more prone to cytotoxicity induced by adenosine.
Figure 8
Effects of A1 receptor antagonist (DPCPX), A2A receptor antagonist (ANR 94), A2B receptor antagonist (PSB 603), A3 receptor antagonist (MRS 1220), adenosine transporter inhibitor (dipyridamole, DPM), adenosine deaminase inhibitors (EHNA hydrochloride, EHNA and pentostatin, dCF) on adenosine (0 μM, 50 μM, 500 μM) chemotactic (A) RH30 and (B) RD cell response. In all wells receptor antagonists and inhibitors were added 30 min before adenosine stimulation every 24 h for 72 h
Data are means ± SE of duplicate wells within a single experiment. The experiment was repeated three times. *P < 0.05.
Discussion
Adenosine is a very important molecule that exists in both intracellular and extracellular environments, at a wide range of concentrations. Adenosine may be released directly by multiple cell types, with extracellular concentrations in the nanomolar range. Adenosine release and generation greatly rise in situations of physiological stress such as trauma, hypoxia or inflammation and can reach the micromolar range. Tissue levels can significantly rise [26]. Intracellular adenosine is exported from cells via equilibrative nucleoside transporters or during apoptosis or necrosis. What is important, accumulation of extracellular nucleotides and products of its degradation is augmented as a result of chemo- and radiotherapy – strategies which are commonly used in cancer treatment [19, 21]. Apart from direct Ado release, a significant amount is produced as a result of ATP degradation. ATP in the extracellular environment is quickly dephosphorylated by a complex of cell surface-located enzymes named ectonucleotidases including ecto-NTPDases (nucleoside triphosphate diphosphohydrolases) such as CD39, ecto-NPPs (nucleotide pyrophosphohydrolases/phosphodiesterases), ecto-alkaline phosphatases, and ecto-5′nucleotidase (CD73) [27–29]. Therefore, ATP relatively briefly exerts its effects and the concentration of end products of ATP degradation such as adenosine quickly rises.
Adenosine is a ligand for P1 receptors. The family consists of four receptors with different affinity towards adenosine, and therefore they act in a varying spectrum of Ado concentration. All of these ARs are cell surface G protein-coupled receptors which have distinct tissue-specific distributions [5]. In our study we show, for the first time, that rhabdomyosarcoma expresses P1 receptor subtypes and among them the A1 receptor is greatly overexpressed when compared to normal skeletal muscle. Previous immunohistochemical and pharmacological studies have revealed the existence of A1, A2A and A2B receptor types in skeletal muscle cells [30, 31]. However, expression of the A1 receptor is disputable, as it is mostly expressed in endothelial cells and results from mRNA studies on muscle homogenates may falsely overestimate its amount [30]. In our experiment for mRNA studies, we also used muscle homogenates and detected the A1R mRNA transcript in skeletal muscle (Figure 1 B). An immunohistochemical study showed the barely detectable A1 receptor in normal skeletal muscle (Figure 1 A). Nonetheless, we may conclude that the A1 receptor is overexpressed in RMS cell lines. In general, P1 receptors are overexpressed in multiple tumours such as breast carcinoma, melanoma or colorectal cancer [32–34] and are extensively involved in cancer biology.
In our study, extracellular adenosine and AMP effectively bound to P1 receptors and activated intracellular signalling transduction pathways involving MAP kinases and phospholipase C, as shown in Figure 5 and by Schulte et al. [35]. Based on our results, the A1 receptor seems to play the most important role in triggering the chemotactic response of RMS cells to the extracellular adenosine and AMP gradient. For both ligands, the chemotactic response was stronger than that to SDF-1, which is a known chemoattractant for RMS cells [22]. Blockage of the receptor by the specific antagonist DPCX or decrease of its expression by shRNA significantly abolished cell migration. Moreover, the experiments indicated that not only adenosine binds to the A1 receptor but also extracellular AMP. Our results are in line with a previously published study by Rittiner et al. [24]. What is more, the chemotactic response was pertussis toxin sensitive, indicating involvement of Gi/o coupled receptors such as A1 or A3 receptors [36]. Migration-stimulating properties of adenosine were previously described; extracellular adenosine stimulates chemotaxis of human endothelial progenitors [37], oligodendrocytes [38] and neutrophils [39] or cancer cells [40]. Moreover, cancer cells such as rhabdomyosarcoma typically overexpressing CD73 (data not shown) and adenosine receptors (Figure 1) may localize the enzymes and receptors in the leading edge of a migrating cell, hence amplifying the gradient of external chemoattractant [41] and thus increasing its own migratory capacity.
Adenosine has been shown to inhibit cell growth and induce apoptosis in several cancer cell lines via intrinsic and extrinsic pathways. The extrinsic pathway is linked to adenosine receptors, while the intrinsic pathway relies on adenosine uptake via adenosine transporters [25]. In our study, we noted that increasing doses of adenosine affect cell proliferation. In many tumour types adenosine is known as a proliferation enhancer [42–44], while in other cases adenosine receptor agonists served as inducers of apoptosis and tumour growth inhibitors [9, 10, 45]. In our study, RMS cells treated with increasing doses of adenosine showed decreased survival. None of the synthetic adenosine receptor agonists stimulated RMS cell growth (data not shown) and none of the antagonists prevented cell death. We may speculate that with time adenosine accumulates around and inside the cells, exerting a negative effect that leads to cell apoptosis in a receptor-independent manner. It was very interesting to explain how the adenosine affects RMS proliferation. By employing adenosine receptor antagonists, deaminase and adenosine transporter inhibitors it became clear that adenosine acts through the intrinsic pathway. Blockage of the Ado transporter by dipyridamole increases cell survival. What is more, application of deaminase inhibitors, which cause a further rise of adenosine concentration, strengthened the negative effect on cell proliferation (Figure 8). Such a scenario was previously documented for gastric cancer [46], human hepatoma [47] and MCF-7 breast cancer cells [48]. Typically, intracellularly transported adenosine is phosphorylated to AMP and induces apoptosis via caspase-3/-8 activation [49] or apoptosis-inducing factor (AIF)-homologous mitochondrion-associated inducer of death (AMID) translocation [47].
In conclusion, extracellular nucleotides (ATP, ADP, AMP) produced/released during states of stress such as hypoxia or cell damage are dephosphorylated by a step-wise process involving a series of ectonucleotidases. This process leads to increased concentrations of adenosine. This scenario may happen at sites of damage induced by radio- or chemotherapy [21] or wherever oxygen demand exceeds oxygen supply, as in the tumour microenvironment affected by inflammatory cytokines [50] creating the hypoxic niche of bone marrow or sites of ischaemia [51]. At first, adenosine, together with CD73 overexpression, acts as a potent chemoattractant to stimulate cancer cell metastasis. When the adenosine concentration rises further, it has a detrimental effect on cellular proliferation. This phenomenon might be encountered when adenosine deaminase activity is blocked or where the blood supply is not sufficient, as in the necrotic core of a solid tumour [52]. Notably, this high adenosine concentration may in turn stimulate angiogenesis and suppress the immune system. Thus, further studies are needed to fully understand the final role of adenosine in tumour biology and possible applications of agonists and antagonists of purinergic signalling.