Introduction
Diffusion-weighted (DW) magnetic resonance imaging (MRI), as an important component of multiparametric magnetic resonance imaging, plays a key role in the detection, locali-zation, and characterization of prostate cancer [1]. This non-invasive functional imaging technique may provide information about cancer cell density and tissue construction in prostate cancer [2]. DW images are acquired by applying the pairs of motion-probing gradients in addition to the routine gradient fields to encode the displacement of water molecules in the tissue. The degree of sensitivity to water diffusion is defined by the DW factors (so-called b-values), which change with the strength and duration of diffusion gradients and the time interval between them [3]. The image contrast in DWI reflects the differences in water molecule mobility in adjacent biological tissues, which is assessed by the signal intensity in DW images and also by calculation of the apparent diffusion coefficient (ADC)[4-7]. An ADC map that reflects the net displacement of water molecules in tissue is calculated from at least 2 different DW images. Increasing the number of DW images will improve the accuracy of the calculated ADC at the cost of increased imaging time and decreased signal to noise ratio in higher b-value images [5,8]. The molecular mobility of water in malignant prostate tissue with a higher cellular density is more restricted, and therefore the ADC values of prostate cancer lesions are significantly lower than those of normal tissues [9].
Although DW imaging with ADC maps has gained interest in prostate cancer detection and localization there is still no consensus about the number and the range of b-values that should be selected for ADC calculation. The European Society of Urogenital Radiology (ESUR) prostate MRI guidelines has recommended the use of at least 2 b-values for calculation of ADC: a minimum b-value of 50-100 s/mm2 and a maximum b-value of 800-1000 s/mm2 [10]. However, multiple studies have evaluated the diagnostic accuracy of ADC using upper b-values greater than 1000 s/mm2. Because absolute ADC values are affected by different choices of b-values and there is currently no standard method for ADC calculation in prostate MR imaging, this study aimed to compare the diagnostic performance of ADC values obtained from different pairs of b-values in prostate cancer detection.
Material and methods
Patients
This study was approved by the institutional Human Ethics Board, and written informed consent was obtained from all patients. Between April 2017 and February 2018, 63 consecutive patients with abnormal digital rectal examination (DRE) findings and raised serum prostate-specific antigen (PSA) level (≥ 4 ng/ml) were enrolled for MRI of the prostate before systematic 12-core transrectal ultrasound-guided prostate biopsies. Four patients were excluded from this study due to excessive motion artifacts on the DW images. Finally, 59 patients aged from 45 to 72 years with a median PSA level of 9.49 ng/ml (range, 3.2-28.0 ng/ml) remained in our study for image analysis.
Magnetic resonance imaging
MRI of the pelvis was performed on a 1.5-T Siemens (Magnetom Essenza, Siemens Medical Systems, Erlangen, Germany) whole-body scanner using a 6-channel pelvic phased-array surface coil. No bowel preparation was performed. All patients underwent MRI protocols, including T2-weighted fast spin-echo in the axial and sagittal plane and axial DWI. The parameters of T2-weighted images were as follows: in-plane resolution 0.57 × 0.57 mm2; repe-tition time (TR), 3500-3900 ms; echo time (TE), 100-110 ms; slice thickness 4 mm and interslice gap 0.5 mm; field of view 250 × 250 mm2; and flip angle 150°.
Axial DWI with 7 b-values ranging from 0 to 1600 s/mm2 (b = 0, 50, 150, 400, 800, 1200, and 1600 s/mm2) was performed using a fat-suppressed single-shot echo-planar imaging sequence with repetition time (TR) 4100 ms; echo time (TE) 105 ms; slice thickness 4 mm and interslice gap 0.5 mm; field of view 230 × 230 mm2; number of scan average (NSA) 6; acquisition matrix 110 × 110; parallel imaging factor 2; receiver bandwidth 1388 Hz/voxel; and EPI factor 70.
Image analysis and ADC calculation
ADC values of defined malignant lesions and contralateral healthy tissues were investigated using region of interest (ROI)-based measurements. MR images were interpreted and analysed by one experienced radiologist who was aware of the pathological results. The location of each peripheral-zone (PZ) lesion was defined based on pathologic findings obtained through (TRUS)-guided prostate biopsies, and then ROIs were drawn manually around lesions and contralateral healthy tissues on the ADC maps. The location of cancer foci that were not visible in MR images was determined using other identifiable landmarks (e.g. urethra). Abnormal benign conditions such as prostatic hyperplasia were not considered as contralateral healthy tissue. ROIs were copied from ADC maps to DW images to ensure that the signal intensity of the same regions in different DW images was measured, assuming that there was no patient motion.
The signal intensities of ROIs drawn on the DW images were measured for each b-value, and the ADC values were calculated using monoexponential fitting of the measured signal intensity in the DW images against the corresponding b-values. ADC calculation with only 2 b-values (e.g. b = 0 and 150 mm2/s, b = 50 and 400 mm2/s, and so on) was performed using the following simplified equation:
where S1 and S2 are the signal intensities of DW images with DW factors of b1 and b2, respectively.
Statistical analysis
Mean and standard deviations (SD) of ADC values were calculated for malignant lesions and noncancerous tissues using different combinations of b-values. The differences in ADC values between malignant lesions and contralateral healthy tissues were evaluated. The Mann-Whitney test was utilized when the distribution of ADC values was not normal, while the paired-sample t-test was used when ADC values were normally distributed. The Kolmogorov-Smirnov test was used to assess the normal distribution of data.
To evaluate the diagnostic efficiency of the different b-value combinations for prostate cancer detection, receiver operating characteristic (ROC) analysis was performed to calculate the area under the curve (AUC) values for each b-value pair.
All statistical analyses were performed with statistics software (SPSS, version 17) for Microsoft Windows, and the statistical significance was set at p < 0.05.
Results
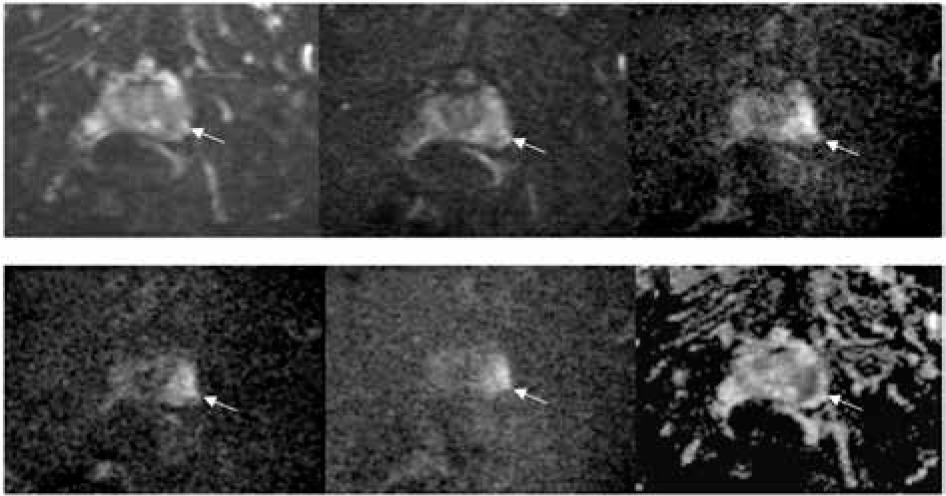
Of the 59 consecutive patients, 31 had malignant lesions in the peripheral zone. At histopathologic analysis, 45 tumour foci were identified in the TRUS-guided prostate biopsy specimens of these patients. A representative malignant prostate lesion that is depicted in DW images with various DW factors and the corresponding ADC map is shown in Figure 1.
Figure 1
A 67-year-old patient with prostate-specific antigen (PSA) level of 16.91 ng/ml. A) Axial diffusion-weighted image (b = 0 s/mm2) demonstrates low signal intensity area (arrow) within the peripheral zone of the prostate. B) Axial diffusion-weighted image (b = 400 s/mm2) shows no abnormality in signal intensity in the peripheral zone of the prostate. C) Axial diffusion- weighted image (b = 800 s/mm2) shows a slight increase in signal intensity (arrow) in the peripheral zone of the prostate. D) Axial diffusion-weighted image (b = 1200 s/mm2). E) Axial diffusion-weighted image (b = 1600 s/mm2) demonstrates a hyperintense signal area (arrow), which represents a malignant lesion. F) The corresponding calculated ADC map shows a low signal intensity area (arrow) in the left peripheral zone
A total of 97 ROIs including 45 ROIs from PZ prostate cancer and 48 ROIs from contralateral healthy tissues was drawn (in 2 patients a contralateral healthy PZ region was not present). The mean ADC value for each ROI was calculated from different b-value pairs using the monoexponential model.
The choice of b-values had a significant effect on the absolute values of ADC in both cancerous and contralateral healthy tissues. The ADC values resulting from b-value pairs that contained a minimum b-value of 0 s/mm2, compared to those using a higher minimum b-value, were higher for all tissues. Also, the mean ADC values tended to decrease with increasing the maximum b-values in both cancerous and contralateral healthy tissues.
The differences between mean ADC values of malignant lesions and contralateral healthy tissues were significant for all the pairs of b-value combinations (Table 1). The mean ADC values of all malignant lesions were lower than contralateral healthy tissues for different b-value pairs.
Table 1
Comparison of ADC values calculated from different pairs of b-values between malignant lesions and contralateral healthy tissues
To evaluate the diagnostic efficiency of ADC values calculated from different b-value pairs in peripheral-zone prostate cancer detection, ROC analysis was performed. The AUC, ADC cut-off, sensitivity, and specificity values calculated for all b-value pairs are reported in Table 2.
Table 2
Diagnostic performance of the ADC values calculated from different pairs of b-values
The AUCs of the ADC values from different b-value pairs that contained a minimum b-value of 0 and 50 s2/mm and maximum b-value of 800, 1200, and 1600 s/mm2 were significantly higher than others. The best pair of b-values (50, 1200) provided the highest AUC (0.94), with a sensitivity of 90.2%, a specificity of 92.6%, and an accuracy of 91.2% at an ADC cut-off of 1.23 × 10⁻³ mm2/s.
Discussion
Restriction of water molecule movement results in decreased ADC values generated from DW images. Because prostate cancer tissue has a higher cellular density and destroyed glandular structure at histopathological examination, many studies have investigated the utility of DWI for prostate cancer detection and characterization [6,11-15]. Previous studies have investigated the influence of b-value combinations on the ADC value calculated from a monoexponential diffusion model [5,6,16,17]. Although we have reproduced these findings at 1.5 T, the combination of b-values was different from previous studies. It has been reported that the use of more than 2 b-values in the ADC calculation has no significant effect on the diagnostic value of ADC and only increases the scanning time; therefore, in this study, only pairs of b-values were investigated. The differences between ADC values of healthy and cancerous tissues were significant. However, these differences were lower for b-value combinations with the maximum b-value of 400 s/mm2 (0, 400 and 50, 400). On the other hand, mean ADC values calculated from b = 0, 400, and b = 50, 400 increased in both malignant lesions and contralateral healthy tissues and were associated with larger variations compared with ADC values estimated from other pairs of b-values. As a result, the diagnostic performance of ADC values calculated from low b values for differentiation of prostate cancer and contralateral healthy tissue was reduced. This was expected because the ADC values calculated from low b-value DW images represent either the extravascular molecular diffusion and the perfusion characteristics of biological tissues.
The results of our study demonstrate that b-value combinations can significantly influence estimated ADC values, in agreement with previous studies [8,17,18]. The mean ADC values calculated in our study are comparable with previous studies for similar b-value combinations [8,17].
In this study, the effect of each b-value pair on the diagnostic performance of the corresponding ADC values in prostate cancer detection was evaluated. The best b-value pair was b = 50, 1200 because, using a cut-off value of 1.23 × 10⁻³ mm2/s, it showed the highest AUC (0.94), with a sensitivity of 90.2%, a specificity of 92.6%, and an accuracy of 91.2%. In a similar study, Adubeiro et al. reported AUC ranging from 90.0% to 96.0% in the 35 b-value combinations [19]. The best pair of b-values for ADC quantification (50, 2000 s/mm2) showed the highest AUC (96.0%) with a sensitivity of 95.5%, a specificity of 93.2%, and an accuracy of 94.4%, at a cut-off of 0.89 × 10⁻³ mm2/s. In this study for the same b-value pairs (50, 800 and 150, 800) lower AUCs (0.93 and 0.9, respectively) were obtained. Adubeiro et al. used a 3-Tesla clinical MR scanner equipped with a 32-channel phased-array coil with the advantage of a higher SNR, which leads to an increase in diagnostic performance.
Our results demonstrate that the ADC cut-off value for differentiation of prostate cancer and contralateral healthy tissue is substantially affected by the b-value combinations (Table 2). Therefore, it is not possible to select a fixed optimal ADC cut-off value for different pairs of b-values, and an optimal ADC cut-off value had to be selected for each b-value pair.
Our study had some limitations. First, the sample population is relatively small. A larger population of patients with a wider range of cancer grades is needed for further evaluation. Second, we used the systematic biopsy for validating our imaging. Due to the low sensitivity of TRUS-guided biopsy, some patients with negative biopsy may have had cancer. However, this approach is acceptable here because our primary goal was to investigate the influence of the choice of the b values and not the correlation between MRI lesions and pathologic findings. Although the use of the radical prostatectomy as a reference standard could provide a more accurate differentiation between lesions and contralateral healthy tissue, this approach is associated with patient selection bias. Third, in the current study, it was not possible to use an endorectal coil. The use of an endorectal coil improves image quality and prostate cancer localization. Finally, there was no exact correspondence between the MRI finding and the biopsy results because MRI-guided biopsies were not performed.
Conclusions
This study demonstrated that using a 1.5-Tesla MRI scanner the diagnostic performance of ADC values estimated from b-value pair 50, 1200 s/mm2 was highest with a sensitivity, specificity, and diagnostic accuracy of 90.2%, 92.6%, and 91.2%, respectively, at an ADC cut-off of 1.23 × 10⁻³ mm2/s. However, some other b-value pairs provided statically comparable diagnostic performance.