

Introduction
Prevention of inflammation as well as minimizing early and late effects of an inflammatory response are an important component in the therapy of many human and animal diseases and disorders. Non-steroidal anti-inflammatory drugs (NSAIDs) play an enormous role in the management of inflammatory diseases and as analgesics and antipyretics. The major mechanism of action of NSAIDs is through the inhibition of the synthesis of proinflammatory prostaglandin (PG), specifically PGE2 via blocking cyclooxygenase (COX) at sites of inflammation [1]. There are two COX isoforms: COX-1 and COX-2. In the traditional view, COX-1 is constitutively expressed in most tissues and has important roles in tissue homeostasis, particularly in the stomach and kidneys as well as in blood clotting [1], whereas COX-2 is a predominantly inducible enzyme, expressed at sites of inflammation, infection and cancer that generates prostanoids, which drive disease pathogenesis [2]. Therefore, it has been commonly thought that the antiinflammatory action of NSAIDs mainly arises from the inhibition of COX-2, whereas their unwanted side effects are largely attributed to the inhibition of COX-1. However, COX-2 is also constitutively expressed and plays a physiological role in many tissues and organs [3], while COX-1 is also involved in inflammatory reactions [4]. On the basis of their inhibitory activity on COX-1 and COX-2, at least three major classes of NSAIDs can be distinguished: 1) preferential COX-1 inhibitors, 2) non-selective COX inhibitors, and 3) selective COX-2 inhibitors [5].
NSAIDs are a principal group of drugs administered to alleviate symptoms of inflammation which occur in the course of various bacterial or viral infections in humans and animals. It is widely held that the administration of these medications does not significantly influence the immune response to infection, and therefore does not compromise the treatment of an infection. Although NSAIDs are popular all across the world, their effect on T cells has not been as thoroughly investigated as it might have been expected. CD4+ and CD8+ T cells are key players in cell-mediated immune protection of the body, providing a highly efficient defence against viral and bacterial infection. IL-2 is a pleiotropic cytokine, which plays pivotal roles in orchestrating immune responses. This cytokine can act both in an autocrine and paracrine fashion by binding to IL-2R [6]. Three distinct receptor chains have been identified as components of IL-2R: α (IL-2α, CD25), β (IL-2β, CD122) and γ (IL-2γ, CD132) chains. IL-2R may exist in three functional forms: the monomeric low-affinity receptor (CD25+CD122–CD132–), the dimeric intermediate-affinity receptor (CD25–CD122+CD132+), and the trimeric high affinity receptor (CD25+CD122+CD132+); however, only the two latter ones are functional receptor forms [7]. The dimeric intermediate-affinity receptor is expressed by naive and memory CD4+ and CD8+ T cells [6]. In turn, the trimeric high affinity receptor is expressed on recently activated T cells [7]. A critical point in the development of an immune response is the activation of T lymphocytes, which requires IL-2 binding to its high-affinity IL-2R for optimal signalling. Thus, the CD25 molecule is needed for the high affinity binding of IL-2 to effector cells and is potently induced after T cell activation. Perusal of the available literature has shown a shortage of research on the effect of NSAIDs on CD25 expression on CD4+ and CD8+ T cells during their activation. In our previous investigations [8-11], we evaluated the influence of meloxicam (a NSAID) on the expression of CD25 by bovine peripheral blood T cells, but our research only dealt with constitutive, and not with activation-induced, expression. These studies demonstrated that the drug significantly down-regulated CD25 expression on CD4+, CD8+ and WC1+ T cells, although the effect did not manifest itself very strongly. In turn, other investigators [12] found that ibuprofen and naproxen, but not indomethacin, piroxicam and sulindac, interfered with the binding of IL-2 to T cells and significantly inhibited the proliferative response of T cells to this cytokine. In the light of these findings, a hypothesis was put forth, suggesting that NSAIDs can inhibit CD25 expression during T cells activation, thus making these cells less responsive to IL-2. The current study has been dedicated to the verification of this hypothesis under in vitro conditions. There are certain implications found in the literature suggesting that differences between NSAIDs with respect to their affinity to COX may impinge on the effect of these drugs on CD25 expression [13]. Considering the above as well as the fact that various classes of NSADs distinguished with respect to their affinity to COX-1 and COX-2 are used in medicine, this research focused on the effects of a preferential COX-1 inhibitor (acetylsalicylic acid – ASA), non-selective COX inhibitor (ketoprofen – KET) and selective COX-2 inhibitor (robenacoxib – ROB) on the CD25 expression on mitogen-activated murine CD4+ and CD8+ T cells. However, CD25 molecule is not exclusively the marker of T cell activation because natural and induced Foxp3 (Forkhead Box P3 protein)-expressing CD25+CD4+ regulatory T cells (Treg cells) are well known in humans and mice [14]. In the case of activated effector T cells, the CD25 expression is inducible, i.e. it occurs transiently during the activation of these cells [7], whereas Treg cells express this molecule constitutively [14]. Similarly to CD4+ T cells, natural and induced Foxp3+CD25+ Treg cells are also present within the pool of CD8+ T cells [15, 16]. Thus, in order to investigate the effect of NSAIDs on the CD25 expression on effector CD4+ and CD8+ T cells, it was necessary to distinguish them from CD25-expressing Treg cells. Foxp3 currently represents the most often used marker to distinguish activated effector T (aTeff) cells (Foxp3–CD25+CD4+ and Foxp3–CD25+CD8+ cells) from Treg cells (Foxp3+CD25+CD4+ and Foxp3+CD25+CD8+ cells); the CD25–CD4+ and CD25–CD8+ phenotypes represent mostly resting T (Trest) cells [17-19].
Material and methods
Animals
Female 8-week-old female BALB/c mice were purchased from the Institute of Experimental and Clinical Medicine of the Polish Academy of Sciences in Warsaw. The mice were maintained under standard lab conditions (12/12 h light/dark cycle, controlled temperature [21 ±2°C] and humidity [55 ±5%], and with ad libitum access to food and water) in the Animal Laboratory of the Faculty of Veterinary Medicine, University of Warmia and Mazury in Olsztyn. The mice were housed and treated in accordance with the rules of the Local Ethics Commission for Animal Experiments in Olsztyn. Law in Poland (Act of 15 January 2015 on the Protection of Animals Used for Scientific or Educational Purposes) does not require a permit from an ethics commission to conduct experiments in which samples for research are obtained post mortem from animals not submitted to any procedure while alive. Mice were euthanized by asphyxiation with CO2.
Isolation of lymphocytes and culture conditions
Head and neck lymph nodes and axillary lymph nodes were removed and subjected to dounce homogenization. The resulting cell suspensions were filtered through 70 μm cell strainer (BD Biosciences, San Jose, USA) and washed (300 × g for 5 min. at 5°C; the same parameters were used for all cell-washing procedures) with complete medium CM; RPMI 1640, 10% FBS, 10 mM HEPES buffer, 10 mM nonessential amino acids, 10 mM sodium pyruvate and 10 U/ml penicillin/streptomycin (all from Sigma-Aldrich, Munich, Germany). Cells were adjusted to a final concentration of 2.5 × 10⁶ cells/ml in CM and seeded in 24-well plates in 1 ml aliquots and incubated for 12 h in the absence (negative – NEG CON and positive controls – POS CON, i.e. non-stimulated and stimulated cells, respectively) or presence of ASA (Sigma-Aldrich) or KET (Sigma-Aldrich) or ROB (Toronto Research Chemicals Inc., Toronto, Canada). For all experiments, cells were treated with drugs in concentrations reflecting their plasma levels achieved in vivo at therapeutic doses (ASA 10–4 M [20], KET 10–5 M [21] and ROB 10–6 M [22]) and in ten-fold lower concentrations. Subsequently, cells were activated (with the exception of NEG CON) with concanavalin A (Con A; 5 μg/ml; Sigma-Aldrich) for 6 h. Drugs were dissolved in dimethyl sulfoxide (DMSO) and adequate volume of the solvent was added to control wells; all wells contained the same amount of DMSO (0.1% [v/v]). Each experiment included 6 wells of lymphocytes (obtained from individual mice) for each condition tested. All experiments were repeated independently two times, using 6 different animals for each experiment (overall n = 12). The plates were incubated at 37°C in an atmosphere of humidified incubator with 5% CO2 and 95% air.
Flow cytometry
Extracellular staining
After 6 h incubation, cells were removed from the wells by pipetting and rinsing with FACS buffer (FB; 1× Dulbecco’s PBS [Sigma-Aldrich] devoid of Ca2+ and Mg2+ with 2% [v/v] heat-inactivated FBS) and transferred into individual tubes and centrifuged. After additional washing in 1 ml FB, the cells were re-suspended in FB and stained for surface antigens with fluorochrome conjugated monoclonal antibodies (mAbs): FITC rat anti-mouse CD4 (clone H129.19, IgG2a, κ), APC-Cy7 rat anti-mouse CD8a (clone 53-6.7, IgG2a, κ) and PE-Cy7 rat anti-mouse CD25 (clone PC61, IgG1, λ; all mAbs from BD Biosciences). After 30 min incubation (on ice and in the dark), the cells were washed in 1 ml FB.
Intracellular staining for Foxp3
Following surface staining, cells were washed, fixed, permeabilized (Mouse Foxp3 buffer set, BD Biosciences), and labeled with PE-conjugated rat anti-mouse Foxp3 mAb (clone MF23, IgG2b, BD Bioscience) as previously described [23].
FACS acquisition and analysis
Flow cytometry analysis was performed using a FACSCanto II cytometer (BD Biosciences). The data were acquired by FACSDiva version 6.1.3 software (BD Biosciences) and analyzed by FlowJo software (Tree Star Inc., Stanford, USA). Unstained and single fluorochrome-stained samples were used to set fluorochrome compensation levels. Fluorescence minus one staining was used to confirm the gating strategy used to identify CD25- and Foxp3-expressing cells. Absolute cell counts of lymphocyte subsets (i.e. number of cells from a particular subpopulation per sample) were calculated using the dual platform method, i.e. the absolute cell count was determined by calculating the data obtained from a cell counting chamber (the total number of cells in the well) by the percentage of particular cell subsets (the data from flow cytometric immunophenotyping).
Statistical analysis
All data are presented as the mean ±SD. Student’s unpaired t test was used to compare the results between ASA- or KET- or ROB-treated (at either concentration) and POS CON cells and between NEG CON and POS CON cells. A p-value less than 0.05 was considered to be statistically significant. The data were graphed with Sigmaplot software (version 12, Systat Software, Inc., Chicago, USA).
Results
Effect of NSAIDs on the percentage and absolute count of CD25+CD4+, CD25–CD4+, Foxp3+CD25+CD4+ and Foxp3–CD25+CD4+ T cells
It has been established that in the presence of Con A there was an increase in the percentage and absolute count of CD25+CD4+ T cells (Figs. 1A and A’) as well as a considerable reduction in the absolute count of CD25–CD4+ T cells (Fig. 1B’) compared to non-stimulated cells. The exposure of cells to Con A significantly raised the percentage and absolute count of Foxp3–CD25+CD4+ T cells (Figs. 2B and B’), but it did not affect the absolute count of Foxp3+CD25+CD4+ T cells (Fig. 2A’). These results prove that Con A induced expression of CD25 on CD25–CD4+ T cell but had no effect on the expression of Foxp3 and, consequently, on the count of Foxp3+CD25+CD4+ T cells.
Fig. 1
The effect of NSAIDs on the relative and absolute counts of CD25+CD4+ and CD25-CD4+ T cells. Lymphocytes isolated from selected lymph nodes were incubated for 12 h in the absence (positive control [POS CON]) or presence of acetylsalicylic acid (ASA 10-4 M and ASA 10-5 M) or ketoprofen (KET 10-5 M and KET 10-6 M) or robenacoxib (ROB 10-6 M and ROB 10-7 M) followed by 6 h stimulation with concanavalin A. Lymphocytes incubated in the medium alone served as negative controls (NEG CON). The relative count is expressed as a percentage of CD25-expressing and non-expressing cells within the CD4+ T cell subset (A and B). The absolute count represents the number of CD25+CD4+ and CD25-CD4+ T cells per sample (A’ and B’), which was obtained from lymphocytes cultured at cell density of 2.5 × 10⁶ cells/ml. Results are the mean (±SD) of two independent experiments with six animals per experiment (n = 12). *p < 0.05, **p < 0.01, ***p < 0.001, NEG CON vs. POS CON, and treated cells vs. POS CON. Dot plot cytograms show the expression of CD25 within the CD4+ T cell population (C)
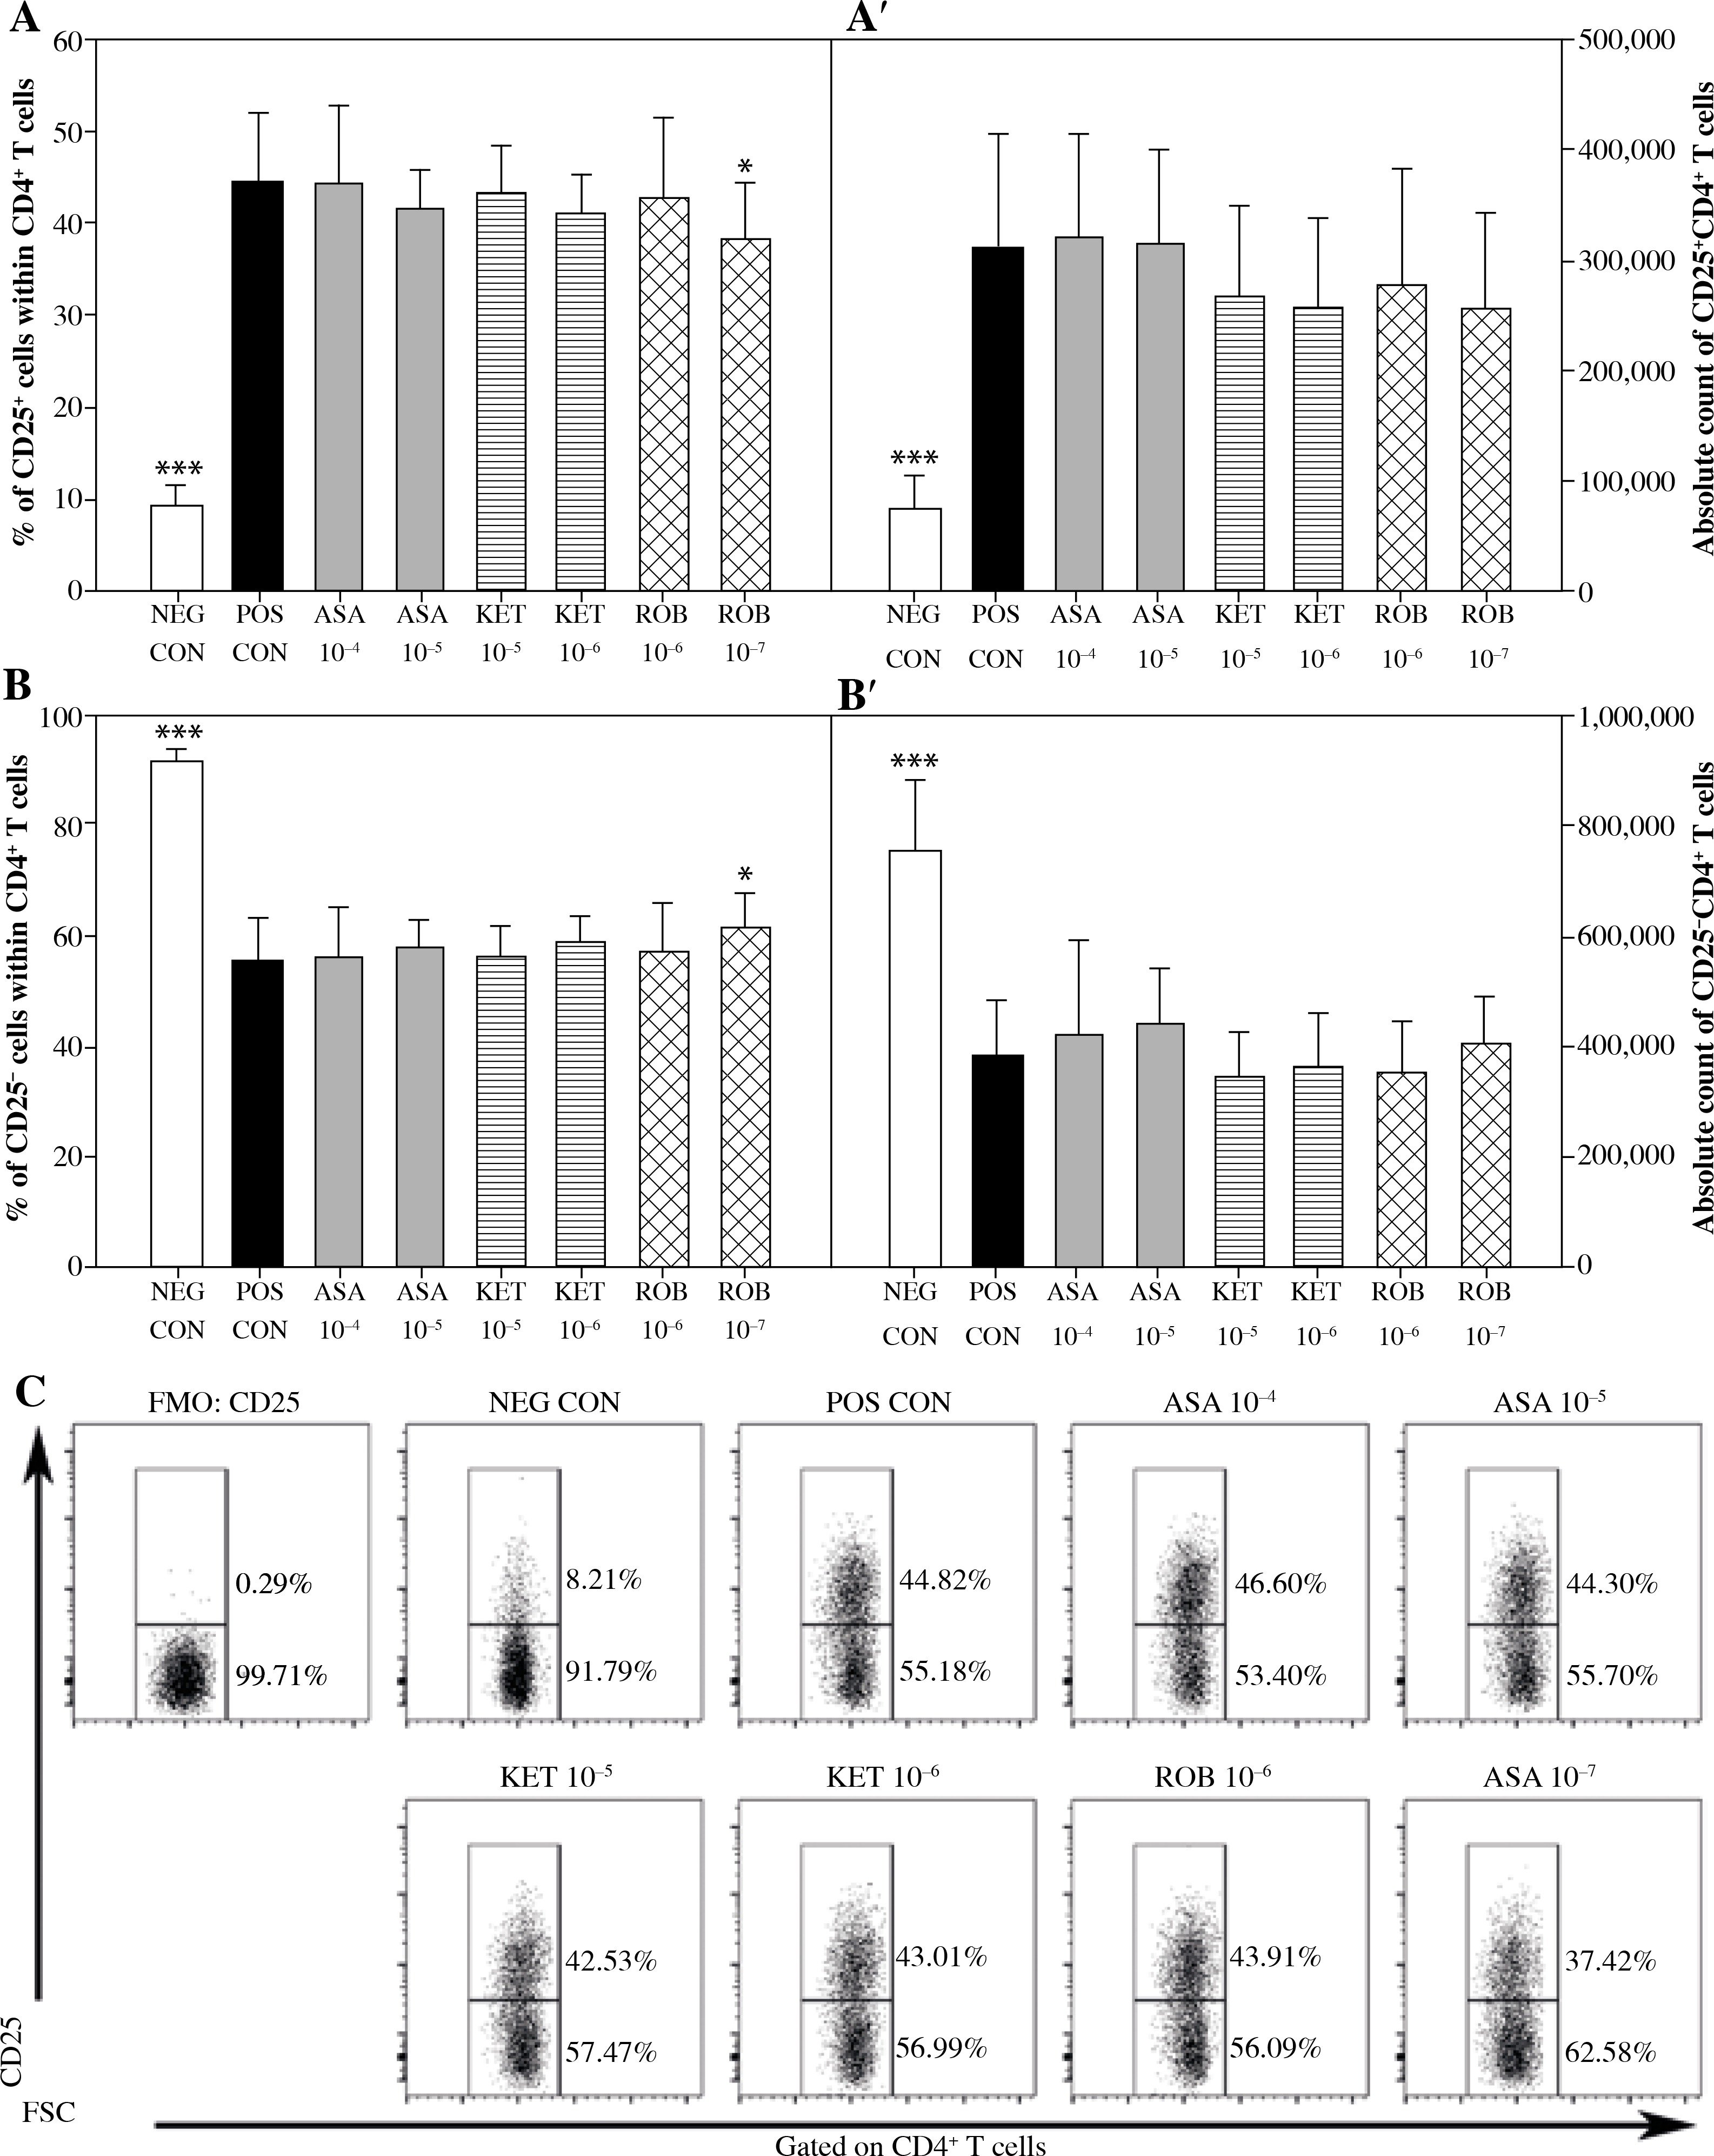
Fig. 2
The effect of NSAIDs on the relative and absolute counts of Foxp3+CD25+CD4+ and Foxp3-CD25+CD4+ T cells. Lymphocytes isolated from selected lymph nodes were incubated for 12 h in the absence (positive control [POS CON]) or presence of acetylsalicylic acid (ASA 10-4 M and ASA 10-5 M) or ketoprofen (KET 10-5 M and KET 10-6 M) or robenacoxib (ROB 10-6 M and ROB 10-7 M) followed by 6 h stimulation with concanavalin A. Lymphocytes incubated in the medium alone served as negative controls (NEG CON). The relative count is expressed as a percentage of Foxp3-expressing and non-expressing cells within the CD25+CD4+ T cell subset (A and B). The absolute count represents the number of Foxp3+CD25+CD4+ and Foxp3-CD25+CD4+ T cells per sample (A’ and B’), which was obtained from lymphocytes cultured at cell density of 2.5 × 10⁶ cells/ml. Results are the mean (±SD) of two independent experiments with six animals per experiment (n = 12). *p < 0.05, **p < 0.01, ***p < 0.001, NEG CON vs. POS CON, and treated cells vs. POS CON. Dot plot cytograms show Foxp3-expressing cells within the CD25+CD4+ T cells subset (C)
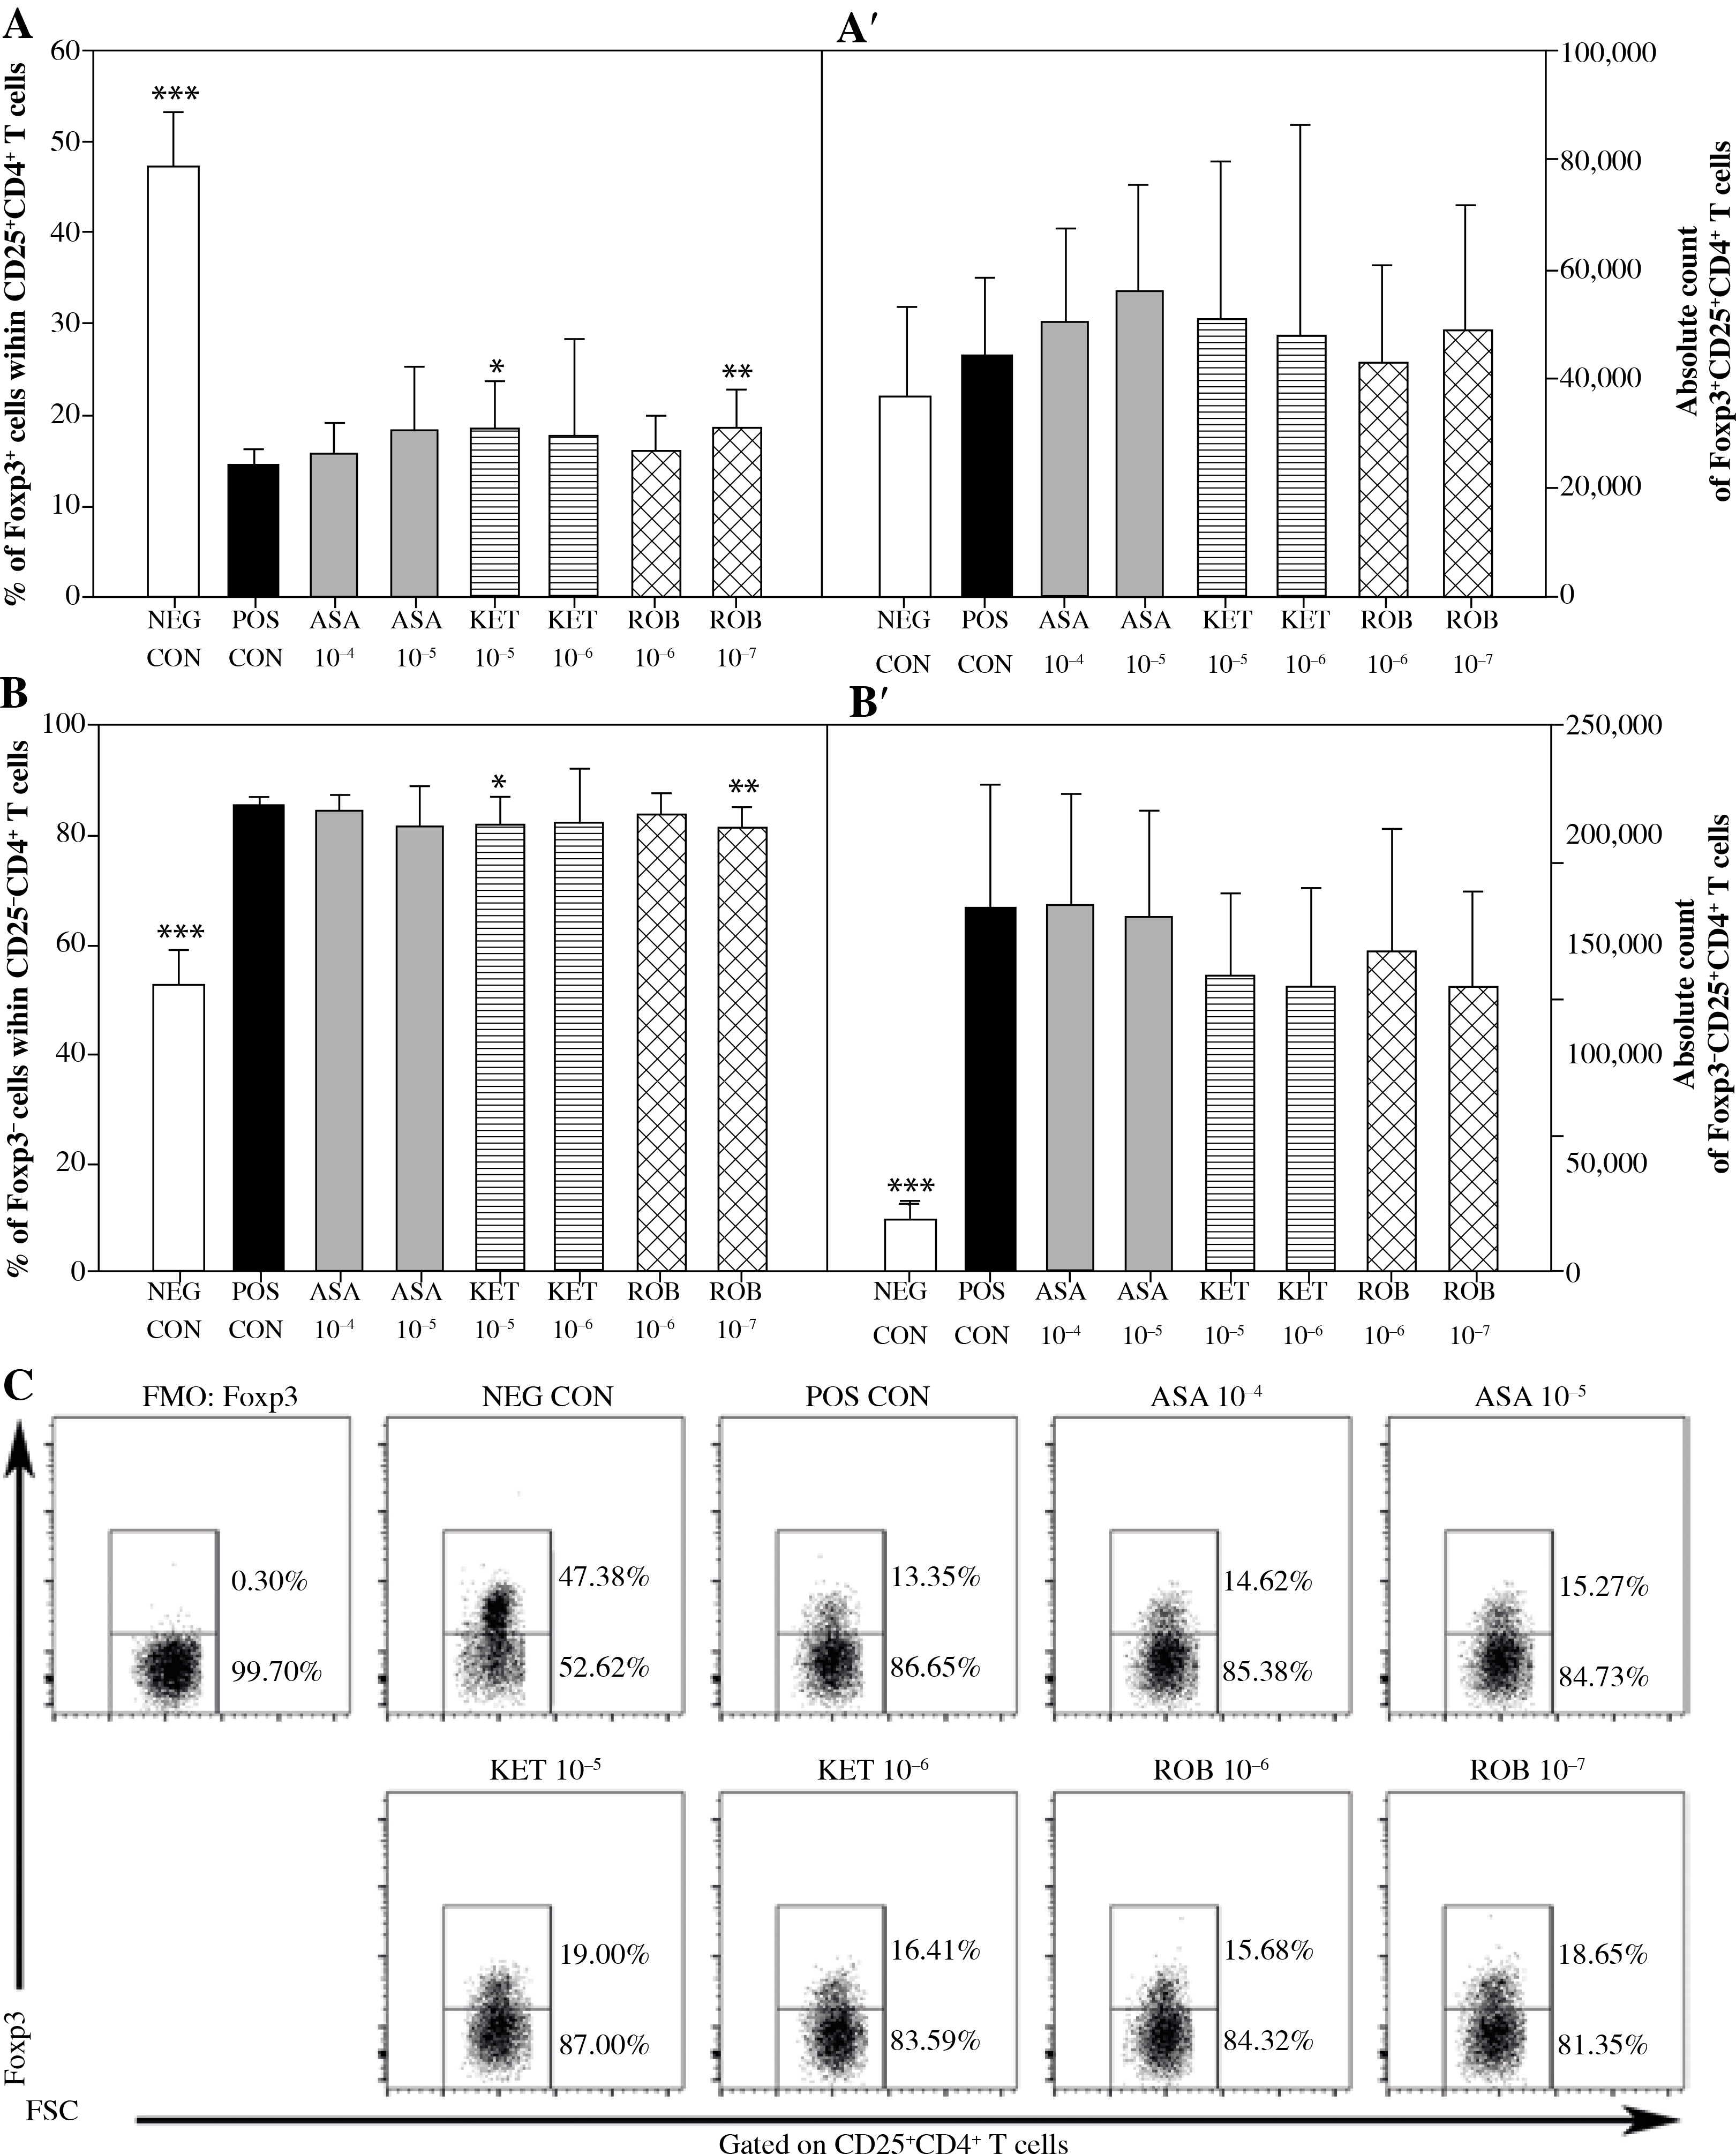
No significant influence of ASA or KET 10–6 M on any of the assessed parameters concerning CD4+ T cells was determined (Figs. 1 and 2). The exposure to KET 10–5 M caused a significant increase in the percentage of Foxp3+ cells within the CD25+CD4+ T cell subset (Fig. 2A), but unlike ROB–7 M, this change was not accompanied by a decrease in the percentage of CD25+cells among CD4+ T cells (Fig. 1A).
It has been found that there was a reduction in the percentage of CD25+ cells among the CD4+ cell population in cultures treated with ROB 10–7 M (Fig. 1A), although the drug was not demonstrated to have affected the absolute count of CD25+CD4+ and CD25–CD4+ T cells (Figs. 1A’ and B’). The above coincided with a significant increase in the percentage of Foxp3+ cells among CD25+CD4+ T cells (Fig. 2A). However, no significant effect of ROB 10–7 M on the absolute count of Foxp3+CD25+CD4+ and Foxp3–CD25+CD4+ T cells was observed (Figs. 2A’ and B’). Interestingly, ROB applied in the higher concentration was found to have no influence on any of the assessed parameters regarding CD4+ T cells (Figs. 1 and 2).
Effect of NSAIDs on the percentage and absolute count of CD25+CD8+, CD25–CD8+, Foxp3+CD25+CD8+ and Foxp3–CD25+CD8+ T cells
The exposure of cells to Con A considerably increased the percentage and absolute count of CD25+CD8+ cells (Figs. 3A and A’), but decreased the absolute count of CD25–CD8+ cells (Fig. 3B’). This was accompanied by a significant increase in the percentage of Foxp3+ cells within the CD25+CD8+ cell subset (Fig. 4A) and a significant increase in the absolute count of Foxp3+CD25+CD8+ and Foxp3–CD25+CD8+ T cells (Figs. 4A’ and 4B’). These results prove that Con A induced the expression of CD25 on Foxp3–CD25–CD8+ cells, hence leading to the activation of effector cells. These results also demonstrate that this mitogen raised the expression of Foxp3 in Foxp3–CD8+ T cells, suggesting that it could have generated CD8+ Treg cells.
Fig. 3
The effect of NSAIDs on the relative and absolute counts of CD25+CD8+ and CD25-CD8+ T cells. Lymphocytes isolated from selected lymph nodes were incubated for 12 h in the absence (positive control [POS CON]) or presence of acetylsalicylic acid (ASA 10-4 M and ASA 10-5 M) or ketoprofen (KET 10-5 M and KET 10-6 M) or robenacoxib (ROB 10-6 M and ROB 10-7 M) followed by 6 h stimulation with concanavalin A. Lymphocytes incubated in the medium alone served as negative controls (NEG CON). The relative count is expressed as a percentage of CD25-expressing and non-expressing cells within the CD8+ T cell subset (A and B). The absolute count represents the number of CD25+CD8+ and CD25-CD8+ T cells per sample (A’ and B’), which was obtained from lymphocytes cultured at cell density of 2.5 × 10⁶ cells/ml. Results are the mean (±SD) of two independent experiments with six animals per experiment (n = 12). *p < 0.05, **p < 0.01, ***p < 0.001, NEG CON vs. POS CON, and treated cells vs. POS CON. Dot plot cytograms show CD25-expressing cells within the CD8+ T cell subset (C)
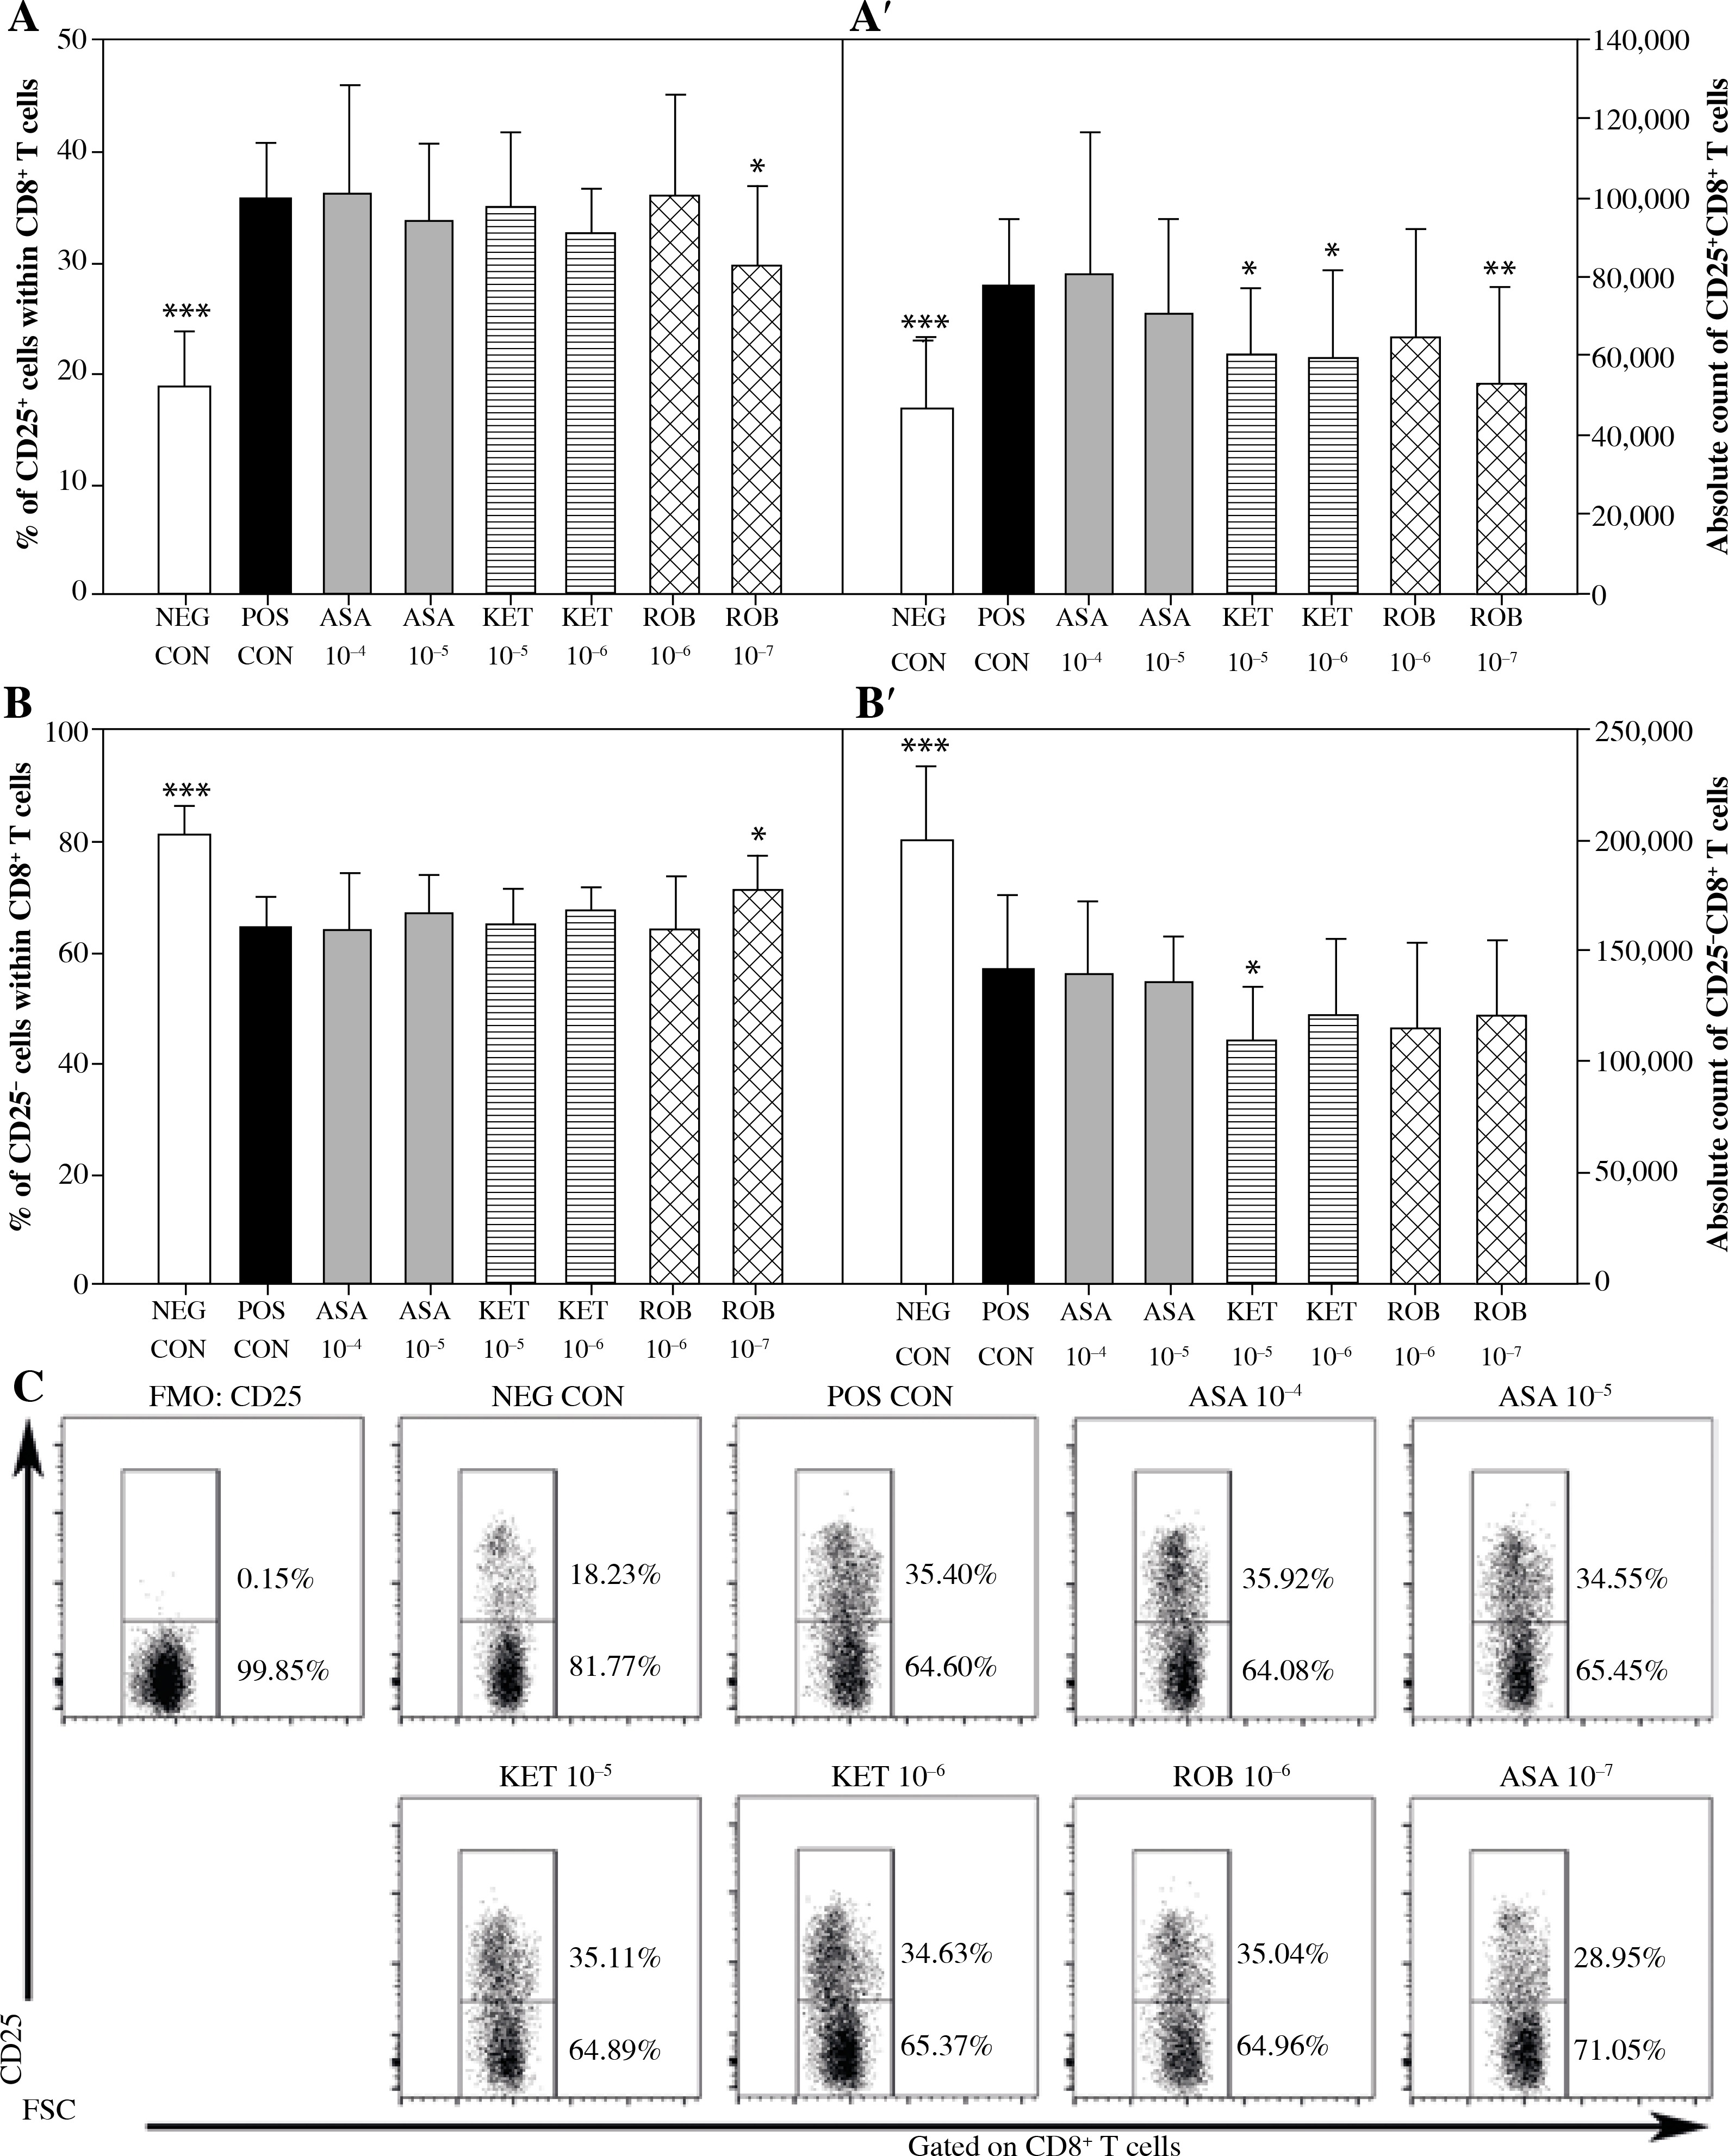
Fig. 4
The effect of NSAIDs on the relative and absolute counts of Foxp3+CD25+CD8+ and Foxp3-CD25+CD8+ T cells. Lymphocytes isolated from selected lymph nodes were incubated for 12 h in the absence (positive control [POS CON]) or presence of acetylsalicylic acid (ASA 10-4 M and ASA 10-5 M) or ketoprofen (KET 10-5 M and KET 10-6 M) or robenacoxib (ROB 10-6 M and ROB 10-7 M) followed by 6 h stimulation with concanavalin A. Lymphocytes incubated in the medium alone served as negative controls (NEG CON). The relative count is expressed as a percentage of Foxp3-expressing and non-expressing cells within the CD25+CD8+ T cell subset (A and B). The absolute count represents the number of Foxp3+ CD25+CD+ and Foxp3-CD25+CD8+ T cells per sample (A’ and B’), which was obtained from lymphocytes cultured at cell density of 2.5 × 10⁶ cells/ml. Results are the mean (±SD) of two independent experiments with six animals per experiment (n = 12). *p < 0.05, **p < 0.01, ***p < 0.001, NEG CON vs. POS CON, and treated cells vs. POS CON. Dot plot cytograms show Foxp3-expressing cells within the CD25+CD8+ T cell subset (C)
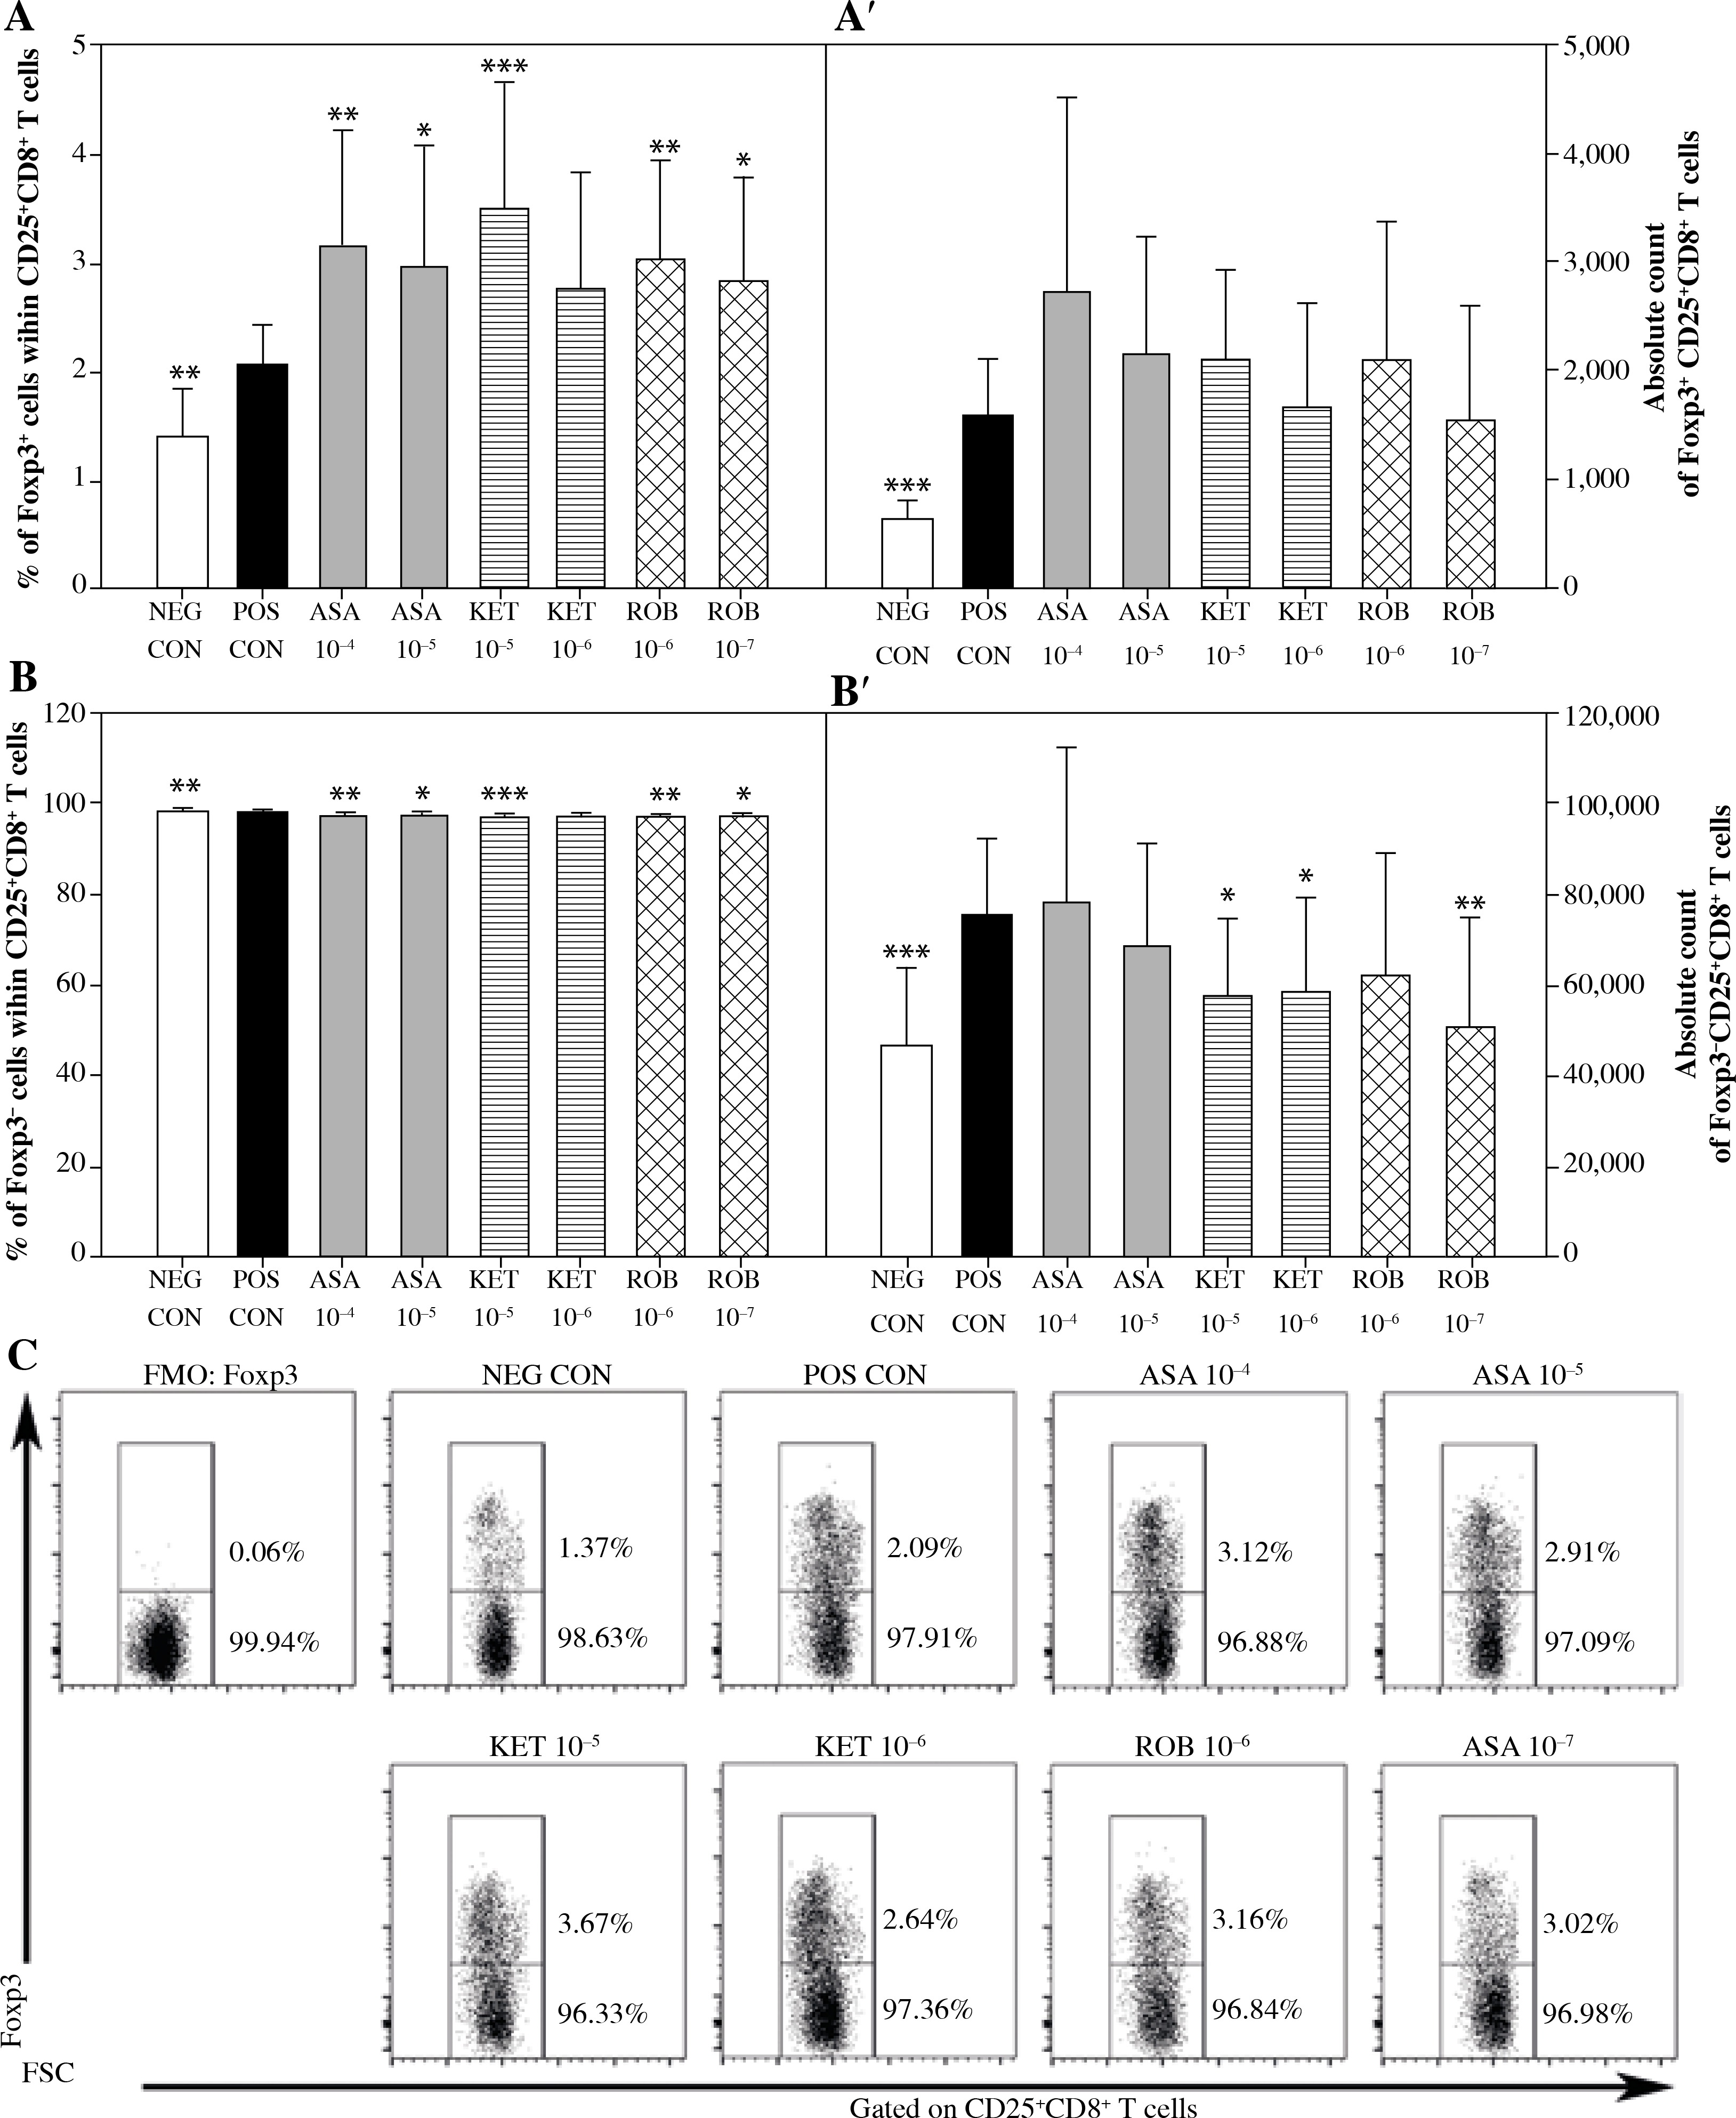
No effect of ASA on the percentage or absolute count of CD25+CD8+ and CD25–CD8+ T cells was demonstrated (Fig. 3). However, it was found that the exposure to this drug caused a significant increase in the percentage of Foxp3-expressing cells within CD25+CD8+ T cell subset (Fig. 4A). This was not accompanied by a statistically significant change in the absolute count of Foxp3+CD25+CD8+ or Foxp3–CD25+CD8+ T cells (Figs. 4A’ and 4B’).
Significant reduction in the absolute count of CD25+CD8+ cells occurred in cultures exposed to the action of KET in both of the applied concentrations (Fig. 3A’); KET in the concentration of 10–5 M, but not in the lower one, caused a decrease in the absolute count of CD25–CD8+ T cells (Fig. 3B’). These effects were not accompanied by any considerable changes in the percentage of CD25-expressing CD8+ T cells (Figs. 3A and B). In addition, it was demonstrated that the exposure to KET 10–5 M led to a significant increase in the percentage of Foxp3+ cells within CD25+CD8+ T cell subset (Fig. 4A), but had no influence on the absolute count of Foxp3+CD25+CD8+ T cells (Fig. 4A’). The drug in both concentrations tested caused a substantial reduction in the absolute count of Foxp3–CD25+CD8+ T cells (Fig. 4B’).
The exposure to ROB 10–7 M lowered the percentage and absolute count of CD25+CD8+ T cells (Figs. 3A and A’), but had no effect on the absolute count of CD25–CD8+ T cells (Fig. 3B’). This drug, in both of the applied concentrations, increased the percentage of Foxp3+ cells (Fig. 4A). This was not accompanied by a change in the absolute count of Foxp3+CD25+CD8+ T cells (Fig. 4A’), although it was found that the exposure of cells to ROB 10–7 M resulted in a considerable decrease in the absolute count of Foxp3–CD25+CD8+ T cells (Fig. 4B’).
Discussion
The main objective of this study has been to determine the effect of NSAIDs – depending on their selectivity to COX-1 and COX-2 – on CD25 expression during the activation of T cells. Because the phenotypes CD25+CD4+ and CD25+CD8+ are shared by aTeff and Treg cells, it was necessary to label Foxp3-expressing cells. Consequently, the research presented in this paper additionally provides some new data on the impact of short-term action of NSAIDs on the expression of Foxp3 and count of CD4+ and CD8+ Treg cells when lymphocytes are activated with the mitogen.
The research has not demonstrated any effect of ASA either on CD4+ T cells as regards the analyzed parameters, or on the expression of CD25 on CD8+ T cells. It was found that ASA increased the percentage of Foxp3-expressing cells within CD25+CD8+ T cell subset, but this was not accompanied by a decrease in the absolute count of Foxp3–CD25+CD8+ T cells. Moreover, the absolute count of Foxp3+CD25+CD8+ T cells was distinctly higher in ASA-exposed samples than in the control, although the differences did not prove to be statistically significant. Nevertheless, the overall character of these observations implicates that ASA could have induced the expression of Foxp3 in CD25+CD8+ T cells, which in turn might suggest its potential to generate CD8+ Treg cells. However, the scale of this phenomenon was relatively small. The results suggest that KET might have induced Foxp3 expression as well, but in this case CD4+ T cells were affected. This is pointed out by the fact that the exposure to this drug caused an increase in the percentage of Foxp3+ cells among CD25+CD4+ T cells without accompanying changes in the expression of CD25 or the absolute count of CD25+CD4+ and CD25–CD4+ T cells. Similarly to ASA, this effect did not manifest itself as a corresponding change in the absolute count of Foxp3+CD25+CD4+ and Foxp3–CD25+CD4+ T cells. The most probable reason was that the observed changes in percentages of cells were very weakly expressed, whereas the standard deviations of means of absolute counts were very high. However, it needs to be mentioned that the average absolute count of Foxp3–CD25+CD4+ T cells in samples treated with KET 10–5 M was distinctly lower than the control values.
The research has shown that the exposure to KET resulted in losses among both CD25+CD8+ and CD25–CD8+ T cells. The degree to which cells from these two subsets decreased in count most clearly was proportionally comparable, which is indicated by the absence of a change in the percentage of CD25+ and CD25– cells within CD8+ T cell subset. The results imply that KET caused a loss of CD8+ aTeff, but did not affect the count of CD8+ Treg cells, which is proven by the fact that the absolute count of Foxp3–CD25+CD8+ T cells was significantly lower than the control values, whereas the absolute count of Foxp3+ CD25+CD8+ T cells did not differ from the control.
ROB had a significant influence on the assessed parameters but interestingly when it was applied in the lower concentration. The higher concentration of this drug had hardly any effect on the analyzed cells. The current state of knowledge does not provide us with an answer which could clarify this finding. The exposure to ROB 10–7 M led to a decrease in the percentage of CD25+ cells on CD4+ T cells, which was not accompanied by a change in the absolute count of the total CD4+ T cell population (data not shown), or in the CD25+CD4+ and CD25–CD4+ T cell subsets. This change was correlated with an increase in the percentage of Foxp3+ cells and a decrease in the percentage of Foxp3– cells within the CD25+CD4+ T cell subset. Thus, these data suggest that the drug reduced the mitogen-induced CD25 expression on CD4+ aTeff cells, and therefore decreased the count of CD4+ aTeff cells. However, this effect of the drug was rather weakly expressed, which is why most probably it was impossible to capture it in absolute counts.
The exposure to ROB 10–7 M also led to a reduced percentage of CD25+ cells within the CD8+ T cell subset, but in this case the above decrease was accompanied by a decline in the absolute count of the CD8+ T cell population (p = 0.035; data not shown). Our further analysis revealed that the drug induced a reduction in the absolute counts of CD25+CD8+ and Foxp3–CD25+CD8+, but not CD25–CD8+ and Foxp3+CD25+CD8+ T cells. These results show that ROB caused a loss among CD8+ aTeff cells. However, it is worth noting that the genesis of ROB-induced reduction in the count of CD4+ and CD8+ aTeff cells seems to be different. In the former case, the decrease was caused exclusively by the inhibition of CD25 expression on CD25–CD4+ T cells, whereas in the latter instance there was an actual loss of Foxp3–CD25+CD8+ T cells (it cannot be excluded that the drug might have additionally reduced the CD25 expression). In a short-term culture situation, this cell loss can only be explained by the proapoptotic action of the tested substance. The exposure to ROB or KET led to an increase in the percentage of Foxp3-expressing cells within the CD25+CD8+ T cell subset. It would be incorrect to claim that these drugs generated the formation of CD8+ Treg cells, because the increase in the percentage of Foxp3+ cells was most evidently an apparent one, i.e. it was due to the decrease in the absolute count of Foxp3–CD25+CD8+ T cells.
The available literature contains scarcely any reports on the effect of NSAIDs on CD25 expression on CD4+ and CD8+ T cells during their activation. Our results are in agreement with the data obtained by Iñiguez et al. [13], who also demonstrated that a preferential COX-1 inhibitor (indomethacin) had no effect on the activation-induced CD25 expression on CD3+ cells, whereas a selective COX-2 inhibitor (NS398) down-regulated it. Furthermore, our previous studies showed that meloxicam, a preferential COX-2 inhibitor, reduced constitutive CD25 expression on bovine CD4+, CD8+ and WC1+ T cells [8-11]. Besides, it was demonstrated that non-preferential COX inhibitors (ibuprofen and naproxen) significantly inhibited the proliferative response of T cells to IL-2, while preferential COX-1 inhibitors (indomethacin and piroxicam) did not alter this response. These results are consistent with the ones discussed herein, because a CD25 molecule is needed for the high affinity binding of IL-2 to aTeff cells [7]. Moreover, the current results referred to in the cited literature suggest that the inhibition of COX-2, and not of COX-1, can lead to reduction in the activation-induced CD25 expression on T cells. Considering the mechanism of action of NSAIDs, such results and conclusions may appear paradoxical, because our earlier studies revealed that PGE2 down-regulated activation-induced CD25 expression on bovine CD4+, CD8+ and WC1+ T cells [24]. Moreover, there are reports [25-27] indicating that PGE2 down-regulated the CD25 expression on human T cells. When taking into consideration these results as well as the fact that NSAIDs reduce the synthesis of PGE2, it should be expected that these drugs would up-regulate the CD25 expression. Clearly, the effect of NSAIDs on CD25 expression is produced through some other mechanism. The current data implicate that ASA and KET have some potential to induce Foxp3 expression in CD8+ and CD4+ T cells, respectively, which may mean that they are capable of generating Treg cells. This suggestion is supported by results of other studies, where it was proven than KET induced Foxp3 expression in lymph node cells [28], and ASA increased the relative levels of Foxp3+CD25+ cells among CD4+ cells in the periphery and thymus of mice [29].
Conclusions
In conclusion, ASA, unlike KET and ROB, did not affect the activation-induced CD25 expression on CD4+ and CD8+ T cells, nor did it influence the count of CD4+ and CD8+ aTeff and Trest cells. Both KET and ROB caused some loss among CD8+ aTeff cells, in addition to which KET induced a loss among CD8+ Trest cells. Moreover, ROB, but not the other drugs, reduced the activation-induced CD25 expression on CD4+ T cells. This finding suggests that non-selective COX inhibitors and selective COX-2 inhibitors may weaken the effector T cell response by decreasing the count of aTeff cells. On the other hand, the above effect can be interpreted as an immunosuppressive action, although it can also be perceived as an anti-inflammatory action. Our results suggest that ASA and KET possess certain potential to induce Foxp3 expression in CD25+CD8+ and CD25+CD4+ T cells, respectively. However, it should be underlined that all the changes observed in this experiment were very weakly expressed and therefore it is uncertain whether they have clinical importance, despite being statistically significant.