Introduction
Hyperlipidemia refers to a group of lipid metabolism disorders characterized by increased levels of total cholesterol (TC), triglyceride (TG), and/or low-density lipoprotein cholesterol (LDL-C) and/or decreased levels of high-density lipoprotein cholesterol (HDL-C). Hyperlipidemia may promote the occurrence and development of atherosclerosis, and become an important risk factor for cardiovascular and cerebrovascular diseases, thereby seriously threatening human health [1].
Intestinal microflora plays a key role in maintaining human health. Lactobacillus is an important component of normal intestinal microflora, and has many bioactivities and effects. Studies have demonstrated that Lactobacillus is negatively correlated with lipid levels and blood glucose [2]. The possible mechanism is that Lactobacillus may convert cholesterol into fecal sterol by oxidization in the intestine, which can no longer be returned to the liver through the intestinal-hepatic circulation, thereby lowering cholesterol levels. The special enzymes produced by Lactobacillus also have an effect of lowering cholesterol synthesis. 3-hydroxy-3-methylglutaric coenzyme A reductase (HMGCR) is an important enzyme in cholesterol synthesis (a rate-limiting enzyme for cholesterol synthesis). The study conducted by Chen et al. confirmed that Lactobacillus could inhibit the HMGCR level in human hepatoma Hepg2 cells through experiments, which is another theoretical basis for the anti-hyperlipidemic effect of Lactobacillus [3]. In addition, Lactobacillus may adhere to and colonize the intestinal mucosa, which absorbs part of the cholesterol, converts it into bile salts and excretes this from the body. Hence, it can significantly reduce the intestinal absorption of cholesterol [4]. The study conducted by Zavišić et al. has proven the effect of Lactobacillus in reducing cholesterol and triglyceride in mice, and the safety of treatment [5]. This study aims to investigate the effects of Lactobacillus on lipid metabolism and hepatic steatosis in male mice fed with a high-fat diet by measuring blood lipid, hepatic function and hepatocyte morphology.
Material and methods
Source of strains
Lactobacillus strains were preserved in the laboratory, and were isolated from healthy human feces, Institute of Cancer Research (ICR) male mouse feces, and a brand of yogurt. These strains were screened through cholesterol degradation experiments.
Reagents and medium
Xuezhikang (a partially purified extract of red yeast Chinese rice with multiple components that was used for the treatment of cardiovascular and cerebrovascular diseases caused by hyperlipidemia and atherosclerosis) was purchased from the Beijing WBL Peking University Biotech Co., Ltd (WPU) (Beijing, People’s Republic of China). Normal diet and hyperlipidemic diet were provided by Shanghai Pluton Biotechnology Co., Ltd. The cholesterol, bile salt, ferric chloride, ammonium ferric sulfate, De Man-Rogosa-Sharpe (MRS) agar medium, eosin methylene blue medium, and MRS broth medium were provided by the microbiology laboratory of our institution. The simulated gastric juice, cholesterol medium and bile salt medium were prepared according to the references [6, 7].
Main instruments and apparatus
Vertical pressure steam sterilizer, BXM-30R; water-isolated thermostat incubator, DRP-9080; transmission electron microscope, Hitachi H7500.
Animals
One hundred male ICR mice, weighing 30–35 g, were provided by the experimental animal center of our institution.
Experiment methods
Strains
Lactobacillus strains were isolated from healthy human feces, ICR male rat feces, and a brand of yoghurt by MRS medium. The ability of each strain to degrade cholesterol in vitro [8] and the ability of Lactobacillus to tolerate bile salt and acid were determined using the methods mentioned in the literature to screen out the suitable strains.
Preparation of bacterial solution
The appropriate amount of identified Lactobacillus was scraped, and the corresponding bacterial solution was prepared by Maxwell turbidimetry.
Establishment of the hyperlipidemia mouse model
Ninety male mice were randomly divided into different groups, with 10 mice in each group. Mice in group A-H were fed with a high-fat diet [9], while mice in group I were fed with a normal diet.
Treatment
The male mice that were successfully established into models were randomly divided into 10 groups, with nine mice in group A–G and seven mice in group H–J. Mice in group A were treated with low concentrations of human Lactobacillus (human low group), mice in group B were treated with high concentrations of human Lactobacillus (human high group), mice in group C were treated with low concentrations of mouse Lactobacillus (mouse low group), mice in group D were treated with high concentrations of mouse Lactobacillus (mouse high group), mice in group E were treated with low concentrations of plant Lactobacillus (plant low group), and mice in group F were treated with high concentrations of plant Lactobacillus (plant high group). Furthermore, mice in group G were treated with Xuezhikang, mice in group H were treated with a high-fat diet, and mice in group I were treated with a normal diet (diet group), while mice in group J were set as a control, and treated with a normal diet. Mice in the treatment group (group A–F) were fed with a high-fat diet, instead of a normal diet, after the successful establishment of the hyperlipidemic model. At the same time, each mouse was given 0.1 ml of bacterial solution, daily. In the low concentration groups, the amount of bacteria was 3 × 10⁹ CFU/ml, while in the high concentration groups, the amount of bacteria was 3 × 10¹⁰ CFU/ml. Furthermore, 0.1 ml (24 mg/ml) of Xuezhikang was given daily by regular intragastric administration to each mouse treated with Xuezhikang (group G) [10] for 4 weeks. Mice in the normal diet treatment group were switched to a normal diet after successful model establishment, and each mouse was given 0.1 ml of saline regularly, daily. Mice in the hyperlipidemic model group and normal control group were continuously fed, and each mouse was given 0.1 ml of saline regularly, daily. The body weights of mice were observed and measured daily.
Results of treatment
Obesity index and visceral volume ratio: Body weight, body length and body weight before execution were measured daily, and the obesity index was calculated. The liver, spleen, kidney and other organs were weighed, and the liver and spleen index were calculated after these mice were executed.
Intestinal flora assay: The feces of mice were taken using the forcing method every week, and the number of Enterococcus, Enterobacter, Lactobacillus and total bacteria were determined.
Serological detection: Blood was collected from the eyeball of mice, and serum was separated. Then, the serological indicators (TC, TG, HDL-C, LDL-C, AST (U/l), ALT (U/l) and AI (TC/HDL-C)) were determined using an automatic blood biochemical analyzer.
Electronic microscopic observation: The liver was immediately collected after mice were sacrificed, and the structure of the liver was observed under an electron microscope.
Results
Screening of Lactobacillus
Three strains of Lactobacillus that met the requirements were screened from healthy human, ICR mice and yogurt using the cholesterol degradation test, and acid and bile salt tolerance test: the code of Lactobacillus H of human source, Lactobacillus I of mouse source, and Lactobacillus Z of plant source was number 1, 2 and 3 (Table I).
Establishment of the hyperlipidemic mouse model
After high-fat diet feeding, the obesity index of mice in the normal control group and hyperlipidemic model group was 15.68 ±0.44 and 16.25 ±0.55, respectively, at the end of the sixth week. Hence, the model was successfully established.
Serum biochemical indicators after 3 weeks of treatment
The results of the serum biochemical indicators of mice in each group after 3 weeks of treatment are presented in Table II.
Table II
Three weeks of treatment, blood biochemical index results (x ± s, n = 4)
| Project/groups | TC [mmol/l] | TG [mmol/l] | HDL-C [mmol/l] | LDL-C [mmol/l] | AST [U/l] | ALT [U/l] | AI |
|---|---|---|---|---|---|---|---|
| Group A | 3.48 ±0.76 | 0.93 ±0.50Δ | 0.79 ±0.12 | 0.43 ±0.09# | 101.00 ±21.56 | 89.50 ±23.69 | 3.41 ±0.43 |
| Group B | 3.04 ±0.34* | 1.62 ±0.35Δ | 0.59 ±0.07&* | 0.28 ±0.08& | 88.00 ±22.49 | 81.50 ±9.43 | 4.15 ±0.51 |
| Group C | 2.17 ±0.70* | 1.81 ±0.23Δ | 0.48 ±0.05*Δ | 0.21 ±0.05*Δ | 95.40 ±25.21 | 78.00 ±32.65 | 4.06 ±0.46 |
| Group D | 2.09 ±0.86Δ | 1.21 ±0.06&Δ | 0.43 ±0.16* | 0.18 ±0.10* | 90.33 ±13.58 | 103.33 ±19.22 | 3.80 ±0.25 |
| Group E | 2.34 ±0.37Δ# | 1.33 ±0.66Δ | 0.49 ±0.03Δ | 0.27 ±0.04* | 103.25 ±32.87 | 82.50 ±34.10 | 4.21 ±0.70 |
| Group F | 2.66 ±0.15Δ# | 1.52 ±0.60Δ | 0.49 ±0.07* | 0.23 ±0.02Δ | 117.75 ±33.29 | 106.50 ±24.08 | 4.51 ±0.86 |
| Group G | 2.31 ±0.25# | 1.42 ±0.29Δ | 0.44 ±0.04Δ | 0.18 ±0.04Δ | 78.50 ±9.15 | 83.50 ±11.12 | 4.24 ±0.26 |
| Group H | 3.60 ±0.30 | 1.19 ±0.20Δ | 0.66 ±0.06 | 0.30 ±0.02 | 123.00 ±57.98 | 121.00 ±55.15 | 4.49 ±0.07 |
| Group I | 3.68 ±0.17 | 4.50 ±0.52 | 0.81 ±0.15 | 0.39 ±0.05 | 99.00 ±21.79 | 121.00 ±1.00 | 4.07 ±0.98 |
| Group J | 3.50 ±0.55 | 1.23 ±0.47Δ | 0.62 ±0.15 | 0.21 ±0.05* | 78.50 ±21.51 | 155.00 ±38.18 | 4.75 ±0.49 |
In the human low group, TG was significantly lower compared to the hyperlipidemic group (p < 0.01), while LDL-C was significantly lower compared to the control group (p < 0.05). In the human high group, the levels of TC, TG and HDL-C were lower than those in the hyperlipidemic group (p < 0.05), while the levels of LDL-C and HDL-C were lower than those in the human low group (p < 0.05). In the mouse low group, the levels of TC, TG, HDL-C and LDL-C were all lower than those in the hyperlipidemic group (p < 0.05). In the mouse high group, the levels of TC, TG, HDL-C and LDL-C were all lower than those in the hyperlipidemic group (p < 0.05), and the difference in level of TG was statistically significant compared to the mouse low group (p < 0.05). In the plant low group, the levels of TC, TG, HDL-C and LDL-C were all lower than those in the hyperlipidemic group (p < 0.05), while the level of TC was lower than that in the control group (p < 0.05). The levels of TC, TG, HDL-C and LDL-C were lower in the plant high group than in the hyperlipidemic group (p < 0.05), while the level of TC was lower in the plant high group than in the control group (p < 0.05). In the drug treatment group, the levels of TG, HDL-C and LDL-C were lower than those in the hyperlipidemic group (p < 0.05), while the level of TC was lower than in the control group (p < 0.05).
Serum biochemical indicators after 4 weeks of treatment
The results of the serum biochemical indicators of mice in each group after 4 weeks of treatment are presented in Table III.
Table III
Four weeks of treatment, blood biochemical index results (x ± s, n = 5)
| Project/groups | TC [mmol/l] | TG [mmol/l] | HDL [mmol/l] | LDL [mmol/l] | ALT [U/l] | AST [U/l] | AI | Glu [mmol/l] |
|---|---|---|---|---|---|---|---|---|
| Group A | 1.34 ±0.42* | 2.82 ±0.79Δ | 0.49 ±0.11Δ | 0.19 ±0.07Δ | 25.30 ±6.00Δ | 83.30 ±3.90 | 1.68 ±0.42#Δ | 6.96 ±0.63 |
| Group B | 1.38 ±0.36*# | 2.48 ±0.30Δ | 0.45 ±0.04Δ | 0.16 ±0.02Δ | 29.00 ±4.10Δ | 85.40 ±19.80 | 2.05 ±0.70#Δ | 7.94 ±0.69 |
| Group C | 0.77 ±0.39* | 2.25 ±0.34* | 0.53 ±0.13* | 0.20 ±0.09* | 26.50 ±7.70Δ | 98.30 ±28.30 | 0.61 ±1.02Δ | 7.45 ±0.18 |
| Group D | 1.03 ±0.10* | 2.87 ±0.62Δ | 0.52 ±0.08Δ | 0.22 ±0.11*# | 23.00 ±4.60Δ | 79.60 ±26.80 | 0.99 ±0.83Δ | 6.20 ±0.91 |
| Group E | 1.53 ±0.70* | 2.78 ±0.56Δ | 0.48 ±0.03Δ | 0.19 ±0.05#Δ | 28.00 ±4.30Δ | 86.40 ±12.80 | 1.57 ±0.69Δ | 6.50 ±1.07 |
| Group F | 0.96 ±0.17Δ | 2.63 ±0.45Δ | 0.47 ±0.07Δ | 0.16 ±0.03Δ | 29.60 ±4.00Δ | 96.60 ±13.60 | 1.06 ±0.36Δ | 8.08 ±0.85 |
| Group G | 1.11 ±0.42* | 2.70 ±0.63Δ | 0.47 ±0.09*Δ | 0.18 ±0.05Δ | 25.40 ±5.70Δ | 87.80 ±20.40 | 1.42 ±1.14Δ | 7.52 ±1.02 |
| Group H | 1.11 ±0.26* | 2.89 ±0.49Δ | 0.52 ±0.07Δ | 0.18 ±0.03Δ | 24.00 ±8.70Δ | 96.80 ±18.80 | 1.13 ±0.39Δ | 6.96 ±0.94 |
| Group I | 3.64 ±1.69 | 4.69 ±0.06 | 0.81 ±0.15 | 0.41 ±0.10 | 57.00 ±5.60 | 93.50 ±30.40 | 4.41 | 5.60 ±1.45 |
| Group J | 0.89 ±0.27Δ | 2.68 ±0.43Δ | 0.48 ±0.05Δ | 0.21 ±0.02Δ | 25.50 ±7.00Δ | 84.20 ±16.70 | 0.84 ±0.42Δ | 6.48 ±1.59 |
In the human low group, the levels of TC, TG, HDL-C, LDL-C and ALT, and the atherosclerosis index (AI) were lower than those in the hyperlipidemic group (p < 0.05), while the AI was lower than in the control group (p < 0.05). In the human high group, the levels of TC, TG, HDL-C, LDL-C and ALT, and the AI were lower than those in the hyperlipidemic group (p < 0.05), while the AI and TC were lower than those in the control group (p < 0.05). In the mouse low group, the levels of TC, TG, HDL-C, LDL-C and ALT, and the AI were lower than those in the hyperlipidemic group (p < 0.05). In the mouse high group, the levels of TC, TG, HDL-C, LDL-C and ALT, and the AI were lower than those in the hyperlipidemic group (p < 0.05), while LDL was lower than that in the control group (p < 0.05). In the plant low group, the levels of TC, TG, HDL-C, LDL-C and ALT, and the AI were lower than those in the hyperlipidemic group (p < 0.05), while LDL was lower than that in the control group (p < 0.05). In the plant high group, the levels of TC, TG, HDL-C, LDL-C and ALT, and the AI were lower than those in the hyperlipidemic group (p < 0.01). In the Xuezhikang treatment group, the levels of TC, TG, HDL-C, LDL-C and ALT, and the AI were lower than those in the hyperlipidemic group (p < 0.05).
Changes in obesity indexes in each group during the treatment period
After 4 weeks of Lactobacillus treatment, the serum cholesterol and lipid levels, and the AI in each treatment group were all lower than those the hyperlipidemic group, and the difference was statistically significant. However, when compared with those in mice fed with a normal diet in the control group, only mice in the mouse low group had an AI lower than the controls, and the difference was not statistically significant. The indexes in other treatment groups were all higher than those in the controls, and a significant difference only existed in TC in the human high group, and the AI in the human low and human high groups.
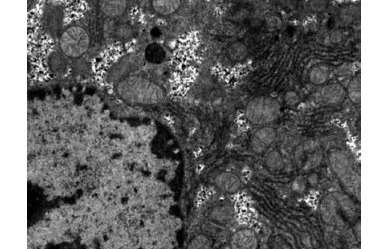
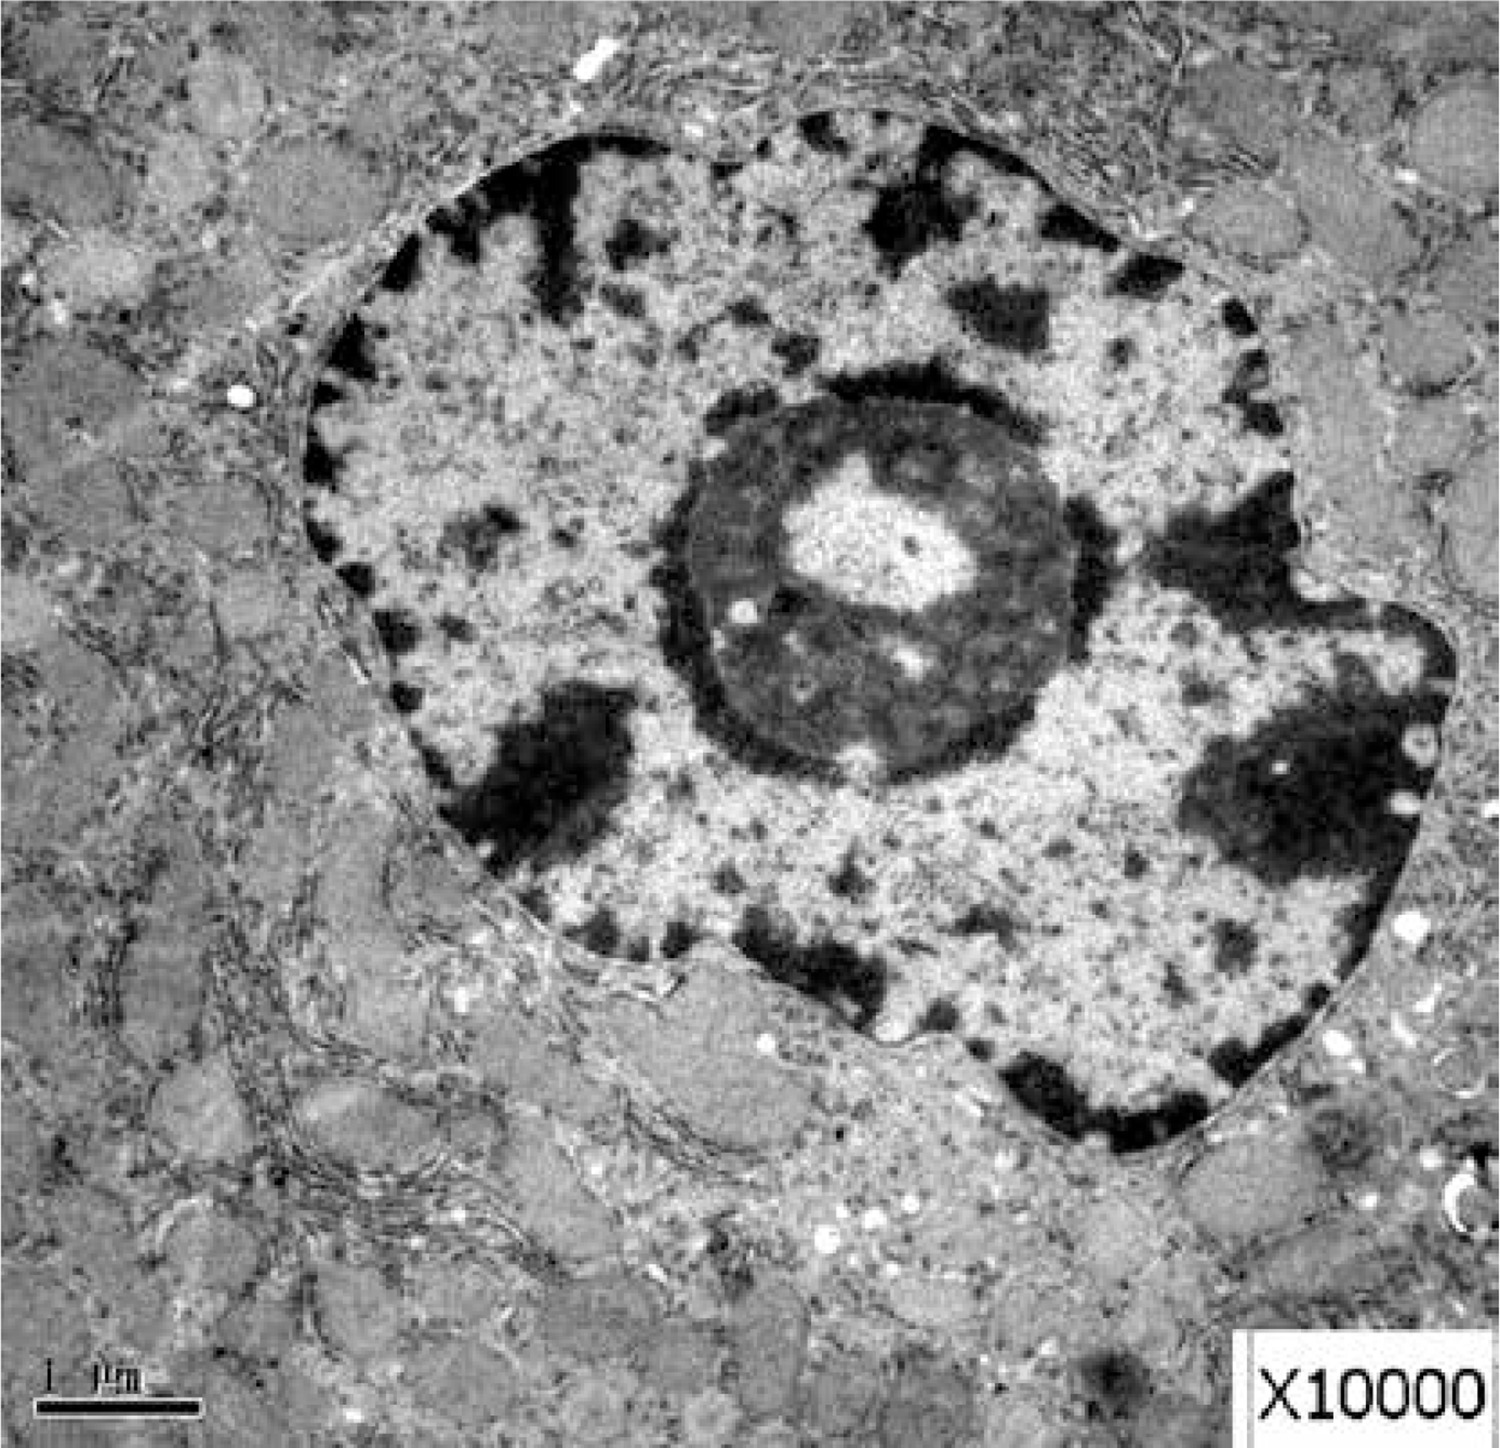
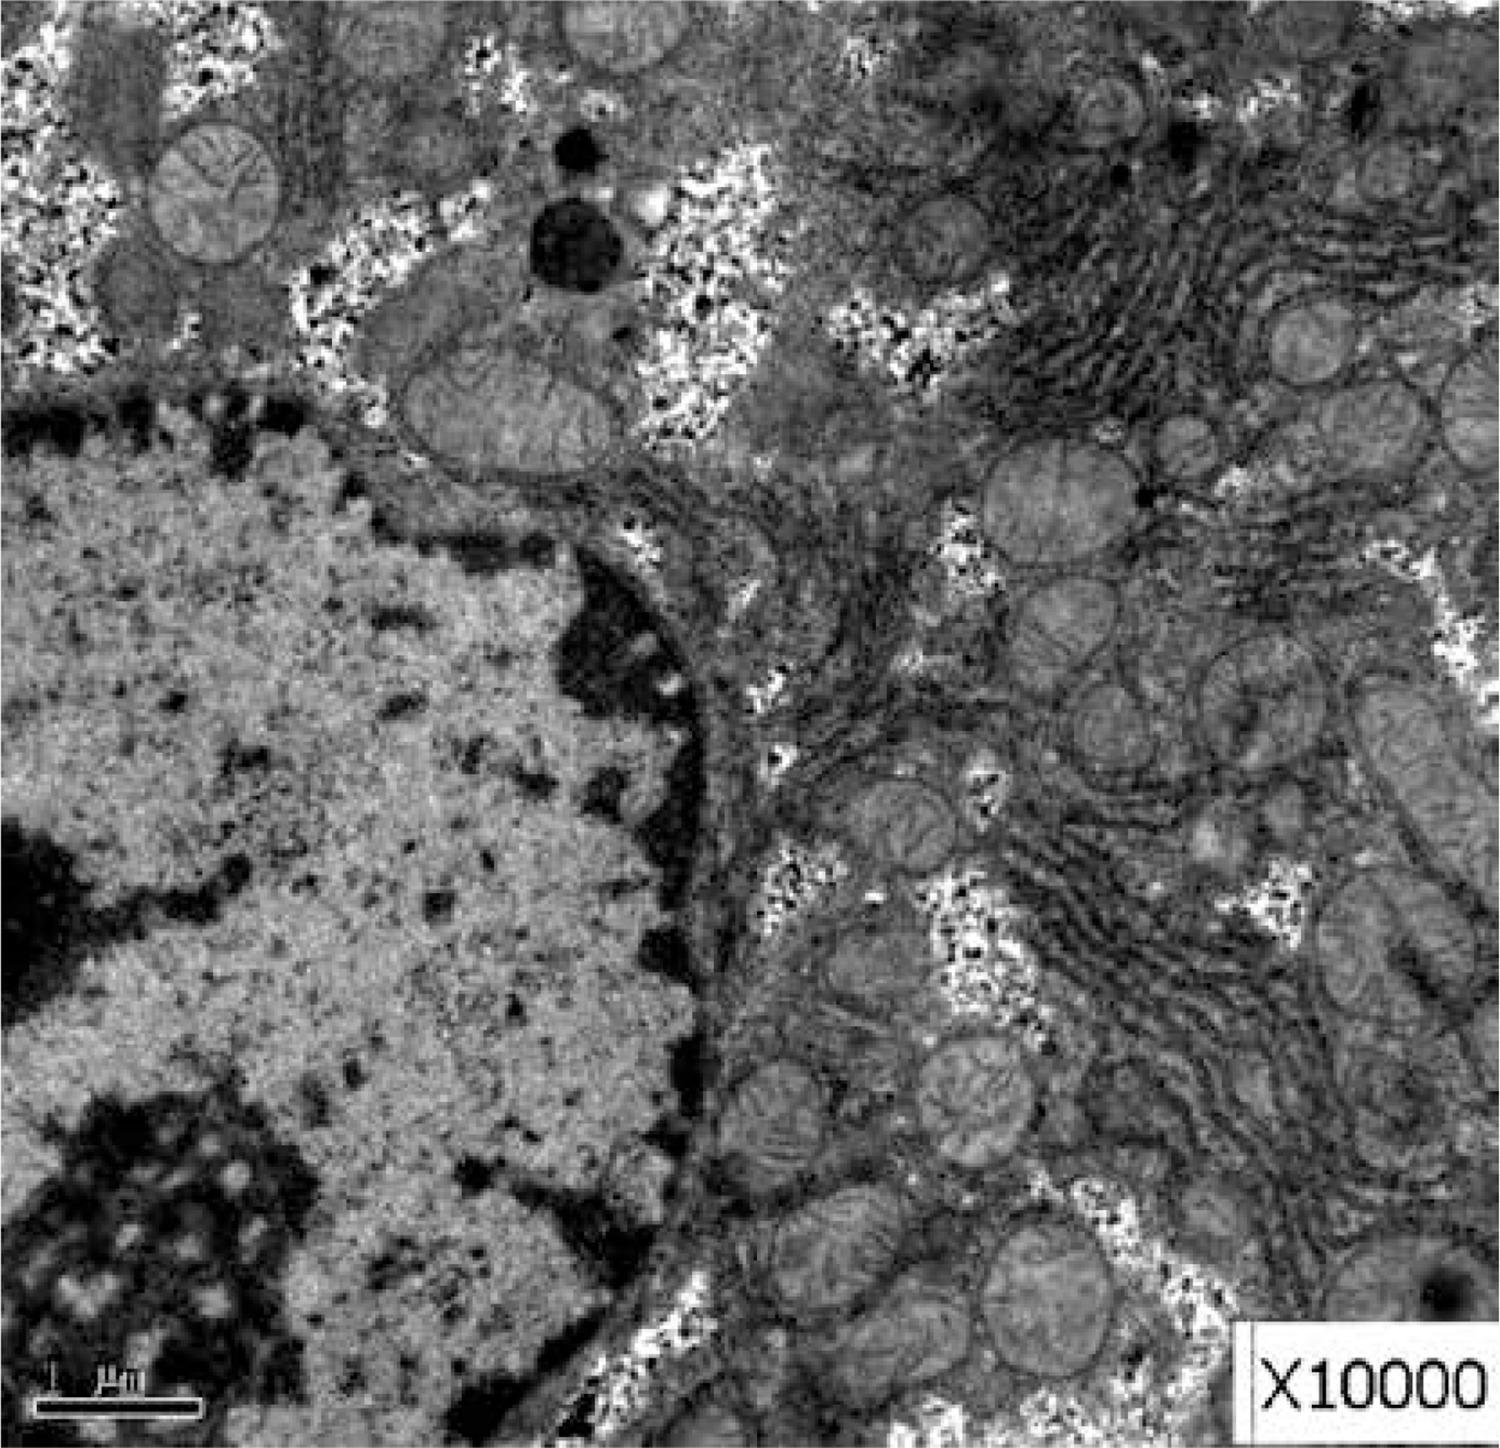
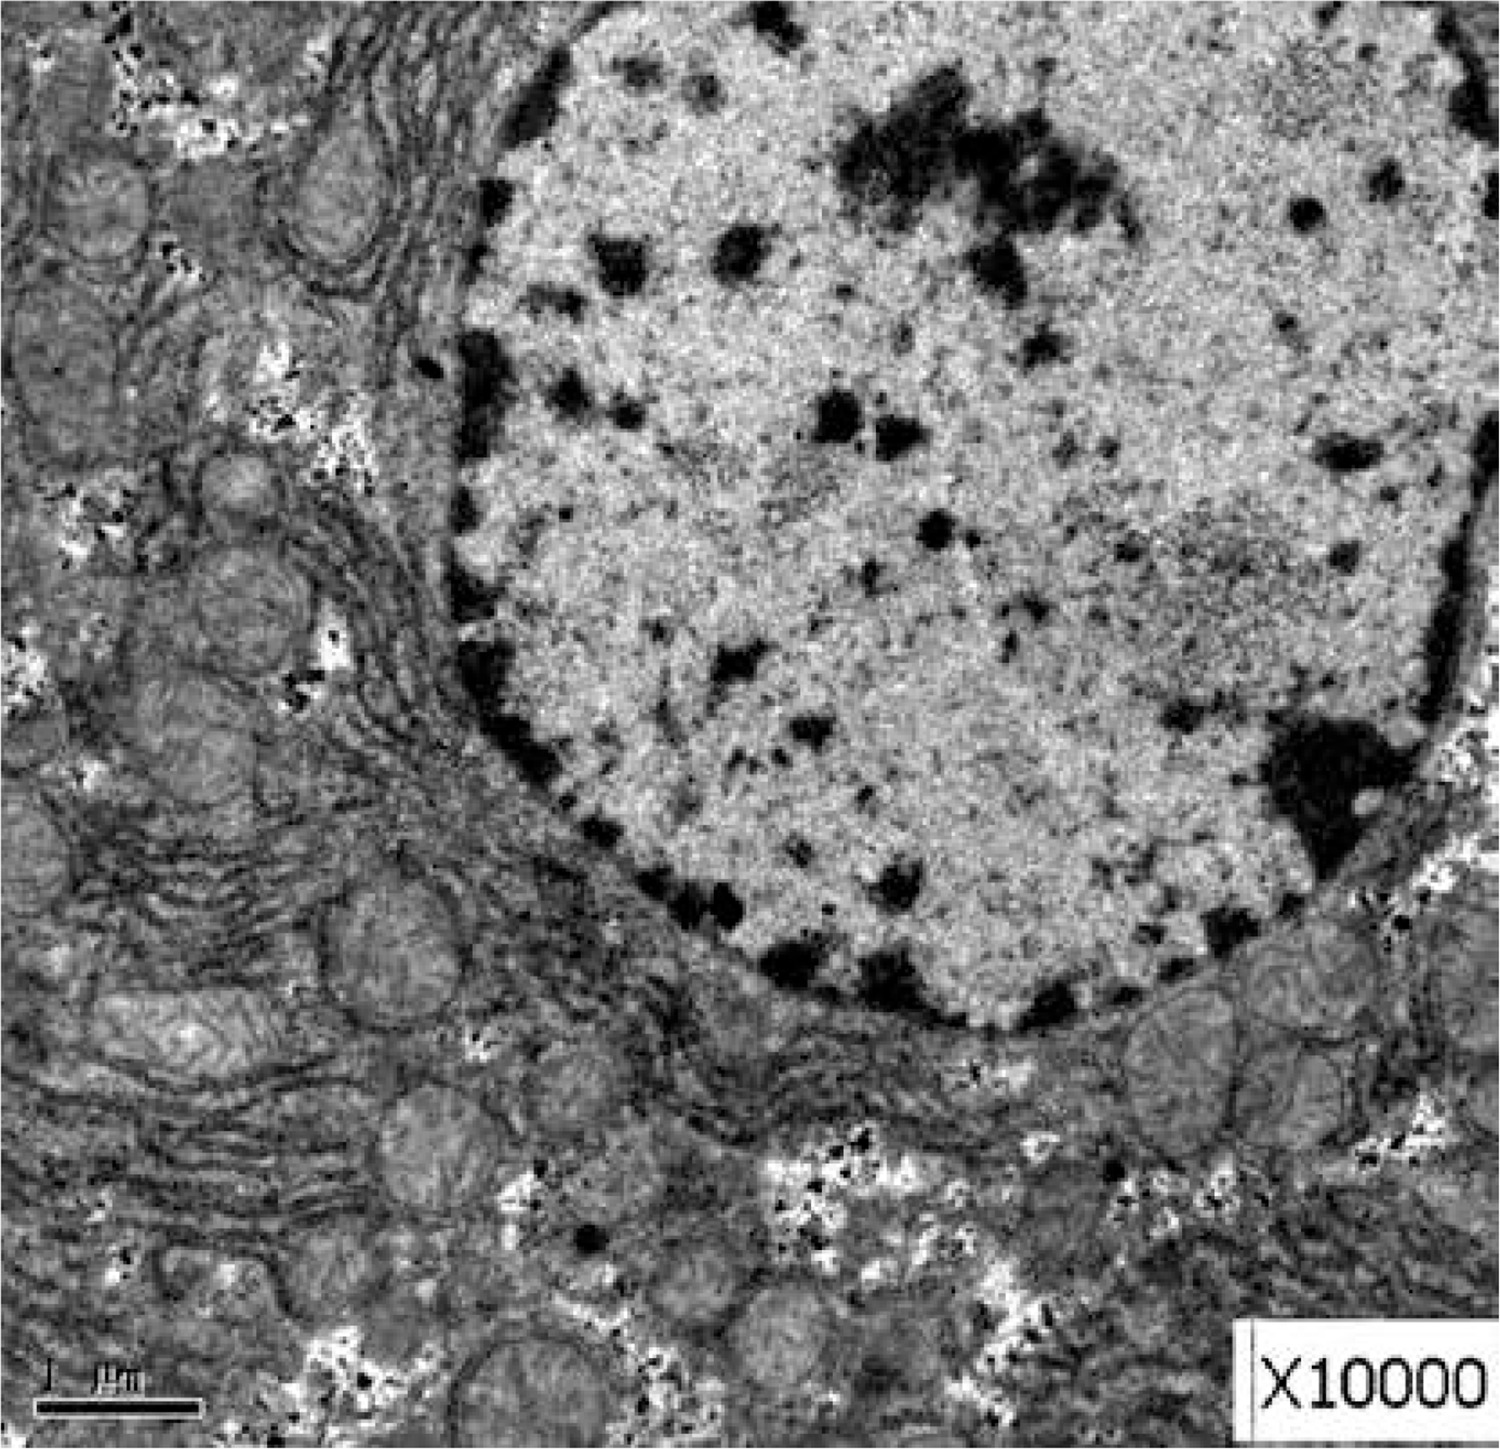
Electron microscopy observation results
Obvious lipid droplets were found under a light microscope when the liver of mice in the hyperlipidemic model group was observed (Figure 1). Under an electron microscope, nucleus pyknosis, chromatin edge gathering, enlarged and rounded mitochondria, and blurred mitochondrial cristae could be observed. However, there was no abnormal structure of liver cells in the normal control group under a light and electron microscope (Figure 2). Furthermore, hepatic cells in the Lactobacillus treatment group were not abnormal under an electron microscope (Figure 3).
Discussion
Establishment of the hyperlipidemic mice model
It has been proven by experiments that the success rate of the dietary modeling of hyperlipidemic mice with 45% of total energy supplied by fat is the highest. This was due to the fact that a high-fat diet contains lard and cholesterol, which led to the increase in TC and TG. Furthermore, the high-fat diet can increase the obesity index and blood lipid of mice, and subsequently lead to liver injury, and even fatty degeneration. In the present study, all mice were tested for blood biochemical indicators to prove the success of the model.
Effects of Lactobacillus on hyperlipidemia
Lactobacillus may transform cholesterol into fecal sterol through oxidation in the intestinal tract, which can no longer return to the liver through intestinal-hepatic circulation, thereby lowering cholesterol levels. In addition, there are special enzymes produced by Lactobacillus that can reduce cholesterol. These may inhibit the synthesis of cholesterol by inhibiting HMGCR (the rate-limiting enzymes in cholesterol synthesis). Lactobacillus bacteria also have antioxidant effects. The cellular and acellular extracts of Lactobacillus have different scavenging capacities for various free-radicals in vitro, which are closely correlated to the formation of atherosclerosis. In the present study, the lipid metabolism in hyperlipidemic mice improved at 3 weeks after Lactobacillus intragastric administration. TC, TG and LDL-C decreased in each group to different degrees. The longer the treatment duration was, the more obvious the improvement became. At the fourth week of treatment, these indexes were significantly lower than those in the “hyperlipidemic group”, which is consistent with the results reported by Song [11]. However, in this study, the lipid-lowering effects of strains from different sources did not have a positive correlation with the concentration of the bacterial solution. In the study conducted by Huang et al., it was demonstrated that after adding Lr263, HDL-C and LDL-C changed in a dose-dependent manner. In addition, their research revealed that HDL-C exhibited different changes, with an increase in most cases, while TC, TG and LDL-C decreased [12]. However, in the present study, the HDL-C levels decreased, which is inconsistent with the previous results. What led to these results – the difference in strains, the difference in concentration, or the different durations of treatment? The longest duration of treatment in the present study was 4 weeks, while the duration for Huang’s treatment was 6 weeks. In Kim’s study, probiotics containing Lactobacillus were used to treat mice for 8 weeks, and this also exhibited an increase in HDL-C [13]. Costabile et al. conducted a similar study in a population. Within 6–12 weeks of treatment, HDL-C increased by 14.7% [14] in subjects older than 60 years. Thus, it appears that treatment duration is a very important factor. At present, the commonly used drugs for treating hyperlipidemia are simvastatin, pravastatin, fluvastatin and Xuezhikang. These drugs can reduce intracellular LDL-C synthesis and plasma LDL-C concentration mainly by inhibiting the rate-limiting enzyme (HMG-CoA reductase) in the early stage of intracellular cholesterol synthesis. However, adverse reactions such as rhabdomyolysis, nervous system damage and other side effects exist, and serious liver damage can also be caused. Lactobacillus are probiotic bacteria with good safety, and there is no significant therapeutic difference between drug treatments. This can be used as an effective method to treat hyperlipidemia. Furthermore, in addition to Lactobacillus and drug treatment, the hyperlipidemia index in the treatment group that switched to a normal diet after modeling also improved. Hence, it can be concluded that improving the diet can also play a role in reducing blood lipids, and that this is the first recommended method for reducing weight and fat content.
Effects of Lactobacillus in the liver
Further development of obesity and hyperlipidemia can also cause hepatic injury, leading to non-alcoholic steatohepatitis, and even hepatic cirrhosis [15]. In the present study, the livers of hyperlipidemic model mice exhibited obvious morphological changes, accompanied by abnormal function with elevated AST and ALT, which is also evidence of hepatic injury caused by a high-fat diet. At the third week after treatment, the serum levels of AST and ALT did not decrease in each group, but at the fourth week after treatment, the levels of ALT in each group were significantly lower than those in the hyperlipidemic group, and there were significant differences in the statistical analysis. Although AST did not return to the normal range, the results of the hepatic histological examination revealed that the hepatic fatty degeneration improved, which is consistent with the results reported by Oh et al. and Kim et al. [15, 16]. Studies have shown that Lactobacillus can improve hypercholesterolemia in mice by activating Lxr-α in the liver and intestine, thereby enhancing the excretion of fecal cholesterol and bile acid in the small intestine [17]. As a probiotic, in addition to reducing blood lipid, it also has antioxidant and anti-inflammatory effects, which can improve the pathology in chronic low-grade inflammation related to obesity or metabolic syndrome [18, 19]. This is also one of the reasons for the improvement in hepatic function.
Protective effects of Lactobacillus for the heart
Elevated lipid levels have been widely recognized as major risk factors for atherosclerosis, coronary heart disease and other cardiovascular disease (CVD). Increasing evidence suggests that intestinal disorders caused by a high-fat diet may promote the development of hyperlipidemia, obesity, insulin resistance and other metabolic syndromes. Studies have shown that probiotics, such as Lactobacillus, can reduce the AI (TC/HDL-C) [20] in mice fed with a high-fat diet, and cause the lag time of LDL-C oxidation to significantly improve, which reflect its antioxidant and cardioprotective properties [21]. In the present study, the AI in each treatment group was approximately 4 at the third week after treatment, and there was no difference between the hyperlipidemic model group and treatment group. However, the AI in each treatment group was significantly lower compared to the model group, at the fourth week of treatment, and the difference was statistically significant. This further confirms the cardioprotective effect of Lactobacillus and its positive correlation with the duration of treatment.
Different strains of Lactobacillus in clinical practice
Members of the genus Lactobacillus have long been recognized as being among the most abundant microorganisms in the human gastrointestinal tract and are associated with good intestinal health. These bacteria are often positively or negatively correlated with human diseases and chronic conditions. Therefore, the importance of this genus to human health cannot be ignored.
The most abundant Lactobacillus included L. delbrueckii, L. murinus, L. casei, L. rhamnosus, L. plantarum, and L. ruminis. Some of these species (e.g. L. rhamnosus and L. murinus) are rarely isolated from the parenteral environment and are considered to be gut-autochthonous microorganisms. Other mucosal sites are colonized by distinct species (e.g. L. crispatus in the vagina) [22]. There is also host specificity in some Lactobacillus species, e.g. L. reuteri [23].
Autochthonous Lactobacillus might play a role in the resolution of infectious disease and restoration of immune homeostasis; for instance, oral gavage with L. reuteri reduced anti-commensal antibodies, innate cytokines, and Th17 responses, thereby ameliorating immune hyper-reactivity [24]. The intestinal microbiota of patients with severe and early onset rheumatoid arthritis (RA) were shown to have increased proportions of L. salivarius, L. ruminis, and L. iners when compared to healthy, age-matched individuals [25]. There are also reports on the association of intestinal Lactobacillus with obesity in humans; e.g. lean women presented higher concentrations of L. plantarum compared to obese women [26]. Also, increased levels of L. gasseri were found in patients with type 2 diabetes [27]. In addition, the development of Lactobacillus occurs primarily during infancy, and growing evidence has emphasized its positive role and implications for human health, such as improving functional gastrointestinal disorders and allergies [28].
In conclusion, in this study we found that Lactobacillus can improve the high cholesterol, high blood lipid, and injury of hepatic function, and prevent further development of atherosclerosis caused by a high-fat diet to some extent. Correct dietary structure is the basis for the treatment of dietary hyperlipidemia and its complications. Lactobacillus and other probiotics can be used as an alternative or supplement to the existing treatment of non-alcoholic fatty liver disease, in order to reduce the risk of CVD.