Introduction
Type 2 diabetes mellitus (T2DM) is known as one of the most common metabolic diseases. According to the International Federation of Diabetes (IDF) statistics, the prevalence of diabetes mellitus was about 415 million people worldwide in 2015 and this will rise to 642 million in 2040 [1]. Type 2 diabetes mellitus mainly results from the interaction among genetic, environmental and other risk factors [2–4]. Furthermore, the increase in the prevalence of T2DM is closely linked to obesity (especially abdominal obesity). Obesity causes elevation of free fatty acids (FFAs) in the bloodstream, which inhibit glucose transport activity, diminution of glucose uptake by muscle, glycogen synthesis in skeletal muscle and induce insulin resistance (IR) [5]. Increasing evidence suggests that obesity (especially visceral adipose tissue) induces low-grade inflammation affects the pathogenesis of T2DM in obese patients [6]. During low-grade systemic inflammation, the insulin-dependent tissues are exposed to infiltration of inflammatory macrophages which interferes with the ability of these tissues to respond to insulin [7]. Type 2 diabetes mellitus is a multifactorial disease and needs multi-therapy for more effective treatment [8]. Although pharmacotherapy and lifestyle modifications can improve T2DM [9–11], studies have shown that therapeutic approaches can be affected by genetic factors such as the polymorphism of diabetes-related genes [12].
FTO (fat mass and obesity-associated) is a candidate gene for predisposing to T2DM, identified through genome-wide association studies (GWASs) [13]. The studies reported a strong correlation between the sequence variation of the FTO gene, obesity, T2DM and metabolic risk factors [14]. Although some diabetes-associated variants of the FTO gene are dependent on body mass index (BMI) and obesity, recently a meta-analysis indicated obesity-independent associations between the SNP rs9939609 of the FTO gene and T2DM risk [15].
Epigallocatechin-3-gallate (EGCG) is a polyphenolic compound, belonging to the catechin family. Epigallocatechin-3-gallate is the most abundant (approximately 65%) and has the highest biological activity among catechins of green tea [16]. Epigallocatechin-3-gallate is classified as an antioxidant (based on its chemical structure) and a potential mechanism for beneficial health effects may be attributable to its anti-oxidative function. Recently, studies reported direct effects of EGCG that are independent of anti-oxidative mechanisms [17]. Epigallocatechin-3-gallate has beneficial effects on obesity through increased cellular production of reactive oxygen species, leading to the activation of adenosine monophosphate-activated protein kinase (AMPK), which suppresses gene and protein expression of transcription factors and enzymes involved in adipogenesis and lipogenesis, and stimulates lipolysis [18]. Previous studies suggested that EGCG causes reduced fasting blood sugar (FBS) levels by a change in the expression of the GLUT4 gene, increase in insulin sensitivity and facilitates entry of glucose into cells [19]. Epigallocatechin-3-gallate reduces the rate of cholesterol absorption by affecting the micellar solubilization of cholesterol in the digestive tract [20].
Although the effect of EGCG on T2DM was evaluated in in vivo and in vitro studies, the results of clinical trials are inconsistent. In addition, the role of genetic differences in response to EGCG have never been evaluated. Therefore, the present study aimed to evaluate the effects of EGCG supplementation on biomarkers of systemic low-grade inflammation and metabolic risk factors in patients with T2DM and to study the effects of the FTO (rs9939609) gene polymorphism on response to EGCG supplementation.
Material and methods
Participants
Sixty-six patients with T2DM, screened from an endocrine clinic, were recruited. Inclusion criteria were as follows: 20–60 years old, BMI of 18.5 to 35 kg/m2, fasting blood glucose ≥ 126 mg/dl, T2DM patients with disease duration more than 2 years since diagnosis. Exclusion criteria were as follows: suffering from diabetes mellitus complications such as foot ulcer and kidney failure, pregnant or lactating women, inflammatory disease, biliary tract obstruction and gallstones, liver dysfunction, Cushing’s syndrome, adrenal or thyroid dysfunction, cancer, cardiovascular diseases and recent surgery.
Moreover, taking antioxidant supplements (for example lycopene, β-carotene, selenium, vitamin A, vitamin C, vitamin E and fish oil) during the past 6 months, using insulin and corticosteroids and following a weight-loss diet over the past 3 months were also considered as exclusion criteria.
Ethical approval
The study was approved by the Ethics Committee of Ahvaz Jundishapur University of Medical Sciences (ID: IR.AJUMS.REC.1395.548), and all patients completed an informed consent form. The study was registered in the Iranian Registry of Clinical Trials (IRCT), available at http://www.irct.ir (ID: IRCT2017021612949N3).
Study design and randomization
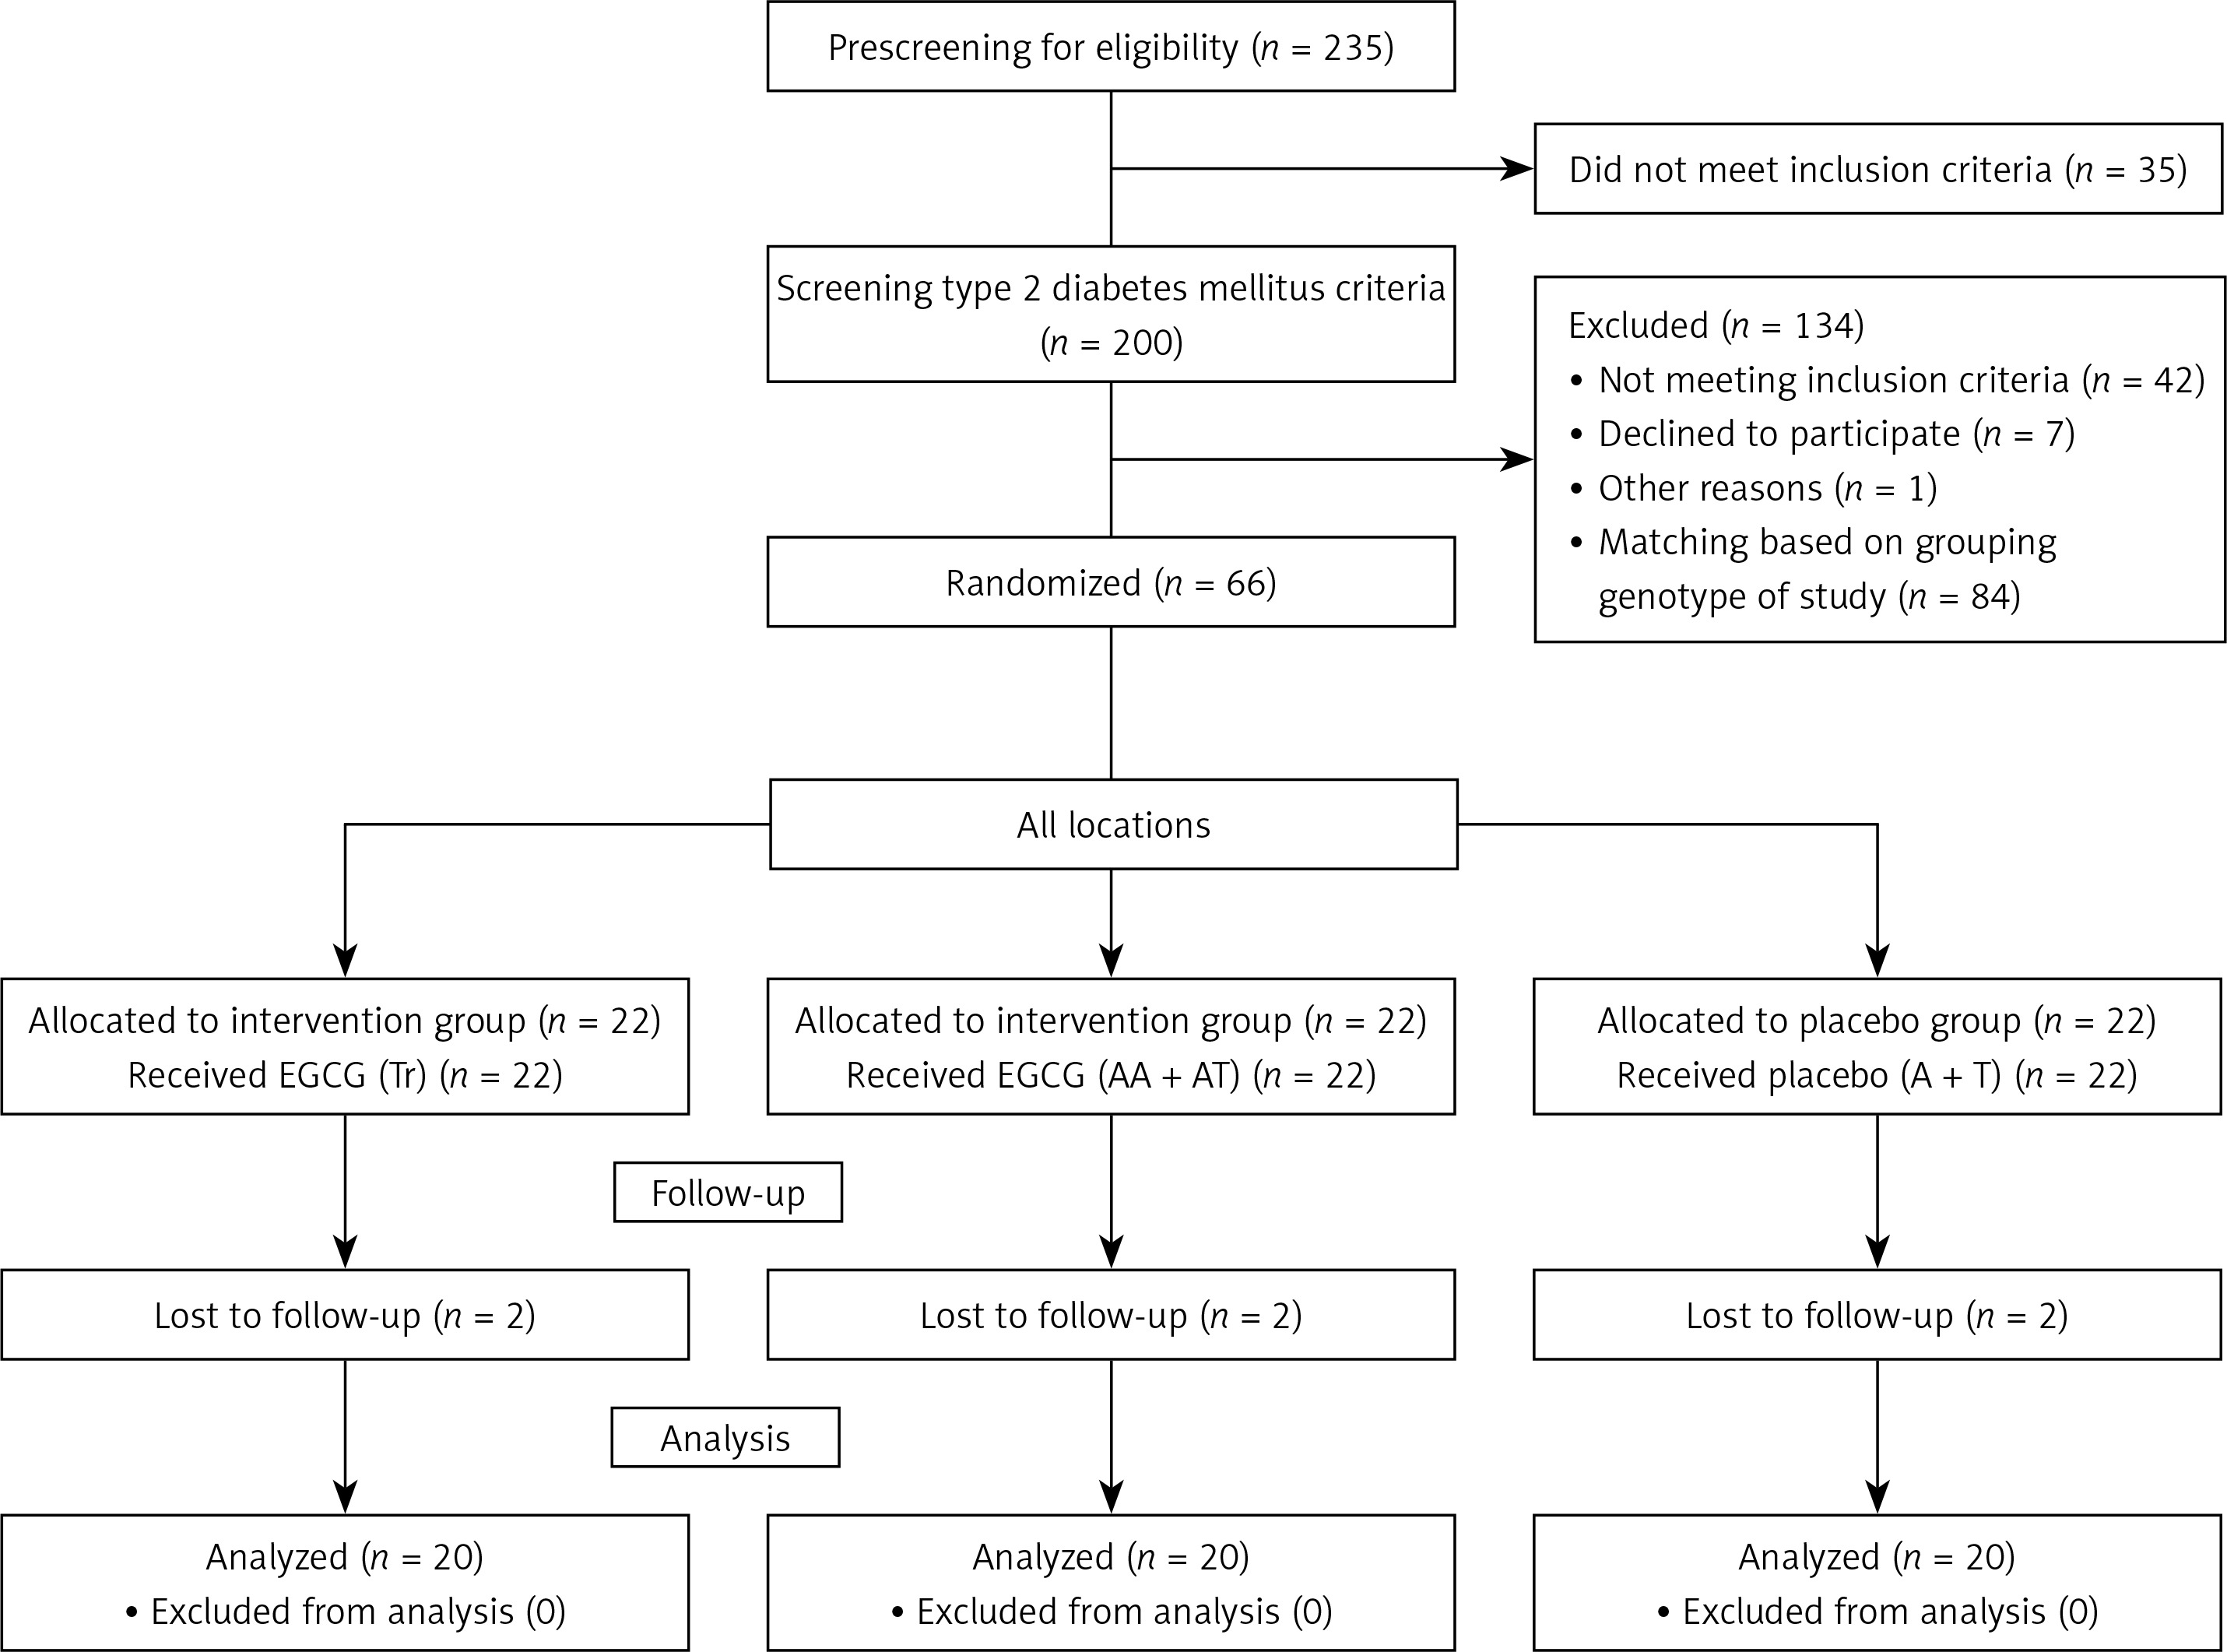
This study was a randomized double-blind placebo-controlled trial conducted in Ahvaz, Iran, from August 2017 to March 2018. Prescreening was applied by interview for patients; eligible participants were included in the study after FTO-rs9939609 polymorphism assays. The group design was based on FTO variant alleles (homozygous = AA and heterozygous = AT) and 2 wild-type alleles (TT). The participants were randomly allocated to the three groups: EGCG supplement (TT genotype, n = 22), EGCG supplement (AT + AA genotype, n = 22) and placebo (A + T genotype, n = 22). The flowchart of the study is presented in Figure 1. The participants were grouped randomly by a third person and the researchers were blinded to the supplement type given to patients. The participants were matched for age and BMI. The intervention groups received two tablets of EGCG supplement containing 300 mg/day EGCG of Camellia sinensis leaves for 2 months. The placebo group received the same number of placebo tablets (corn starch) for 2 months. All subjects were contacted and monitored weekly by telephone to ensure that they were using prescribed capsules. Also, they were asked to return the remaining tablets for evaluation of compliance. During the study, all subjects were asked to maintain their dietary intake and physical activity and report about any possible adverse effects.
Anthropometric and blood pressure measurement
Weight (accuracy of 0.1 kg) and height (accuracy of 0.1 cm) of participants were determined in an overnight fasting status using a standard scale (Seca) at the onset of the study and after 2 months’ intervention. Body mass index was calculated using the formula: (weight (kg)/(height2 (M)). The participants were asked to sit on a chair and have no physical activity for 1 h before sampling. Systolic blood pressure (SBP), diastolic blood pressure (DBP), and heart rate were measured. The mean arterial pressure (MAP) was calculated using the formula: (2DBP + SBP)/3).
Biochemical measurements
The blood samples (5 ml) were collected during the study (2 months) in the 12-hour fasting condition. The blood samples were centrifuged (3,000 rpm for 10 min). The lipid profile levels were determined immediately after sampling and the remnants of sera were stored at –80°C for later assessment. The concentrations of serum triglyceride (TG), total cholesterol (TC), very low-density lipoprotein (VLDL), low-density lipoprotein (LDL-C) and high-density lipoprotein (HDL-C) were measured by auto-analyzer. The atherogenic index of plasma (AIP) was calculated as the logarithm of the molar ratio of TG/HDL-C. The serum interleukin-6 (IL-6), high-sensitivity C-reactive protein (hs-CRP) and total antioxidant capacity (TAC) concentrations were assessed by ELISA kits.
Genotyping
A 5 ml blood sample was collected in EDTA containing tubes and stored (at –80°C) for extraction of DNA. Genomic DNA was extracted from whole blood samples using DNA purification kit (Sinaclon, Iran). Polymerase chain reaction-restriction fragment length polymorphism (PCR-RFLP) was used for genotyping the single-nucleotide polymorphisms (SNPs) of the FTO-rs9939609. A DNA fragment (containing rs9939609 polymorphism) was amplified using primers. The polymerase chain reaction product of the FTO gene was digested by ScaI restriction enzyme to analyze for polymorphism by RFLP assay.
Statistical analysis
All analyses were performed with SPSS 20.0 (SPSS Inc., Chicago, IL, USA). The Kolmogorov-Smirnov test was used to assess normality of data. In order to assay differences before and after the intervention within groups, the paired sample t test was used. Baseline characteristics were compared by χ2 and ANOVA. Comparison between groups was done by ANOVA. A p-value < 0.05 was considered significant.
Results
Of the 235 volunteers, 200 were eligible and underwent genotyping, anthropometric and biochemical assessments. Among them, 66 patients with T2DM were recruited to the study. After 2 months, there were two dropouts in in each group. Consequently, the data were analyzed for 60 patients (Figure 1).
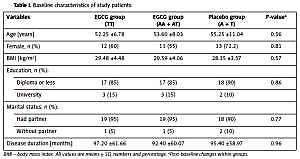
Baseline characteristics for placebo and EGCG groups according to the FTO-rs9939609 genotypes are shown in Table I. No significant differences between any of the three group means were detected in age, gender, BMI, education, disease duration and marital status (Table I).
Table I
Baseline characteristics of study patients
| Variables | EGCG group (TT) | EGCG group (AA + AT) | Placebo group (A + T) | P-valuea |
|---|---|---|---|---|
| Age [years] | 52.25 ±6.78 | 53.60 ±8.03 | 55.25 ±11.04 | 0.56 |
| Female, n (%) | 12 (60) | 11 (55) | 13 (72.2) | 0.81 |
| BMI [kg/m2] | 29.48 ±4.48 | 29.59 ±4.06 | 28.35 ±3.57 | 0.57 |
| Education, n (%): | ||||
| Diploma or less | 17 (85) | 17 (85) | 18 (90) | 0.86 |
| University | 3 (15) | 3 (15) | 2 (10) | |
| Marital status, n (%): | ||||
| Had partner | 19 (95) | 19 (95) | 18 (90) | 0.77 |
| Without partner | 1 (5) | 1 (5) | 2 (10) | |
| Disease duration [months] | 97.20 ±61.66 | 92.40 ±60.07 | 95.40 ±58.97 | 0.96 |
Within-group analysis after EGCG intervention on profile lipid, BMI, BP, inflammatory markers and TAC levels, regarding FTO-rs9939609 are presented in Table II.
Table II
Effects of epigallocatechin-3-gallate (EGCG) on anthropometric indexes and blood pressure, regarding FTO-rs9939609
| Variables | EGCG group (TT) | EGCG group (AA + AT) | Placebo (A + T) | ||||||
|---|---|---|---|---|---|---|---|---|---|
| Baseline | End | Pa | Baseline | End | Pa | Baseline | End | Pa | |
| BMI | 29.48 ±4.48 | 29.10 ±4.22 | 0.03 | 29.59 ±4.06 | 29.20 ±4.03 | 0.01 | 28.35 ±3.57 | 28.52 ±3.75 | 0.37 |
| SBP | 14.28 ±2.39 | 14.03 ±2.02 | 0.65 | 14.69 ±2.63 | 13.99 ±2.20 | 0.25 | 13.18 ±2.24 | 12.68 ±2.09 | 0.13 |
| DBP | 8.96 ±1.05 | 8.92 ±1.13 | 0.88 | 9.16 ±1.24 | 8.55 ±0.95 | 0.03 | 8.08 ±1.32 | 7.88 ±1.23 | 0.32 |
| Heart rate | 82.17 ±9.85 | 81.29 ±10.54 | 0.64 | 80.15 ±9.82 | 80.26 ±10.85 | 0.95 | 87.17 ±12.05 | 89.58 ±15.01 | 0.41 |
| MAP | 10.74 ±1.26 | 10.62 ±1.25 | 0.71 | 11.01 ±1.46 | 10.37 ±1.20 | 0.03 | 9.78 ±1.56 | 9.48 ±1.42 | 0.18 |
| TG | 169.10 ±80.32 | 161.75 ±74.21 | 0.47 | 188.70 ±133.52 | 159.40 ±79.74 | 0.10 | 210.95 ±106.114 | 221.35 ±97.22 | 0.62 |
| TC | 171.65 ±34.62 | 163.15 ±42.12 | 0.13 | 170.55 ±32.85 | 157.90 ±37.87 | 0.01 | 154.70 ±39.22 | 157.00 ±43.95 | 0.69 |
| LDL-C | 84.55 ±28.11 | 82.83 ±36.08 | 0.70 | 79.70 ±27.99 | 78.14 ±33.56 | 0.71 | 68.68 ±26.67 | 69.00 ±30.66 | 0.94 |
| HDL-C | 50.35 ±8.65 | 49.70 ±8.26 | 0.28 | 52.15 ±7.87 | 50.95 ±6.95 | 0.25 | 47.35 ±9.33 | 48.60 ±10.49 | 0.32 |
| VLDL | 33.89 ±16.27 | 32.44 ±15.04 | 0.49 | 39.42 ±29.69 | 31.97 ±16.20 | 0.09 | 41.90 ±20.82 | 44.29 ±19.37 | 0.57 |
| AIP | 0.46 ±0.22 | 0.49 ±0.23 | 0.48 | 0.49 ±0.27 | 0.45 ±0.22 | 0.15 | 0.45 ±0.21 | 0.49 ±0.30 | 0.45 |
| IL-6 | 2.04 ±1.23 | 1.96 ±1.31 | 0.85 | 2.60 ±2.17 | 2.15 ±1.36 | 0.45 | 1.88 ±1.76 | 1.83 ±1.22 | 0.89 |
| hs-CRP | 3.55 ±0.65 | 3.74 ±0.29 | 0.25 | 3.68 ±0.27 | 3.63 ±0.39 | 0.47 | 4.68 ±0.42 | 4.65 ±0.36 | 0.77 |
| TAC | 0.38 ±0.16 | 0.39 ±0.08 | 0.69 | 0.38 ±0.18 | 0.40 ±0.09 | 0.76 | 0.36 ±0.14 | 0.29 ±0.30 | 0.32 |
BMI – body mass index, SBP – systolic blood pressure, DBP – diastolic blood pressure, MAP – mean arterial pressure, TG – triglyceride, TC – total cholesterol, LDL-C – low-density lipoprotein cholesterol, HDL-C – high-density lipoprotein cholesterol, VLDL – very low-density lipoprotein, AIP – atherogenic index of plasma, IL-6 – interleukin-6, hs-CRP – high-sensitivity C-reactive protein, TAC- total antioxidant capacity. All values are means ± SD.
In both EGCG groups we observed a significant reduction of BMI after intervention compared with baseline (p < 0.05). However, a significant reduction was observed in DBP, MAP and TC in group EGCG (AA + AT).
Between-group analysis of EGCG effects, regarding FTO-rs9939609, showed that the at-risk (AA/AT) carriers of FTO-rs9939609 had a better response to EGCG in improving BMI and DBP compared with participants with the nonrisk (TT) genotype (Table III). There were no significant differences in other variables after 2 months between risk and nonrisk carriers.
Table III
Between-group analysis of epigallocatechin-3-gallate (EGCG) effects, regarding FTO-rs9939609
| Variables | EGCG group (TT) | EGCG group (AA + AT) Δ | Placebo (A + T) | P-valuea |
|---|---|---|---|---|
| BMI [kg/m2] | 0.37 ±0.72c | –0.39 ±0.66b,d | 0.16 ±0.81 | 0.03 |
| SBP [mm Hg] | –0.24 ±2.38 | –0.70 ±2.57 | –0.49 ±1.34 | 0.99 |
| DBP [mm Hg] | –0.04 ±1.35 | –0.61 ±1.17b,d | –0.20 ±0.84 | 0.03 |
| Heart rate | 0.88 ±7.72 | 0.10 ±7.87 | 2.41 ±9.80 | 0.43 |
| MAP | –0.11 ±1.32 | –0.64 ±1.22 | –0.29 ±0.91 | 0.21 |
| TG [mg/dl] | –7.35 ±45.18 | –29.30 ±76.80 | 10.40 ±92.89 | 0.24 |
| TC [mg/dl] | –8.50 ±24.11 | –12.65 ±20.39 | 2.30 ±25.42 | 0.12 |
| LDL-C [mg/dl] | –1.72 ±20.17 | –1.56 ±18.53 | 0.31 ±20.53 | 0.93 |
| HDL-C [mg/dl] | 0.65 ±2.64 | 1.20 ±4.54 | –0.65 ±2.64 | 0.18 |
| VLDL [mg/dl] | –1.44 ±9.27 | –7.44 ±18.72 | –2.39 ±18.52 | 0.16 |
| AIP | –0.03 ±0.17 | –0.03 ±0.11 | 0.04 ±0.22 | 0.33 |
| IL-6 | –0.08 ±0.41 | –0.45 ±2.67 | –0.04 ±1.27 | 0.78 |
| hs-CRP | 0.19 ±0.75 | 0.05 ±0.32 | 0.02 ±0.33 | 0.25 |
| TAC | 0.01 ±0.19 | 0.01 ±0.23 | 0.07 ±0.32 | 0.44 |
BMI – body mass index, SBP – systolic blood pressure, DBP – diastolic blood pressure, MAP – mean arterial pressure, TG – triglyceride, TC – total cholesterol, LDL-C – low-density lipoprotein cholesterol, HDL-C – high-density lipoprotein cholesterol, VLDL – very low-density lipoprotein, AIP – atherogenic index of plasma, IL-6 – interleukin-6, hs-CRP – high-sensitivity C-reactive protein, TAC- total antioxidant capacity. All values are means ± SD.
Discussion
In the current study, we investigated the modulation of metabolic and inflammatory responses to EGCG supplementation by polymorphism of FTO-rs9939609 in patients with T2DM. After 2 months of intervention, the levels of DBP and BMI were significantly decreased in carriers of the A allele of FTO-rs9939609 in the EGCG group compared with nonrisk carriers (TT). Evidence demonstrated that the minor A allele of the FTO variant rs9939609 has a significant association with the risk of T2DM [21]. However, there are few clinical trials about the effect of this polymorphism on clinical outcomes resulting from interventions.
Previous studies reported a genotype-intervention interaction for the FTO (rs9939609) gene polymorphism [22–24]. Luis et al. investigated the role of the rs9939609 polymorphism of the FTO gene in insulin resistance, metabolic changes and weight loss following a high monounsaturated fat diet vs. a high polyunsaturated fat hypocaloric diet. Their results showed that reductions in BMI, weight and fat mass were better in A allele carriers than TT genotype subjects with a high polyunsaturated fat hypocaloric diet in obese subjects over 3 months [22]. In another study, Zou et al. examined the effects of exercise combined with dietary intervention on obese children and adolescents associated with the FTO-rs9939609 polymorphism. After 4 weeks of intervention, the levels of TC and LDL were significantly reduced in genotype AA (or AT) compared with genotype TT [23]. In addition, a clinical trial in obese subjects with the FTO-rs9939609 gene variant demonstrated that decreases in hs-CRP, TC and LDL levels were larger in A carriers during 3 months of low fat hypo-caloric diet [24]. In contrast, some studies did not report the role of FTO-rs9939609 polymorphism in response to interventions. Schum et al. studied the effects of FTO (rs9939609) gene polymorphism on body composition and metabolism following a 6-month lifestyle intervention in overweight children. FTO variant rs9939609 had no impact on BMI, body composition and metabolic profile (insulin, HOMA, lipids, liver function tests) before and after lifestyle intervention [25]. Different interventions, type and characteristics of study persons are potential reasons for discrepant findings.
This study showed that taking EGCG supplements for 2 months in patients T2DM was associated with a significant decrease in serum cholesterol level, but did not influence other lipid profiles (TG, HDL and LDL). Similar to our findings, a systematic review suggested that administration of EGCG (107–856 mg/day) for 4 to 14 weeks reduced the level of serum LDL-C (by –9.29 mg/dl) in healthy individuals [26]. In addition, Zheng et al. in a meta-analysis observed that the consumption of beverages and extracts of green tea caused a decrease in serum concentrations of TC (by 7.20 mg/dl) and LDL cholesterol (by 2.19 mg/dl), but did not significantly improve HDL cholesterol level [27]. Possible mechanisms by which EGCG decreases plasma cholesterol include: interfering with the micellar solubilization of cholesterol in the digestive tract and decreased absorption [20], enhanced biliary cholesterol secretion and attenuated liver cholesterol accumulation [28], induced up-regulation of LDL receptor in HepG2 cells [29].
In contrast to our results, a double-blind clinical trial studied the effect of decaffeinated green tea extract (856 mg of EGCG) on obese individuals with type 2 diabetes [30]. No significant differences were reported between the EGCG and placebo groups in FBS and lipid profile (TG, Chol, HDL and LDL). However, a significant reduction in WC, HbA1c, insulin and HOMA-IR levels was reported after EGCG intervention compared to baseline [30]. Also, Mielgo-Ayuso et al. examined the effects of EGCG (300 mg/day for 12 weeks) in obese women. No significant difference was reported in the weight, fat mass, energy and fat metabolism, TG, cholesterol and LDL, or insulin resistance after EGCG intervention [31]. These discrepancies in results might be due to the different dosages, duration of the intervention, sample size, and clinical characteristics of the patients at baseline.
In our study, intervention of EGCG caused a significant reduction in DBP level. In the context, most previous studies were consistent with our results. A meta-analysis suggested that green tea consumption significantly decreased SBP (–1.98 mm Hg) and DBP (–1.92 mm Hg) levels compared with the placebo group [32]. Furthermore, a meta-analysis (thirteen studies) reported that green tea and its catechins can improve blood pressure (SBP, by –2.08 mm Hg, and DBP, by –1.71 mm Hg), and the effects may be greater in people with hypertension (SBP ≥ 130 mm Hg) [33]. In another study, Han et al. reported that EGCG inhibited caffeine-induced cardiovascular activity such as arterial pressure and heart rate [34]. Epigallocatechin-3-gallate reduces blood pressure through several mechanisms such as: maintaining vascular tone through balancing vasoconstricting and vasodilating substances [35], improving ventricular function and increasing nitric oxide production from endothelium [36] and reducing oxidative stress and managing the generation of ROS through inducing antioxidant enzymes and inhibiting pro-oxidant enzymes [37].
The present study is among the first clinical trials to investigate the effects of genotype-intervention interaction for the FTO-rs9939609 polymorphism on response to EGCG supplementation on metabolic and inflammatory changes in T2DM.
In conclusion, the results of this study show that intervention with EGCG supplements for 2 months in patients with T2DM had a significant improvement on BMI and DBP in A allele carriers of FTO-rs9939609 polymorphism, a high-risk group for T2DM; however, it did not affect inflammation and other lipid profiles. This study suggests that administration of EGCG supplement may provide an advantageous therapy for patients with T2DM by using genome-customized approaches.