
Introduction
Resting heart rate is a strong independent risk factor in patients with a variety of cardiovascular diseases, including coronary heart disease and left ventricular dysfunction [1]. At present, the drugs most commonly used to clinically slow the heart rate are β-blockers. However, for patients with asthma, atrioventricular block, decompensated congestive heart failure, hypotension, or peripheral vascular disease, the application of β-blockers is restricted to a certain limit. Because ivabradine (IVA) has no negative impact on cardiac muscular strength or the conductive system and is especially suitable for patients with heart failure, it has been used as an alternative to β-blockers to clinically control the sinus rhythm. The mechanism by which IVA slows spontaneous activity is through inhibiting the pacemaker current (If) by auto-specifically reducing the If conductance, which in turn reduces the pacing frequency of P cells in the sinus node [2]. Meanwhile, IVA has no adverse effects on the atrioventricular conduction system, ventricular systolic and diastolic function, or blood pressure [3].
Heart rate has a substantial influence on the prognosis of ischemic heart disease. Myocardial oxygen consumption increases with heart rate. Furthermore, an elevated heart rate can reduce the oxygen supply of the myocardium and promote both anatomical and electrical remodeling after myocardial infarction (MI) [4]. IVA controls heart rate without affecting the myocardial contractile function, ensuring safety and patient tolerance of the drug. A number of animal studies have revealed that IVA protects cardiac structure and myocardial function from being damaged after acute myocardial infarction (AMI) [5, 6]. In addition, it can reduce the incidence of ventricular tachycardia (VT)/ventricular fibrillation (VF) after AMI [7]. β-Blockers, such as metoprolol (MET), have been shown to reconstruct myocardial remodeling, reduce ventricular arrhythmia, and improve prognosis during the repair period of MI; this has been confirmed by a number of clinical studies and animal trials [8, 9]. Assuming that IVA also has the effect of improving myocardial remodeling and electrical remodeling during the repair period of MI, it is possible that IVA may reduce the occurrence of ventricular arrhythmia.
Material and methods
Main materials and reagents
IVA, MET, Cx-43 antibody (ID:3511S), p-Cx43 (Ser368) antibody (ID:3512S), and PVDF membranes were respectively purchased from Servier Pharmaceuticals GmbH (France), AstraZeneca Pharmaceutical Co., Wuhan Sanying Biotechnology Co., Cell Signaling Technology, and Millipore Corporation (USA). Hypersensitive two-step immunohistochemistry detection reagents of rabbit and goat anti-rabbit IgG, and other reagents were purchased from Wuhan Sevia Biotechnology Co.
Experimental animals and grouping
A total of 60 specific-pathogen-free (SPF) male Sprague-Dawley rats, weighing 230–280 g, were purchased from Shanghai Slack Laboratory Animal Co. (License No.: SCXK (Shanghai) 2012-0002, animal certificate number: 201500054135), and subjected to adaptive feeding for 1 week. The rats were then randomly divided into five groups according to the random number table, with 12 rats in each group. MI group rats received left anterior descending (LAD) coronary artery ligation and a normal diet; IVA group rats were treated with 10 mg/(kg × day) of IVA [10] by gavage after ligation of the LAD coronary artery; MET group rats were treated with 50 mg/(kg × day) of MET [11] by gavage after ligation of the LAD coronary artery; IVA + MET group rats received 10 mg/(kg × day) of IVA + 50 mg/(kg × day) of MET by gavage after ligation of the LAD coronary artery; and sham group rats received a normal diet and only ligature (without ligation) of the LAD coronary artery. The drug treatment was started 24 h after ligation of the anterior descending coronary artery. The interventions lasted for 4 weeks. The protocol was approved by ethics committees in Fujian Medical University Union Hospital. During the experiment, the researchers followed the internationally recognized animal welfare guidelines and the Guidelines for the Care and Use of Laboratory Animals published by the National Institutes of Health.
Preparation for the animal model of myocardial infarction
The rats were intraperitoneally anesthetized with 1% sodium pentobarbital (5 ml/kg), and fixed and prepared for skin disinfection. Then, tracheal intubation was performed and cannula was connected to the ventilator. Next, the chest skin was cut at approximately 3 cm longitudinally alongside the left 3 mm of the sternum, the pectoralis major and anterior serratus muscle were separated by blunt dissection, the intercostal muscle was cut off along the third intercostal space, and piercing was performed through the pleura. After this, the ribs were opened, a cut was made in the pericardium to reveal the heart, and a 5-0 line was used to suture the proximal LAD coronary artery (2 mm below the junction of the pulmonary artery cone and left atrial appendage). Certain observation targets were set as the termini of MI, including the appearance of > 0.2 mV of ST-segment elevation on more than two limb leads, and the myocardium in the left ventricular anterior wall turning from red to white, with its movement restricted. It was assumed that the MI model was successfully established when all the above targets were reached after 10 min of surgery. In the process of modeling, the researchers used a blind method to model the group of rats. So did the researchers who did the electrophysiological examination.
Heart rate and blood pressure measurements
The heart rate and blood pressure of the rats were measured before surgery, and after 4 weeks of MI modeling. After starting the non-invasive blood pressure measurement system (BP-2010, Softron), the rats were maintained in a quiet environment for 15 min, and fixed in the device. Then, heart rate and blood pressure were measured once every 5 min, and averaged after three measurements.
Electrophysiological detection [12]
At 4 weeks after the establishment of the MI model, anesthesia, fixation, connection to the ventilator and exposure of the heart were successively performed. Then, the heart was connected to a multi-conducting physiological recorder (GY-6000F, Henan South China Medical) to determine the following parameters in sequence: (1) QRS wave and QT interval, QTc (II lead). (2) Ventricular effective refractory period (VERP). The electrode was vertically placed on the anterior wall of the left ventricle, stimulation was induced from S1S2, and the basic perimeter was set at 130 ms. The S2 stimulation was progressively decreased from 90 ms to the minimum to attain the VERP. (3) VERP dispersion (VERPd). The VERP of the myocardium in the ventricular anterior wall and side wall were measured, the difference in the value of VERP between any two places was calculated, and the maximum difference was taken as VERPd. (4) Induction rate and fatality rate of VT/VF. The right ventricular anterior wall was stimulated with S1S1 40-ms bursts for 10 s; this was repeated three times, with a 3-minute interval. Then, the induction rate and fatality rate of VT/VF were recorded. The range of VT/VF was 2 ms when the stimulation output was two times the threshold.
Pathological observation of the left ventricle
The heart was collected, and the left ventricle was separated along the level of the papillary muscles into two parts: the horizontal part of the papillary muscle, and the apex part. The myocardium of the horizontal part of the papillary muscle was placed in 10% neutral formalin for 24 h, and dehydrated and paraffin-embedded. Then, the paraffin-embedded sections were consecutively cut into a total of 24 slices, with a thickness of 4 µm. Under an optical microscope, six slices were stained with hematoxylin and eosin (H&E), ten fields were randomly selected from each slice, and the ratio of the myocardial infarcted area to the total area (percentage) was calculated using the IPP 6.0 image analysis system. Next, six slices were stained with Masson’s staining, ten fields were randomly selected from each slice, and the collagen volume fraction (CVF) was calculated using the IPP 6.0 image analysis system. Immunohistochemistry was applied to the remaining 12 slices. After immunohistochemical preparation, 100× microphotographs were taken for each group, and the positive expression of p-Cx43 and t-Cx43 in the left ventricular myocardium of SD rats in each group was detected through the multifunctional true color cell image analysis and management system. The brown cells located at the longitudinal junction and side of the cardiomyocytes were positively expressed. After hematoxylin counterstaining, the cells with blue-black nuclei were the total number of cells, so that the percentage of positive expressing cells could be calculated.
Western blot
Western blot was performed to detect the expression of p-Cx43 and t-Cx43 in the left ventricular myocardium. The apex was collected and homogenized for protein extraction and quantification. Then, SDS-PAGE loading buffer was added to 60 µg of protein sample, and the sample was heated and centrifuged and applied on 4–12% gradient precast gel for electrophoresis. A PVDF membrane was used as the solid-phase supporter. Next, the corresponding protein monoclonal antibody was added after transfection and blocking, the bivalent antibody was labeled, and the X-ray tablet was placed on an automatic processor for development and fixation. This was then scanned and analyzed, and the gray value of each band was calculated using the gel image system. The relative protein expression level was presented as the ratio of the gray value corrected by the internal reference GAPDH.
Statistical analysis
Statistical analysis was performed using SPSS 24.0 statistical software. The measurement data of normal distribution was presented as x ± standard deviation (SD). A mean-score comparison between groups was performed using variance analysis, which was applied to completely randomized design data. When the results of the variance analysis were found to be statistically significant, an LSD t-test was used for further comparison. Non-normally distributed measurement data were presented as M (Q1, Q3). The non-parametric rank sum test was used for comparison between groups. Count data were presented as the composition ratio. The χ2 test was used for comparison between groups. P < 0.05 was considered statistically significant.
Results
Variations in blood pressure and heart rate (Table I)
There was no statistically significant difference in either systolic blood pressure or diastolic blood pressure between any two groups before modeling, or after the 4-week drug intervention (for all, p > 0.05). Furthermore, there was no statistically significant difference in heart rate between any two groups before the modeling (p > 0.05). After the 4-week drug intervention, there was no significant difference in heart rate between the MI group and sham group (p > 0.05); however, heart rates were significantly slower in the IVA, MET, and IVA + MET groups, compared with the MI group (p < 0.01). There was no significant difference in heart rate between the IVA group and MET group (p > 0.05); however, compared with the MET group, the heart rate was slower in the IVA + MET group (p < 0.01).
Table I
Heart rate and blood pressure of each group of rats (x ± s)
| Variable | Before modeling | After 4 weeks | ||||||
|---|---|---|---|---|---|---|---|---|
| Number of rats | Heart rate [beats/min] | Systolic blood pressure [mm Hg] | Diastolic blood pressure [mm Hg] | Number of rats | Heart rate [beats/min] | Systolic blood pressure [mm Hg] | Diastolic blood pressure [mm Hg] | |
| MI group | 12 | 404 ±9 | 111 ±10 | 70 ±8 | 11 | 407 ±9f | 115 ±8 | 69 ±6 |
| IVA group | 12 | 399 ±7 | 114 ±9 | 71 ±9 | 12 | 305 ±13de | 116 ±9 | 69 ±6 |
| MET group | 12 | 405 ±14 | 112 ±9 | 69 ±9 | 12 | 314 ±10de | 115 ±9 | 72 ±7 |
| IVA + MET group | 12 | 400 ±11 | 113 ±9 | 72 ±8 | 11 | 236 ±14def | 115 ±8 | 73 ±9 |
| Sham group | 12 | 406 ±10 | 112 ±8 | 73 ±6 | 12 | 408 ±9f | 116 ±7 | 72 ±7 |
| F value | 0.938 | 0.166 | 0.345 | 494.727 | 0.080 | 0.672 | ||
| P-value | 0.449 | 0.955 | 0.847 | 0.000 | 0.988 | 0.614 | ||
Electrophysiological detection results (Table II)
One rat died in the MI group and another rat died in the MET + IVA group after the MI model was established. After 4 weeks of intervention, and compared with the sham group, QT and QTc interval was prolonged, VERP was shortened, VERPd was higher, and the induction rate and fatality rate of VT/VF were higher in the MI group (all p < 0.01). Compared with the MI group, QT and QTc interval was shorter, VERP was longer and VERPd was lower in the IVA group, MET group, and IVA + MET group (for all, p < 0.01). Compared with the MI group, the induction rate and fatality rate of VT/VF were lower in the IVA group and MET group (for all, p < 0.05); the induction rate and fatality rate of VT/VF also were lower in the IVA + MET group (p < 0.01 and p < 0.05, respectively). No statistically significant difference was observed between the MET group and IVA group in QT and QTc interval, VERP, VERPd, or induction rate and fatality rate of VT/VF (all p > 0.05). Compared with the MET group, the QT and QTc interval was shorter (p < 0.01), VERP was longer (p < 0.05), and VERPd and the induction rate of VT/VF were lower (both p < 0.05) in the IVA + MET group, but there was no statistically significant difference in the fatality rate of VT/VF (p > 0.05).
Table II
Electrophysiological test results in each group
| Variable | Number of rats | QRS wave time limit x ± s [ms] | QT interphase x ± s [ms] | QTc x ± s [ms] | VERP x ± s [ms] | VERPd x ± s [ms] | VT/VF inducing rate x/n | VT/VF fatality rate y/n |
|---|---|---|---|---|---|---|---|---|
| MI group | 11 | 21.8 ±1.3 | 78.5 ±4.0ac | 204.3 ±11.3df | 50.2 ±4.7df | 18.6 ±2.2df | 10/11cd | 5/11ac |
| IVA group | 12 | 21.9 ±1.6 | 68.6 ±4.2ab | 154.7 ±10.5e | 60.0 ±3.4de | 10.7 ±2.7de | 6/12ab | 1/12b |
| MET group | 12 | 21.8 ±1.3 | 69.1 ±5.3ab | 157.9 ±12.0e | 60.6 ±3.9de | 10.3 ±2.7de | 6/12ab | 1/12b |
| IVA + MET group | 11 | 21.6 ±1.4 | 62.7 ±3.8bc | 124.4 ±8.9def | 64.1 ±2.9ce | 7.4 ±2.0ef | 1/11ce | 1/11b |
| Sham group | 12 | 21.7 ±1.4 | 60.7 ±4.8bc | 158.1 ±12.2e | 66.2 ±3.7ef | 5.8 ±2.3ef | 1/12ce | 1/12b |
| F value | 0.129 | 27.083 | 73.020 | 30.380 | 46.524 | |||
| P-value | 0.971 | 0.000 | 0.000 | 0.000 | 0.000 |
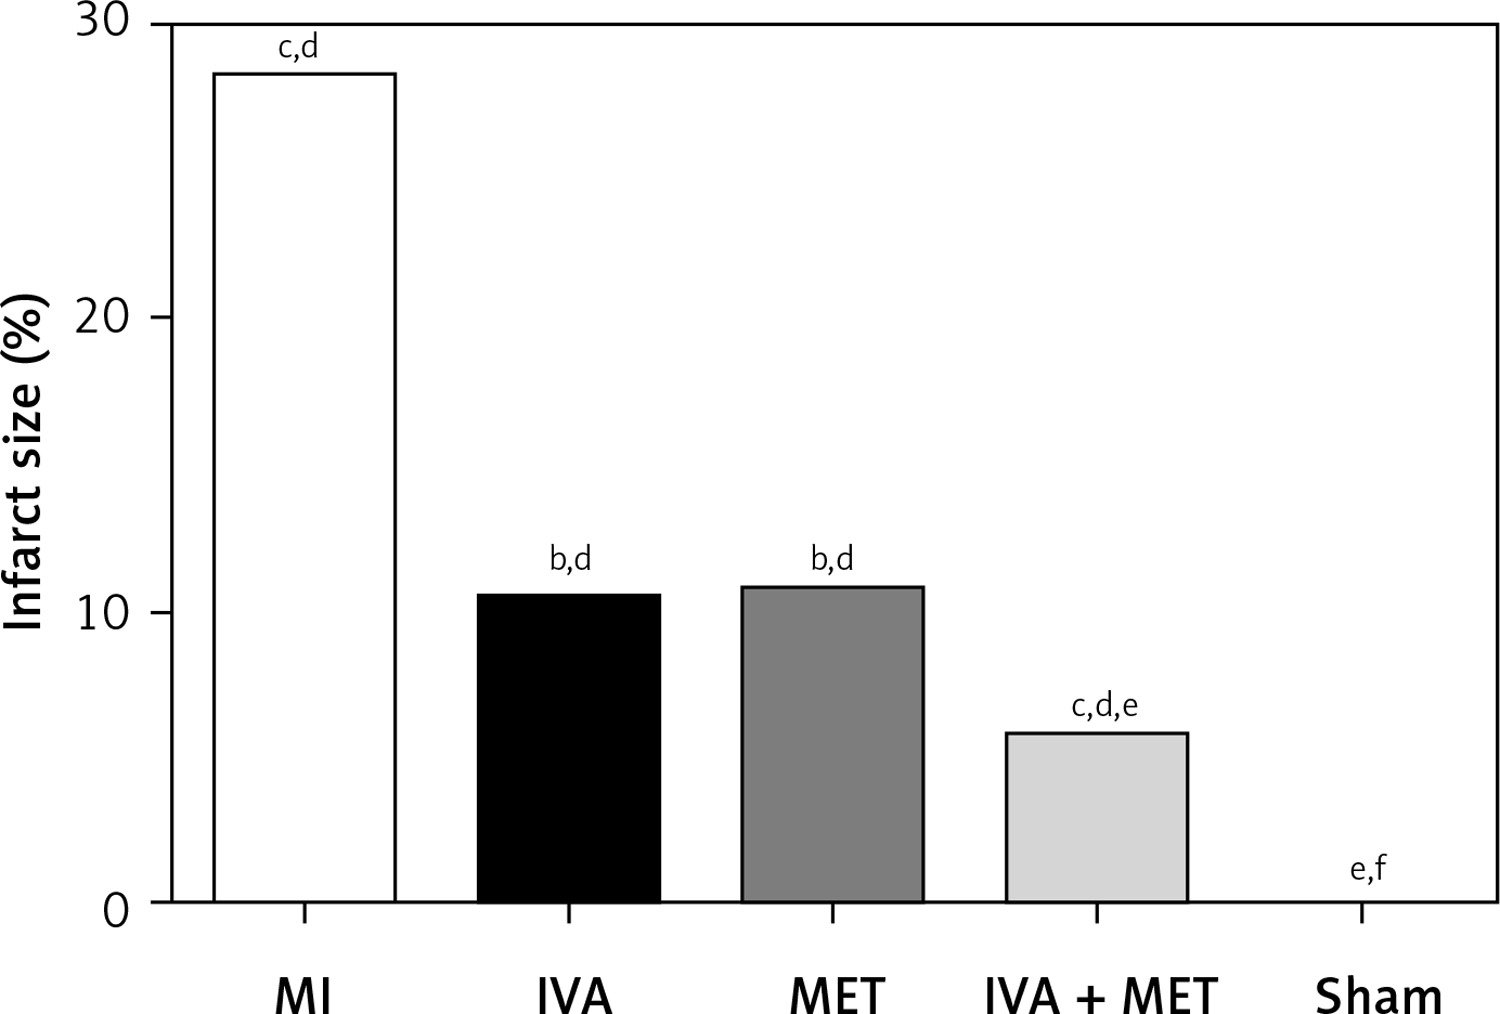
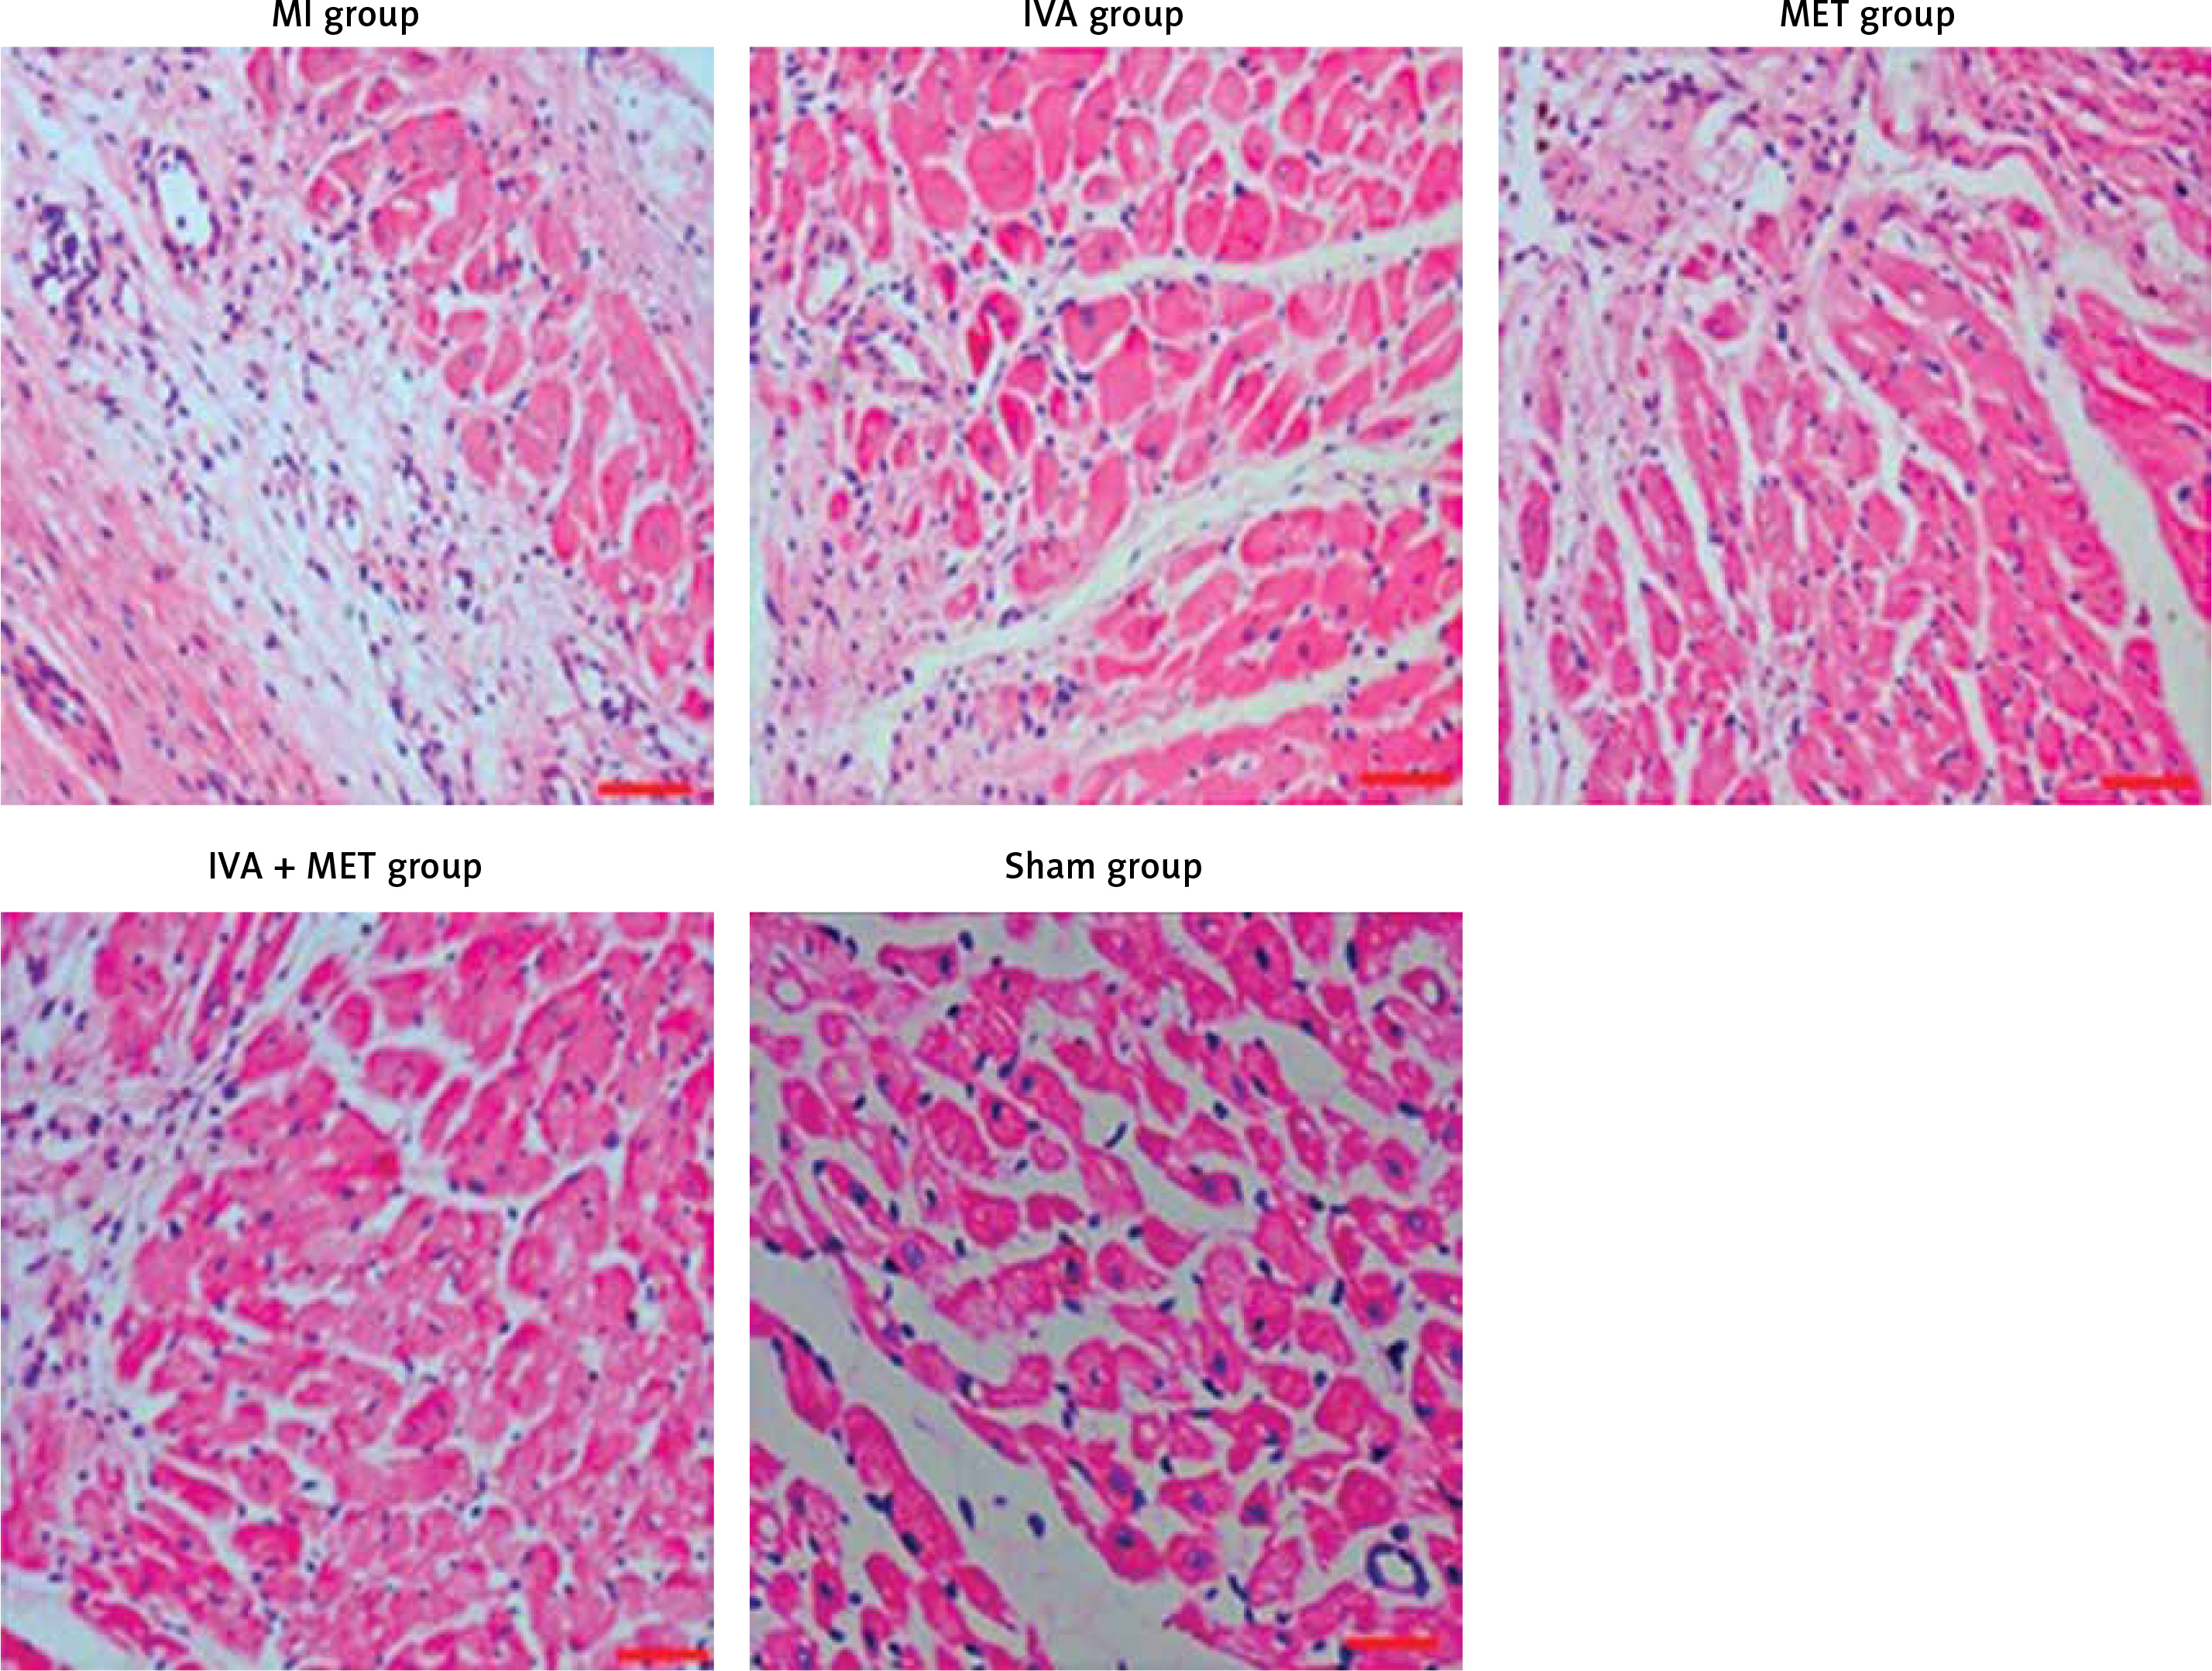
H&E staining results (Figures 1 and 2)
In the sham group, the left ventricular cardiomyocytes were neatly arranged, while in the MI group, large infarctions had formed, including the fragmentation of cellular nucleuses and increased infiltration of chronic inflammatory cells. The left ventricular infarction areas (x ± SD, %) in the MI, IVA, MET, IVA + MET, and sham groups were 28.3 ±7.4%, 10.5 ±2.5%, 10.8 ±2.5%, 5.9 ±1.1%, and 0.0 ±0.0%, respectively. The left ventricular infarction area was larger in the MI group than in the sham group (p < 0.01); however, it was smaller in each of the mg IVA, MET, and IVA + MET groups than in the MI group (p < 0.05, p < 0.05, and p < 0.01, respectively). While no statistically significant difference was observed in left ventricular infarction area between the MET group and IVA group (p > 0.05), in the IVA + MET group the left ventricular infarction area was smaller than in the MET group (p < 0.05).
Figure 1
Area ratio of each group of myocardial infarction rats. Compared with the sham group, ap < 0.05; compared with the MI group, bp < 0.05; compared with the MET group, cp < 0.05; compared with the sham group, dp < 0.01; compared with the MI group, ep < 0.01; compared with the MET group, fp < 0.01
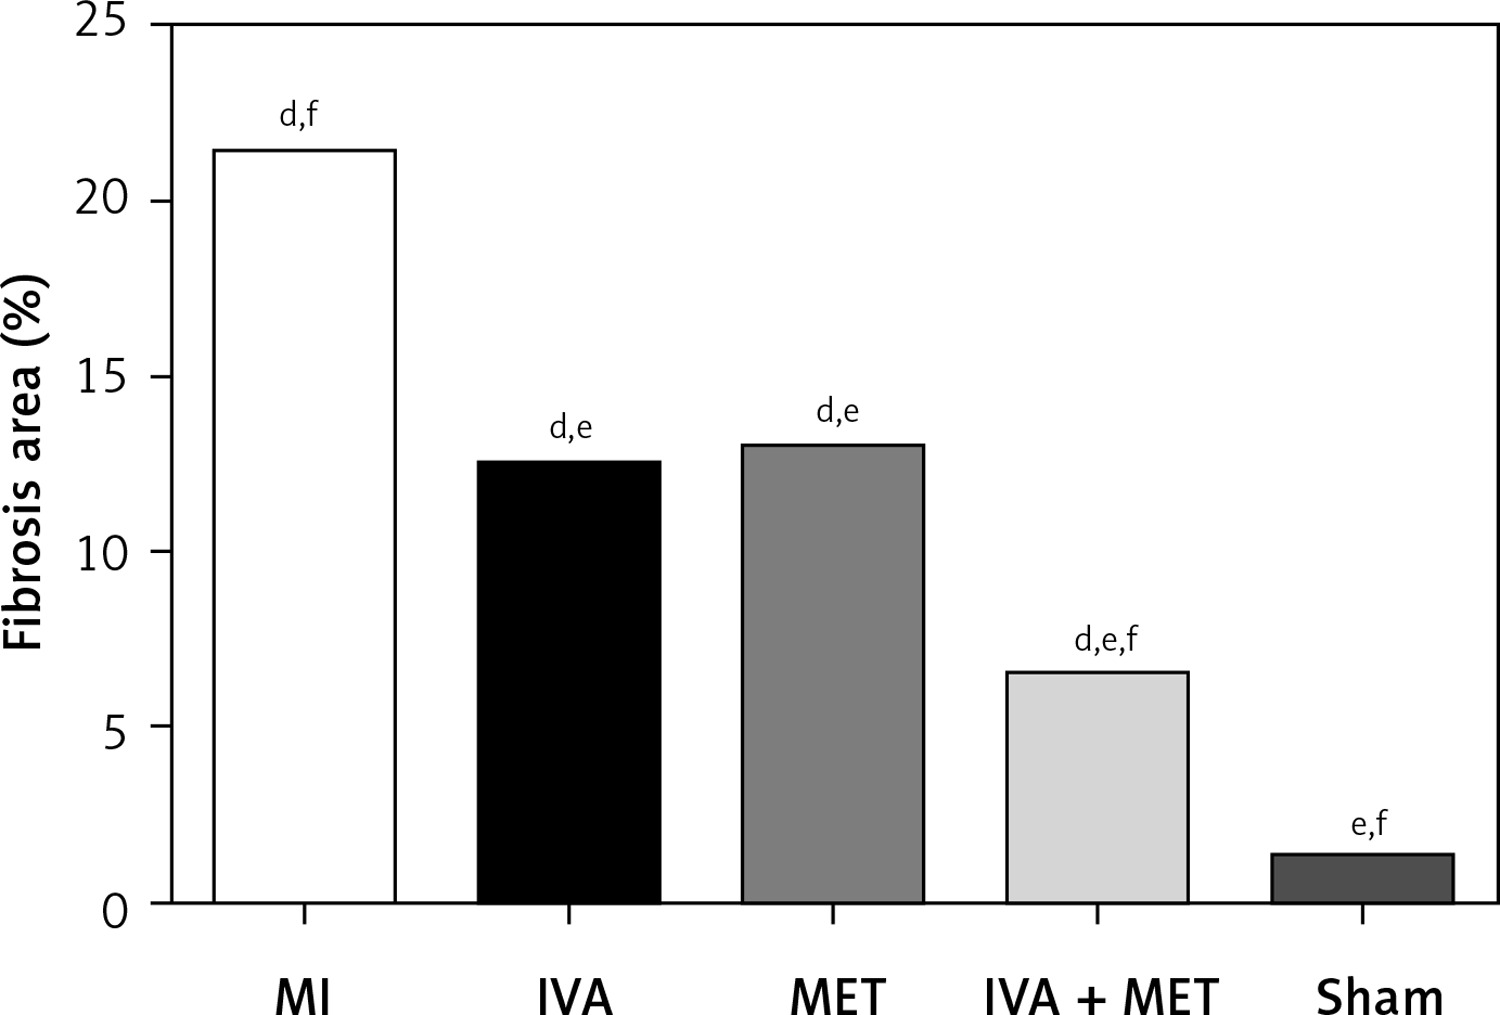
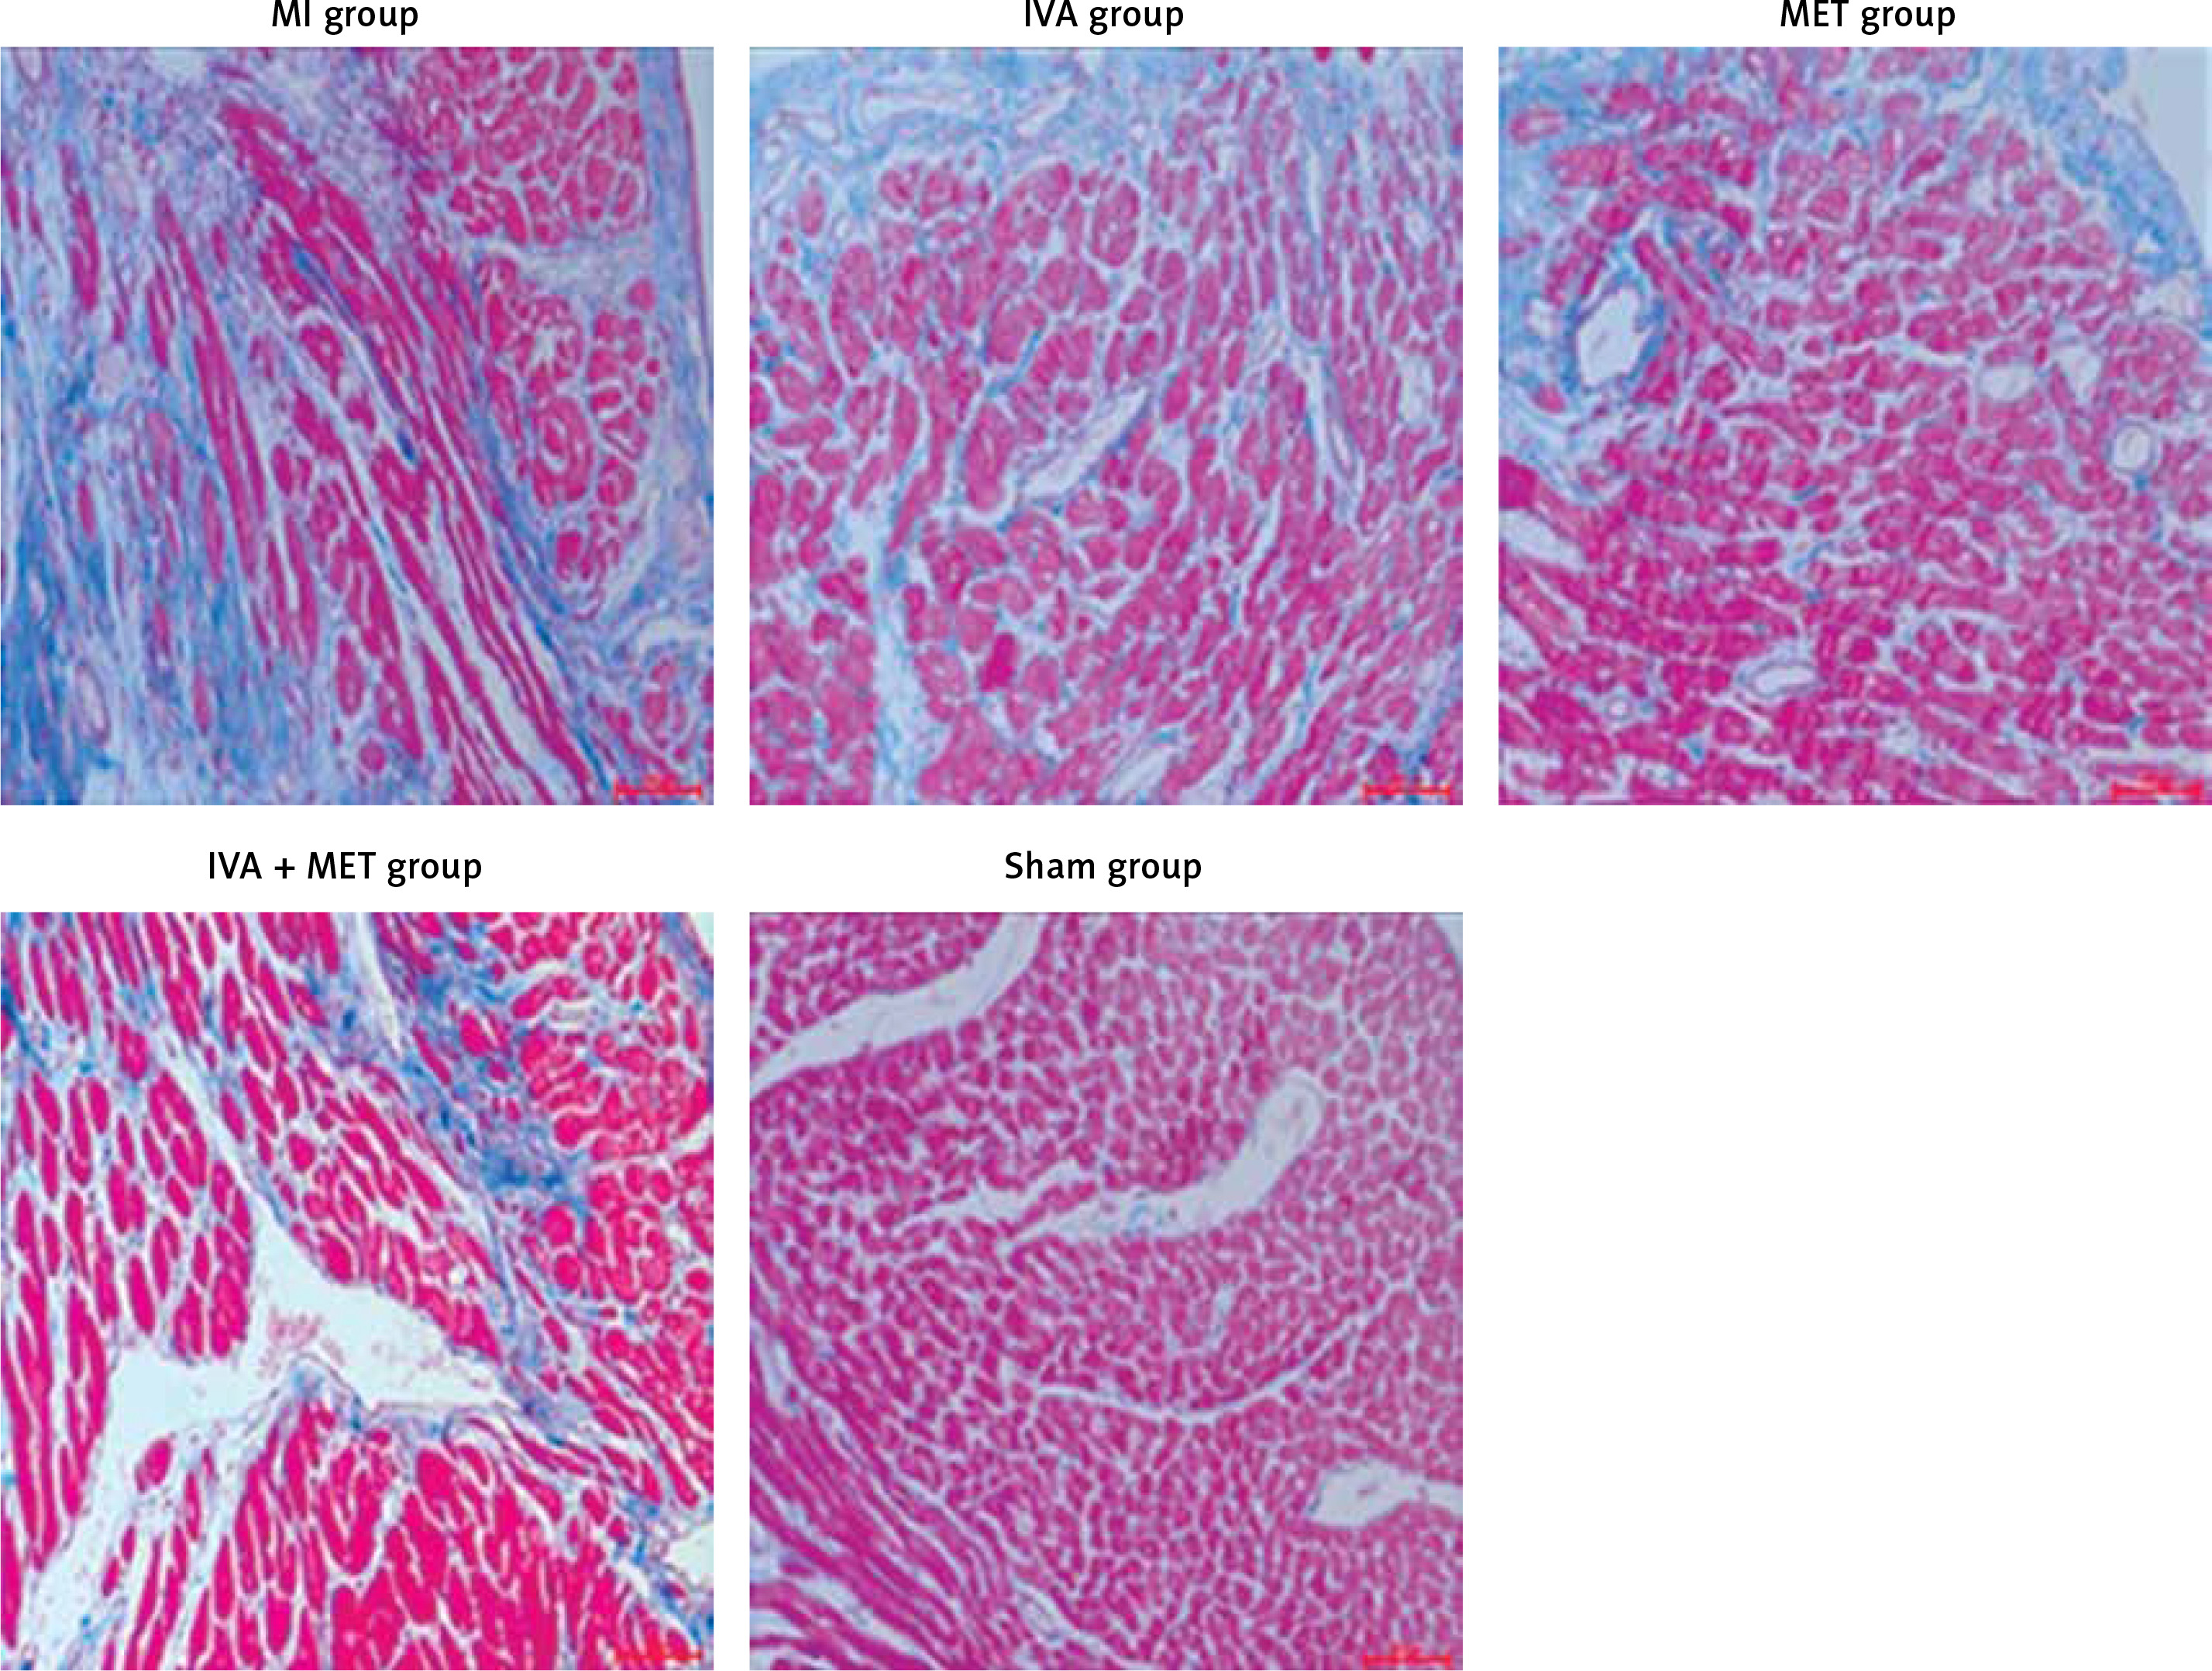
Masson’s staining results (Figures 3 and 4)
The ventricular myocardial CVF (x ± SD, %) in the MI, IVA, MET, IVA + MET, and sham groups was 21.4 ±3.2%, 12.5 ±2.5%, 13.0 ±3.1%, 6.5 ±1.4% and 1.3 ±1.4%, respectively. The left ventricular CVF was larger in the MI group than in the sham group (p < 0.01), and smaller in the IVA, MET, and IVA + MET groups than in the MI group (p < 0.01). While no significant difference was observed in the left ventricular CVF between the IVA group and MET group (p > 0.05), the left ventricular CVF was smaller in the IVA + MET group than in the MET group (p < 0.01).
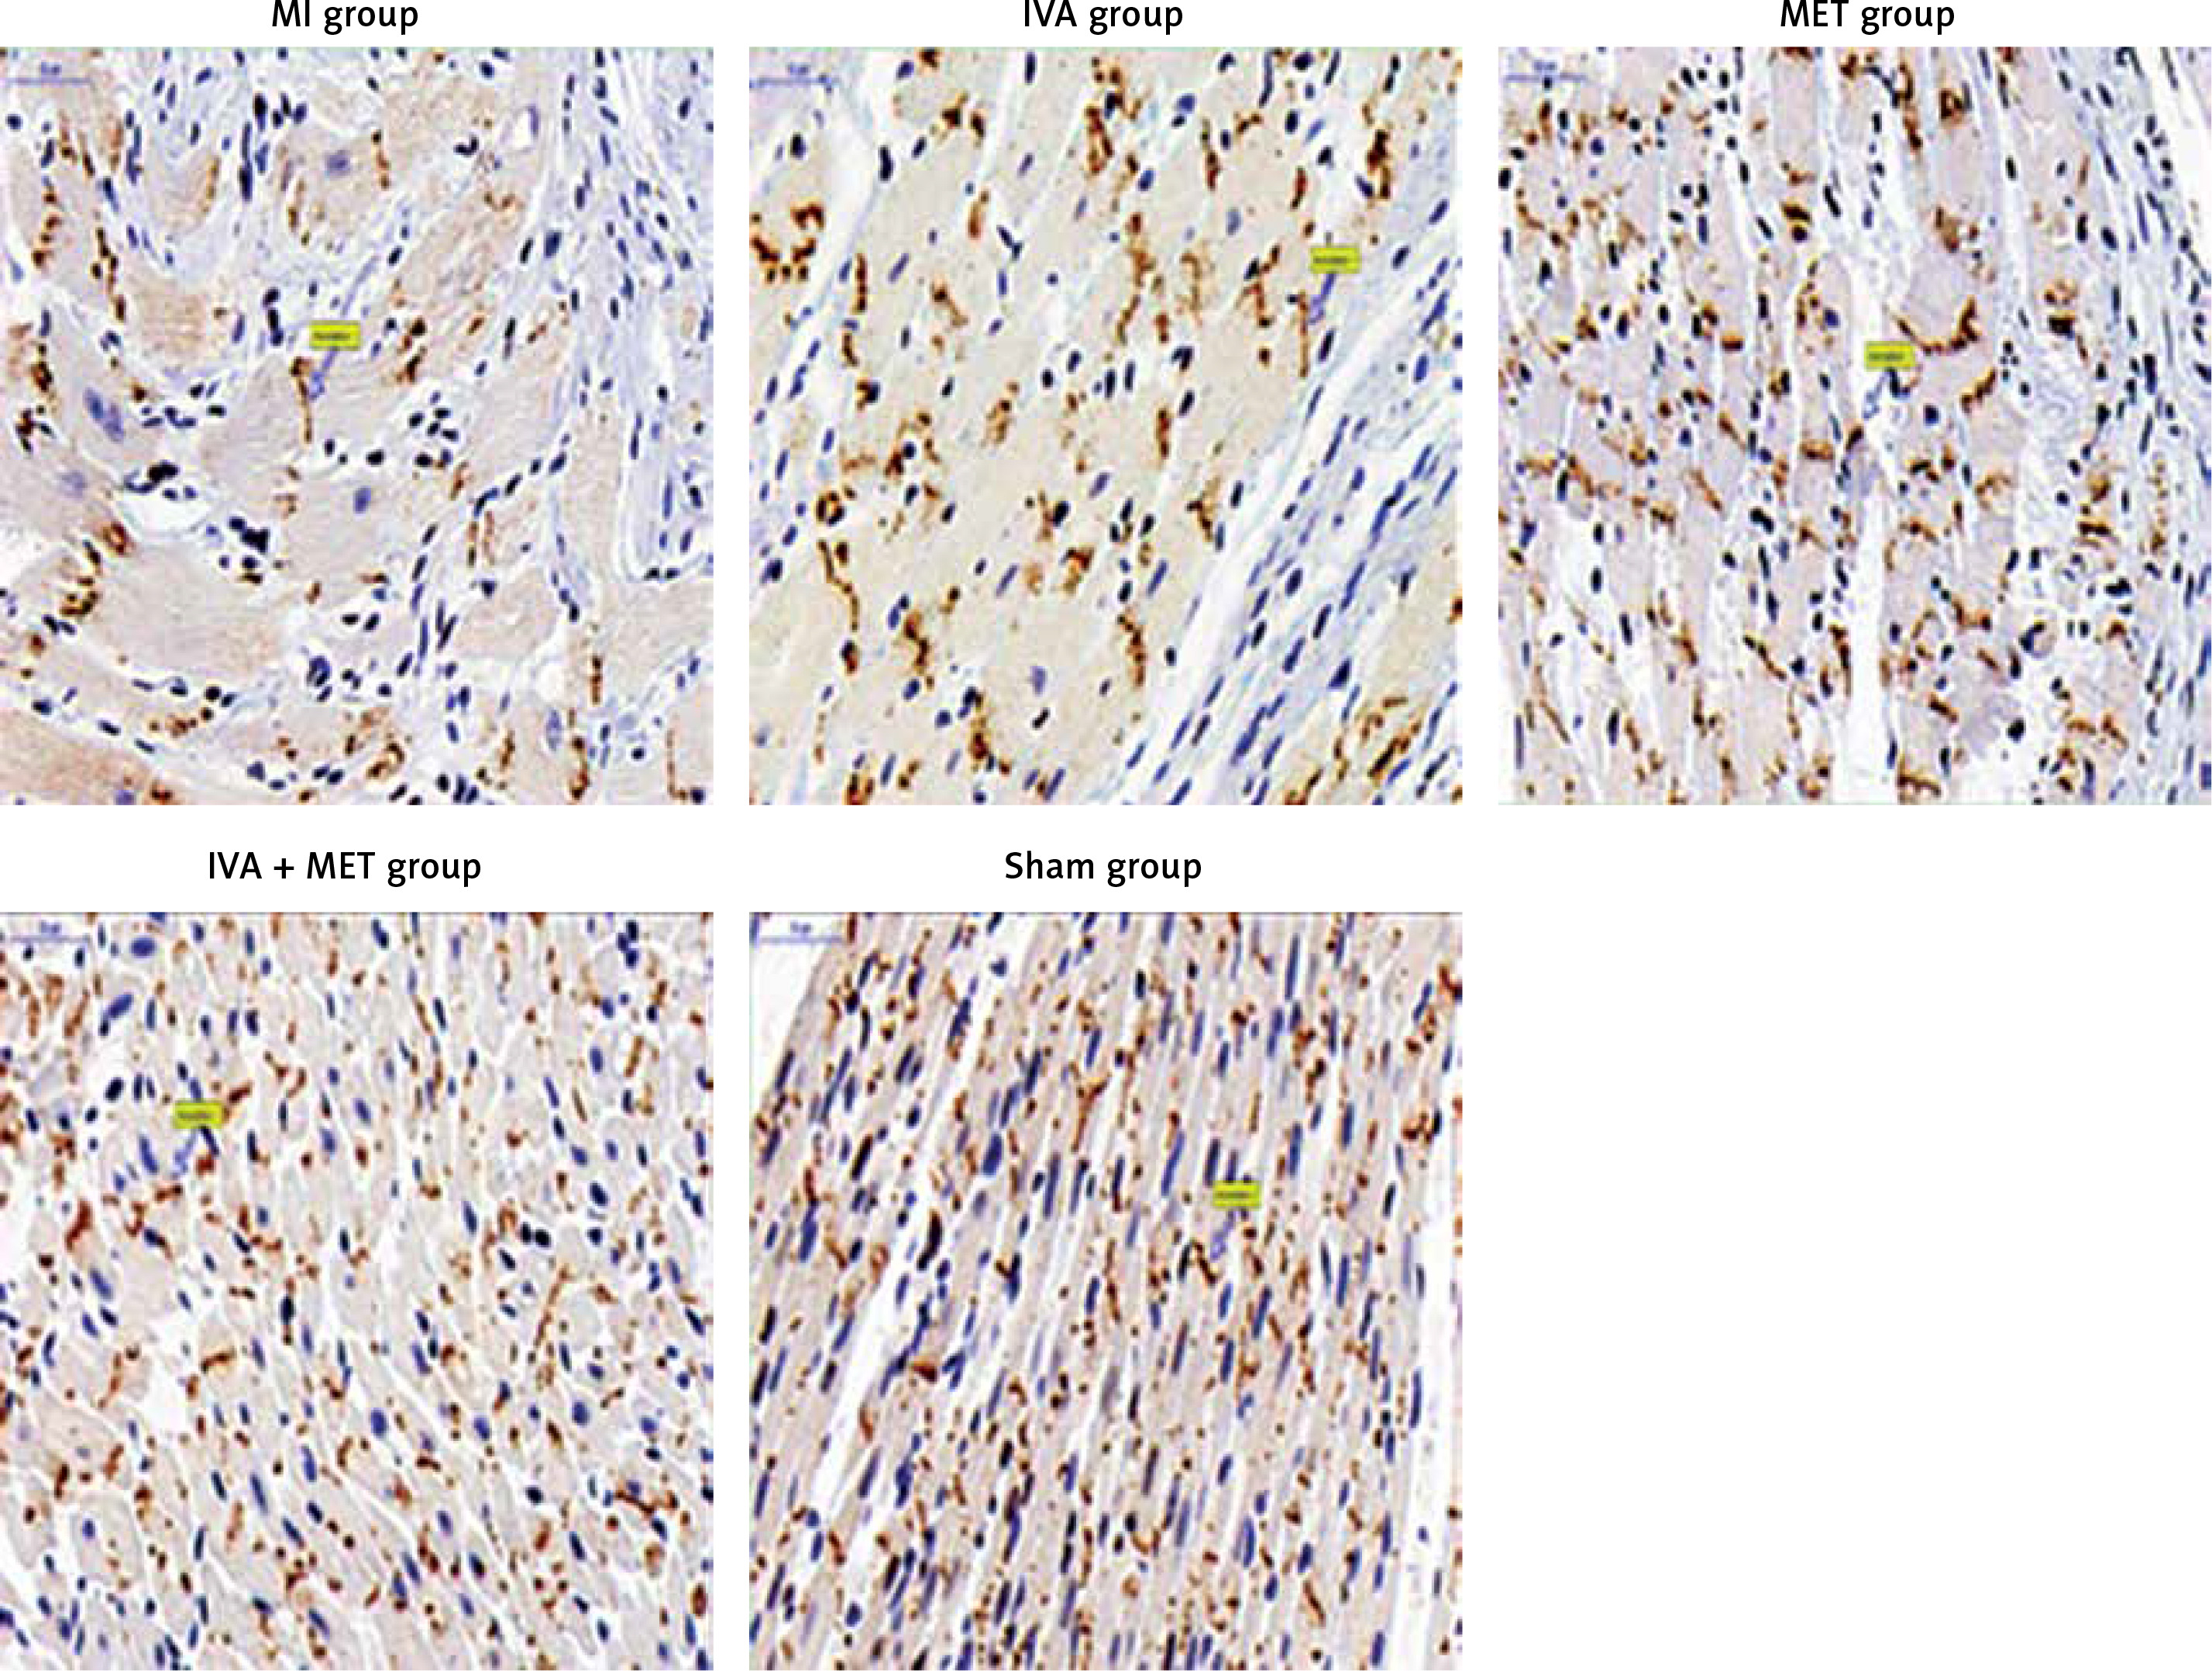
Distribution and expression of p-Cx43 and t-Cx43 in the left ventricle myocardium (immunohistochemistry: Table III and Figure 5)
Compared with the sham group, p-Cx43 protein expression was lower in the MI group (p < 0.01); it was greater in the IVA, MET, and IVA + MET groups than in the MI group (p < 0.01). While there was no statistically significant difference in p-Cx43 protein expression between the IVA group and MET group (p > 0.05), p-Cx43 protein expression was greater in the IVA + MET group than in the MET group (p < 0.01). However, there was no statistically significant difference in left ventricular anterior wall t-Cx43 expression between any two groups (p > 0.05). In the sham group, both the p-Cx43 and t-Cx43 protein were almost uniformly distributed in the longitudinal junction of the myocardium. In the MI group, the majority of the p-Cx43 and t-Cx43 proteins were distributed in the lateral–lateral junction of myocardial cells, while few were distributed in the longitudinal junction of the myocardium. The distribution of p-Cx43 and t-Cx43 proteins in the IVA, MET, and IVA + MET groups was somewhere between the distributions in the sham and MI groups.
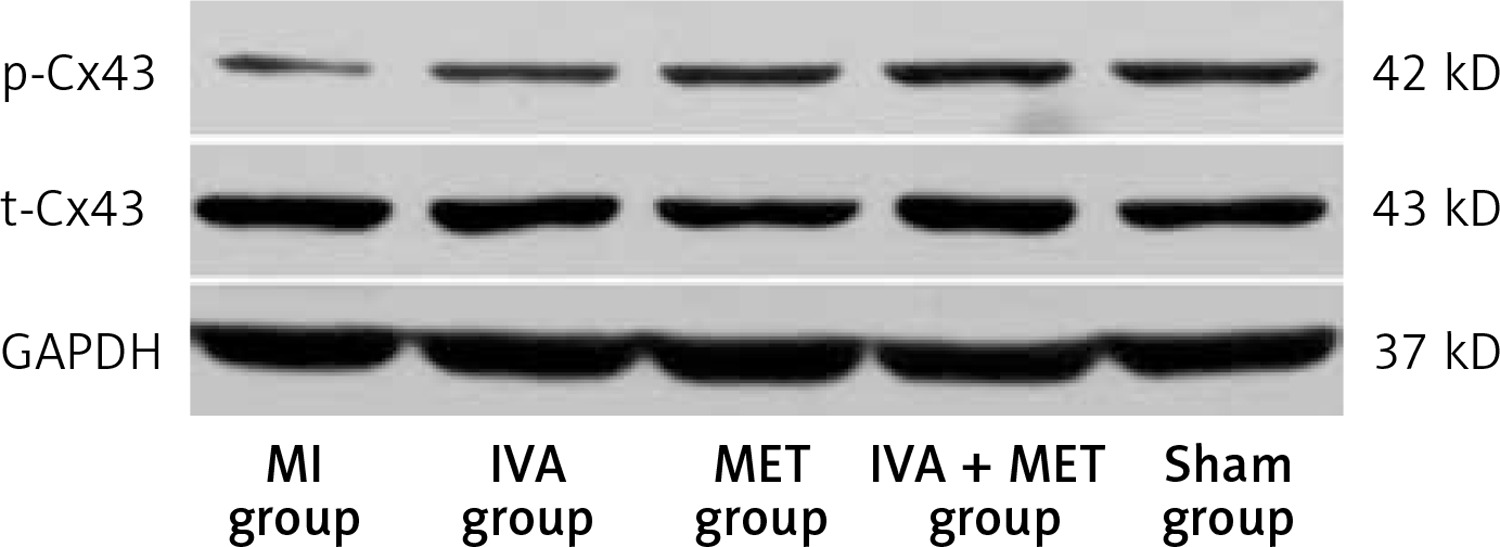
Protein expression of p-Cx43 and t-Cx43 in the left ventricle myocardium (Western blot: Table IV and Figure 6)
Compared with the sham group, p-Cx43 protein expression was lower in the MI group (p < 0.01); it was greater in the IVA, MET, and IVA + MET groups than in the MI group (p < 0.01). While there was no statistically significant difference in p-Cx43 protein expression between the IVA group and the MET group (p > 0.05), p-Cx43 protein expression was greater in the IVA + MET group than in the MET group (p < 0.05). However, there was no statistically significant difference in left ventricular anterior wall t-Cx43 expression between any two groups (p > 0.05).
Table IV
P-Cx43 and t-Cx43 protein expression in each group (x ± s)
| Variable | Number of rats | p-Cx43 | t-Cx43 |
|---|---|---|---|
| MI group | 11 | 0.17 ±0.02df | 0.70 ±0.03 |
| IVA group | 12 | 0.28 ±0.01de | 0.72 ±0.04 |
| MET group | 12 | 0.28 ±0.02de | 0.71 ±0.02 |
| IVA + MET group | 11 | 0.34 ±0.04cde | 0.70 ±0.03 |
| Sham group | 12 | 0.44 ±0.03ef | 0.71 ±0.03 |
| F value | 306.158 | 0.897 | |
| P-value | 0.000 | 0.473 |
Discussion
Myocardial infarction is myocardial necrosis caused by the interruption of coronary blood flow [13, 14]. Partial cardiomyocyte necrosis occurs due to severe and persistent ischemia [15]. Myocardial infarction results in high morbidity and mortality worldwide [16]. Only male rats were used in this study in order to control for the effects of gender. Although the current guidelines recommend an equal approach, a previous study found that in patients with non-ST-segment elevation myocardial infarction (NSTEMI), after age adjustment, mortality rates were similar in both genders [17]. Ventricular arrhythmia after myocardial infarction is one of the main causes of death in patients with myocardial infarction, especially in the pre-hospital stage, which poses a persistent problem [18]. Among the drugs for secondary prevention of coronary heart disease, angiotensin-converting enzyme inhibitors and statins have been confirmed to improve ventricular remodeling after MI, but have limited effects in the prevention and treatment of secondary ventricular arrhythmias. Furthermore, various studies have proven that β-blockers are beneficial in reducing the occurrence of ventricular arrhythmias after MI [19, 20], and improving the clinical prognosis during the repair period of MI. At present, based on the guidelines, β-blockers (such as metoprolol succinate) are recommended for the prevention and treatment of ventricular arrhythmias after MI [21]. The mechanism of β-blockers is to inhibit excessive sympathetic nervous system activity [19], reduce myocardial oxygen consumption, protect the myocardium [22], prevent triggered activity and re-entry induced by effective refractory period shortening, inhibit the downregulation of p-Cx43 in the MI area, improve the spatial redistribution of p-Cx43, and increase the threshold of ventricular fibrillation [11]. Cx43 is an important part of the gap junction channel, and p-Cx43 participates in the formation of the functional gap junction channel. Cx43 is the main protein responsible for ventricular electrical conduction. Changes in its protein expression level and spatial distribution, and in p-Cx43 state, can all lead to electrical remodeling, which is related to the occurrence of arrhythmia. The conformation of Cx43 in ventricular myocytes changes rapidly during myocardial infarction. Its expression is down-regulated and mainly distributed laterally, leading to the inactivation of gap junctions, blocking the transverse conduction velocity more than longitudinally and causing uncoupling of electrical impulses between cells, delay or blockage of action potential conduction, and formation of re-entrant loops, which plays an important role in the occurrence of ventricular arrhythmia. Previous studies have shown that p-Cx43 was down-regulated after myocardial infarction, and that the spatial distribution was abnormal, resulting in a decrease in the end-to-end distribution of cardiomyocytes and an increase in lateral distribution. The up-regulated expression of p-Cx43, and the increase of end-to-end distribution in cardiomyocytes, can reduce the occurrence of arrhythmia after myocardial infarction [23].
To date, the exact mechanism of ventricular arrhythmia after MI has not been fully elucidated. It is clearer that the structural and electrical remodeling of myocardial cells after MI induce instability in electrical and mechanical activity. This feature contributes to the occurrence of related ventricular arrhythmias after MI [24].
Neuro-humoral and mechanical changes after MI promote the transformation of mesenchymal cells into myofibroblasts and accelerate myocardial fibrosis [25]. In addition, the ischemic adaptive changes after MI induce myocardial cell hypertrophy, which causes the diffusion and conduction velocity of electrical impulses to decrease, and the ectopic pacing to perform as ventricular premature contraction [26]. Myocardial fibrosis and hypertrophy cause cardiomyocyte fibers to be disordered, which in turn alters cell anisotropy and cell-to-cell coupling [27], and this may lead to desynchronization between ventricular electrical conduction and mechanical activities. Studies have reported that IVA can improve myocardial remodeling, increase capillary density, enhance left ventricular systolic function, and retard myocardial remodeling after MI [7]. A 2017 clinical study showed that patients with acute ST-segment elevation myocardial infarction had a good tolerance to IVA, and IVA was as effective as metoprolol, which can reduce heart rate and reduce the risk of atrioventricular block [28]. In addition, there are several studies on the safety and efficacy of IVA in patients with AMI. However, since IVA has been mostly used in patients with acute heart failure, there were few data on the clinical or preclinical long-term survival time of IVA after MI. In the present study, after the MI model was established for 4 weeks, H&E and Masson’s staining revealed that in the sham group, the cardiomyocytes were neatly arranged, no infarctions were found, and no collagen fibers were deposited in interstitial cells. In the MI group, large infarctions had formed, and collagen fibers were obviously deposited in interstitial cells. Compared with the MI group, both infarction area and collagen fibrosis deposition were significantly reduced after drug intervention. Furthermore, while the infarction area and collagen fibrosis deposition were similar in the IVA group and the MET group, they were lower in the IVA + MET group than in the groups treated with either IVA or MET alone. Compared with the MI group, the heart rate in other groups after drug intervention was evidently slower. The effect on slowing the heart rate was similar in the MET and IVA groups, and, again, the combination of IVA and MET was found to be more effective. Pathohistological results further revealed that there was no significant difference between IVA and MET in improving myocardial structure remodeling and reducing the size of the infarction area after MI. The combination of IVA and MET was more effective than the use of MET alone, which is probably associated with the long-term slowing of the heart rate.
Researchers have recently studied the occurrence of ventricular arrhythmias in electrocardiograms after 24 h of AMI in rats, and found that the incidence of VT/VF after AMI was remarkably reduced in the IVA group [8]. Another important mechanism of ventricular arrhythmia after MI is electrical remodeling. Cx43 is the major gap junction protein responsible for ventricular electrical conduction. Cx43 protein expression levels, spatial distribution and p-Cx43 status changes can lead to electrical remodeling, and are associated with the occurrence of arrhythmia. When MI occurs, the conformation of Cx43 in ventricular cardiomyocytes rapidly changes, and this expression is downregulated. In addition, the structural remodeling of Cx43 is mainly characterized by cell surface lateralization along cell membranes. The above characteristics lead to the inactivation of gap connections, resulting in slow conduction. Longitudinal conduction was slowed to some extent, while transverse conduction was considerably slowed, causing a reduction in cell-to-cell coupling, and action potential conduction delay or block. The formation of a re-entrant circuit plays an important role in the occurrence of ventricular arrhythmia [29]. Pathologically, the Cx43 gap junction remodeling manifests as downregulated expression, protein dephosphorylation, and the lateral distribution of cardiomyocytes. The present study suggested that reversing the Cx43 remodeling can restore normal myocardial function and electrical stability. The immunohistochemical results in the present study confirm that t-Cx43 and p-Cx43 protein in the left ventricular anterior wall in the sham group were mostly distributed in the longitudinal connection of the myocardium. In the MI group, the distribution of t-Cx43 and p-Cx43 protein was disorganized, and the cardiomyocytes were mainly distributed in the lateral side. Furthermore, fewer cells were distributed in the longitudinal junction of the myocardium. The immunohistochemistry and Western blot results both confirm that the protein expression of p-Cx43 in the left ventricular anterior wall significantly decreased in the MI group; that is, the protein expression of p-Cx43 in the left ventricular anterior wall increased after drug intervention. While there was no significant difference between the sole use of IVA and the sole use of MET, a combination of IVA and MET increased the p-Cx43 protein level. In addition, the induction rate and fatality rate of VT/VF significantly increased in the MI group, and both decreased after drug intervention. Again, while there was no significant difference between the sole use of IVA and the sole use of MET, the combination of IVA and MET reduced the induction rate and fatality rate of VT/VF. In the present study, it was found that IVA mitigated the downregulation of myocardial p-Cx43 protein levels after MI, which can effectively reverse the imbalance of ischemia-mediated spatial distribution of Cx43 and reduce the occurrence of ventricular arrhythmia after MI in male rats.
The susceptibility to ventricular arrhythmia can be judged through the following indicators: QT interval, VERP and VERPd, and ventricular arrhythmia induction and fatality rates. (1) QT interval represents the depolarization and repolarization time of a ventricle, and its prolongation is directly correlated with the occurrence of ventricular arrhythmia. The QTc interval is the corrected QT interval according to the heart rate. In the MI group, the QT interval was significantly prolonged. After drug intervention, the QT interval was shortened, to the same extent when either IVA or MET was used alone, and to the most extreme extent when a combination of IVA and MET was used. The results for the QTc interval show the same pattern. (2) VERP reflects the excitability of ventricles. The shorter the VERP is, the more likely is the occurrence of re-entry. In the MI group, the VERP of the left ventricle was significantly shortened, and the risk of ventricular arrhythmia increased. The VERP was prolonged after drug intervention, with no significant difference observed between the IVA group and MET group, but a longer VERP was observed after the use of a combination of IVA and MET. (3) VERPd is a reflection of the heterogeneity of cardiomyocytes in the ventricles, mitral valve, and tricuspid valve. The greater the dispersion, the more obvious the electrophysiological heterogeneity of the ventricular cardiomyocytes. Ventricular arrhythmia can easily form and persist in this situation. In the MI group, the VERPd was significant. After drug intervention, the VERPd decreased; it was shortest after a combination of IVA and MET was used, which corresponded to the prior inference of the investigators. The present study indicates that after MI, both IVA and MET can not only reduce myocardial necrosis and fibrosis, but also alleviate the downregulation of p-Cx43 and improve its redistribution. Furthermore, the occurrence of VT/VF can be lessened by reducing the susceptibility to ventricular arrhythmia after MI. A combination of IVA and MET is more effective than the use of either one on its own. The outcomes of the present study provide a theoretical basis for the application of IVA in the prevention and treatment of ventricular arrhythmia after MI.
First, no macroscopic or echocardiographic assessment of ventricular remodeling was performed in male rats in this study, which can be improved by future studies. Second, due to the limited methodological possibilities, the quality of the connexin-43 positioning image (Figure 5) cannot be improved.