Introduction
Vitamin D is a unique hormone produced in the skin through exposure to ultraviolet (UV) irradiation of 7-dehydrocholesterol. Low vitamin D levels are characteristically seen as a result of the reduced cutaneous synthesis of 25-hydroxyvitamin D (25(OH)D) due to a lack of UV light [1]. The best-known effect of vitamin D status is on musculoskeletal health, but it also influences the cardiovascular system and all-cause mortality [2, 3].
Vitamin D deficiency and obesity are considered important public health problems. Some studies have demonstrated an inverse relationship between 25(OH)D levels and metabolic syndrome, obesity and insulin resistance in patients [4–8], while others showed no beneficial effect [9–13]. However, in these studies, various differences were observed in study design, population, duration, type and initial vitamin D levels. Therefore, further clinical studies are needed to resolve this issue.
Vitamin D supplementation in vitamin D deficient prediabetic individuals is related to lower progression to diabetes mellitus (DM) [14]. Recent studies have reported a relationship between vitamin D deficiency and the pathogenesis of dyslipidemia [15]. It is considered that vitamin D has direct effects on lipid levels by maintaining adequate levels of apolipoprotein AI, a major component of high-density lipoprotein cholesterol (HDL-C). Also, vitamin D could indirectly influence lipid metabolism through parathormone (PTH) or calcium balance [16, 17].
In this study, we aimed to investigate the impact of vitamin D3 supplementation on insulin resistance and dyslipidemia as prognostic risk factors for subclinical atherosclerosis in healthy overweight and obese premenopausal women.
Material and methods
Subjects
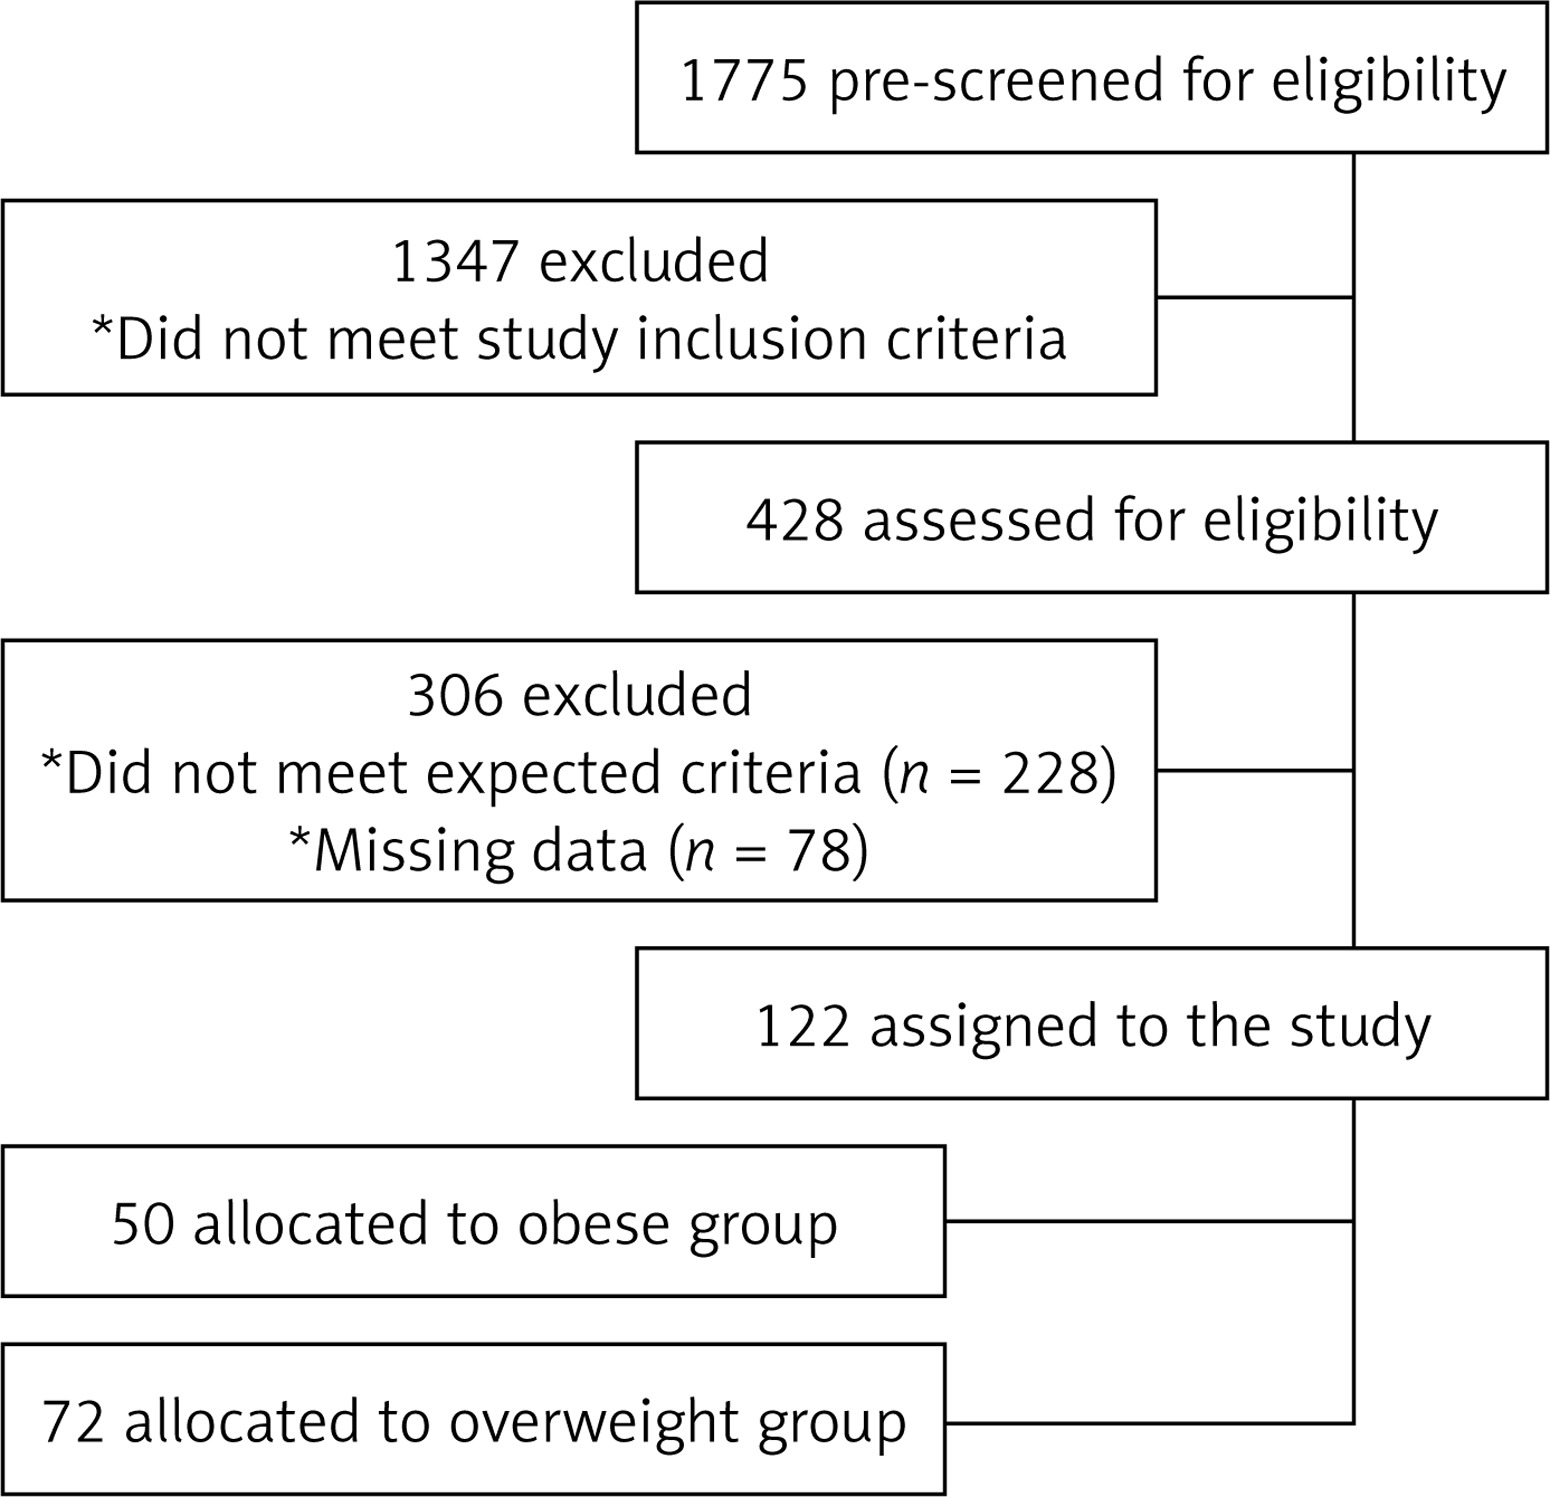
The medical records of patients admitted to Ankara Numune Education and Research Hospital, Endocrinology and Metabolism Department, between September 2015 and May 2016, were retrospectively evaluated. Records from 1,775 potential female subjects who received vitamin D3 supplementation were searched. 1,347 potential subjects were excluded from the study because of the following criteria: history of menopause, body mass index (BMI) < 25 kg/m2, atherosclerotic disease, stroke, chronic inflammatory disease, hepatic and renal impairment, DM, hypertension, dyslipidemia, current smoking, malignancy, malabsorption, using any drugs that affect 25(OH)D, antihypertensive drugs, statins and oral contraceptives or being involved in any diet or exercise program. A further 303 women were excluded because they did not meet the criterion of 25(OH)D level < 30 ng/ml after supplementation or because some laboratory data were missing. Consequently, 122 overweight (n = 72) and obese (n = 50) premenopausal women followed for vitamin D deficiency who reached the target level of 25(OH)D (≥ 30 ng/ml) after supplementation were selected (Figure 1).
A deficiency of vitamin D is defined as serum concentration of 25(OH)D below 20 ng/ml. Following supplementation, the cut-off level of adequate 25(OH)D was accepted above 30 ng/ml. Vitamin D supplementation was administered with 100,000 IU/week as a loading dose for 8 weeks following a maintenance dose of 3,000 IU/day according to the 2011 Guidelines of the Endocrine Society recommendations for obese and overweight subjects [18].
All parameters were evaluated at baseline and the sixth month of vitamin D supplementation for each subject. Physical examination measurements including height, weight, waist and hip circumference, and blood pressure were recorded. The BMI was calculated as weight (kg)/height2 (m2). Subjects were divided according to BMI as overweight (BMI: 25–29.9 kg/m2) and obese (BMI ≥ 30 kg/m2) groups [19]. The mean values of the three measurements of waist and hip circumferences and waist to hip ratio (WHR) were recorded. The local ethics committee of Ankara Numune Education and Research Hospital approved the study in accordance with the Declaration of Helsinki 2013.
Laboratory analyses
Serum-corrected calcium, phosphorus, 25(OH)D, intact parathormone (iPTH), fasting blood glucose (FBG), insulin and lipid profile including total cholesterol (TC, mg/dl), triglyceride (TG, mg/dl), HDL-C (mg/dl), and low-density lipoprotein cholesterol (LDL-C, mg/dl) levels were measured. Serum 25(OH)D concentration was measured using an electroluminescence method on the Cobas E-411 analyzer (Roche Diagnostics GmbH, Mannheim, Germany). The intraassay and interassay coefficients of variation (CV) were 3.2% and 7.8%, respectively. The minimum detection limit of the 25(OH)D kit was 3 ng/ml and the coefficient of variation was < 10%. Serum iPTH (normal range: 12–88 pg/ml) and insulin (normal range: 1.9–23 µIU/ml) levels were determined by chemiluminescent immunoassay (AU5800 autoanalyzer, Beckman Coulter Inc., Brea, CA, USA). Serum glucose (normal range: 70–100 mg/dl), TG (normal range: 10–200 mg/dl), TC (normal range: 20–200 mg/dl), and HDL-C (normal range: 40–60 mg/dl) concentrations were analyzed using the enzymatic method (AU5800 autoanalyzer, Beckman Coulter Inc., Brea, CA, USA). Serum albumin, calcium (normal range: 8.5–10.5 mg/dl), and phosphorus (normal range: 2.5–4.5 mg/dl) levels were measured by the photometric method (AU5800 autoanalyzer, Beckman Coulter Inc., Brea, CA, USA). Serum LDL-C concentration was calculated using the Friedewald formula [20]. Serum total calcium was corrected for serum albumin with the formula: [(4-albumin) × 0.8] total serum calcium. All calcium levels were corrected, and the term ‘calcium’ was used instead of ‘corrected calcium’. The homeostasis model assessment of insulin resistance (HOMA-IR) was calculated by the formula HOMA-IR = (FBG × insulin)/405 [21]. In all study populations, all test parameters were recorded at baseline and the sixth month of supplementation.
Statistical analysis
Statistical analysis was performed using the Statistical Package for Social Sciences for Windows 20 (IBM SPSS Inc., Chicago, IL) program. The Kolmogorov-Smirnov test assessed the normal distribution of the data. Descriptive statistics are presented as the mean ± standard deviation for normal distribution, and median (min.–max.) for non-normal distribution. Categorical variables were expressed as number and percentage. Normally distributed parameters were evaluated by the t-test, while non-normally distributed parameters were investigated by the Mann-Whitney U test. In the overweight and obese subjects, changes in anthropometric and laboratory findings after vitamin D supplementation were evaluated by the repeated measures ANOVA test. The data of parameters at baseline and after 6 months of supplementation were evaluated by the paired t-test. Analysis of the percent relative change in all parameters between groups to demonstrate the effect of treatment was performed by ANOVA. The percent relative change was computed for each parameter with the following formula: (sixth-month measurement – baseline measurement)/baseline measurement × 100. The magnitude of absolute change from baseline to after vitamin D supplementation values was indicated by Δ. To establish the relationships between changes in parameters following vitamin D supplementation, the correlations of change in HOMA-IR level with changes in anthropometric and laboratory findings were analyzed by Spearman correlation analysis. The repeated measures design with generalized linear mixed models was used to detect ∆25(OH)D levels for predicting ∆HOMA-IR levels. A p-value of p ≤ 0.05 was considered statistically significant.
Results
Baseline demographic, anthropometric and laboratory characteristics of the groups are shown in Table I. The study population of 122 Caucasian women consisted of 72 (59.0%) overweight and 50 (41.0%) obese vitamin-D-deficient premenopausal subjects (Table I). Baseline mean 25-hydroxyvitamin D (25(OH)D) level was 6.1 (min.–max. = 2.9–15.8) ng/ml in overweight and was 5.6 (min.–max. = 3.0–22.0) ng/ml in obese subjects. Of all subjects, the mean age was 43.1 ±10.4 years; the mean BMI was 30.8 ±4.6 kg/m2. Between obese and overweight subjects, age, WHR, SBP, DBP measurements, serum 25(OH)D, PTH and lipid levels did not differ (p > 0.05). In overweight subjects, baseline FBG, insulin, and HOMA-IR levels were significantly lower than in obese subjects (91.8 ±5.7 vs. 96.5 ±7.6; p < 0.001; 12.9 vs. 16.4, p = 0.001; 3.6 vs. 4.2, p < 0.001; respectively).
Table I
Baseline demographic, anthropometric and laboratory characteristics of all cases of overweight and obese patients
| Variables | All patients (n = 122) | Overweight (n = 72) | Obese (n = 50) | P-value# |
|---|---|---|---|---|
| Age [years] | 43.1 ±10.4 | 42.5 ±10.8 | 43.9 ±10.1 | 0.460 |
| BMI [kg/m2] | 30.8 ±4.6 | 27.5 ±1.2 | 35.5 ±3.7 | < 0.001* |
| WHR [cm] | 0.7 ±0.1 | 0.7 ±0.1 | 0.8 ±0.1 | 0.078 |
| SBP [mm Hg] | 122.7 ±10.1 | 122.3 ±10.8 | 123.3 ±8.9 | 0.576 |
| DBP [mm Hg] | 74.5 ±6.2 | 73.6 ±6.2 | 75.8 ±6.1 | 0.058 |
| TC [mg/dl] | 215.0 ±44.9 | 215.1 ±45.3 | 214.9 ±45.0 | 0.978 |
| LDL-C [mg/dl] | 135.2 ±38.1 | 137.1 ±37.5 | 132.4 ±39.2 | 0.509 |
| HDL-C [mg/dl] | 53.7 ±12.4 | 54.3 ±12.6 | 52.9 ±12.2 | 0.566 |
| TG [mg/dl] | 142.5 (78.0–454.0) | 140.0 (78.0–454.0) | 149.0 (83.0–440.0) | 0.829 |
| FBG [mg/dl] | 93.7 ±6.9 | 91.8 ±5.7 | 96.5 ±7.6 | < 0.001* |
| Calcium [mg/dl] | 9.2 ±0.43 | 9.1 ±0.5 | 9.2 ±0.4 | 0.336 |
| Phosphorus [mg/dl] | 3.4 ±0.5 | 3.5 ±0.5 | 3.3 ±0.5 | 0.014* |
| 25(OH)D [ng/ml] | 6.0 (2.9–22.0) | 6.1 (2.9–15.8) | 5.6 (3.0–22.0) | 0.901 |
| iPTH [pg/ml] | 75.5 (31.6–174.7) | 75.5 (38.3–169.0) | 75.3 (31.6–174.7) | 0.886 |
| Insulin [µIU/ml] | 14.0 (4.2–45.6) | 12.9 (4.2–33.0) | 16.5 (7.9–45.6) | 0.001* |
| HOMA-IR | 3.7 (1.0–10.8) | 3.6 (1.0–6.7) | 4.2 (2.8–10.8) | < 0.001* |
* p ≤ 0.05 indicates statistical significance. Numerical variables with normal distribution are expressed as mean ± standard deviation. Numerical variables without normal distribution are shown as median (min.–max.). BMI – body mass index, WHR – waist-hip ratio, SBP – systolic blood pressure, DBP – diastolic blood pressure, TC – total cholesterol, LDL-C – low-density lipoprotein cholesterol, HDL-C – high-density lipoprotein cholesterol, TG – triglyceride, FBG – fasting blood glucose, 25(OH)D – 25-hydroxy vitamin D, iPTH – intact parathormone, HOMA-IR – homeostasis model assessment of insulin resistance.
In both groups, the effects of vitamin D supplementation on anthropometric and laboratory findings are shown in Table II. After supplementation, the laboratory parameters of overweight and obese subjects were as follows. Following vitamin D3 supplementation in overweight and obese subjects, serum 25(OH)D increased from 6.1 to 34.7 ng/ml and 5.6 to 34.7 ng/ml, respectively (p < 0.001). In both groups, mean LDL-C level decreased (p = 0.046, p = 0.044; respectively). In overweight subjects, TG level decreased after supplementation (p < 0.001), while no significant difference was observed in obese subjects (p > 0.05). In both subject groups mean FBG levels decreased and mean calcium levels increased (p < 0.001; for both). After supplementation, mean phosphorus level decreased (p = 0.011) in overweight subjects, while no difference was detected in obese subjects (p > 0.05). The relative changes of all parameters before and after supplementation compared between overweight and obese groups are shown in Table III. The effect of supplementation on percent change in all parameters is shown in Table II. Analysis between the groups shows that the percent change of HOMA-IR levels differed significantly between overweight and obese groups (p = 0.035).
Table II
Effects of vitamin D supplementation on anthropometric and laboratory parameters in overweight and obese subjects
| Variable | Overweight (n = 72) | Obese (n = 50) | ||||
|---|---|---|---|---|---|---|
| Baseline | After supplementation | P-value | Baseline | After supplementation | P-value | |
| BMI [kg/m2] | 27.5 ±1.2 | 27.5 ±1.3 | 0.340 | 35.5 ±3.7 | 35.5 ±3.8 | 0.532 |
| WHR [cm] | 0.8 ±0.1 | 0.8 ±0.1 | 0.057 | 0.8 ±0.1 | 0.8 ±0.1 | 0.058 |
| SBP [mm Hg] | 122.3 ±10.8 | 122.0 ±10.7 | 0.681 | 123.3 ±8.9 | 122.7 ±10.3 | 0.277 |
| DBP [mm Hg] | 73.6 ±6.2 | 74.0 ±6.7 | 0.131 | 75.8 ±6.1 | 75.6 ±7.0 | 0.389 |
| TC [mg/dl] | 215.1 ±45.3 | 204.3 ±40.7 | 0.056 | 214.9 ±45.0 | 207.4 ±41.7 | 0.257 |
| LDL-C [mg/dl] | 137.1 ±37.5 | 128.4 ±36.0 | 0.046* | 132.4 ±39.2 | 121.0 ±32.9 | 0.044* |
| HDL-C [mg/dl] | 54.3 ±12.6 | 53.6 ±14.2 | 0.631 | 53.0 ±12.2 | 52.3 ±11.2 | 0.550 |
| TG [mg/dl] | 140.0 (78.0–454.0) | 123.5 (38.0–283.0) | < 0.001* | 149.0 (83.0–440.0) | 139.5 (45.0–320.0) | 0.142 |
| FBG [mg/dl] | 91.8 ±5.7 | 87.1 ±6.5 | < 0.001* | 96.5 ±7.6 | 92.2 ±5.5 | < 0.001* |
| Calcium [mg/dl] | 9.1 ±0.5 | 9.4 ±0.4 | < 0.001* | 9.2 ±0.4 | 9.5 ±0.3 | < 0.001* |
| Phosphorus [mg/dl] | 3.5 ±0.5 | 3.4 ±0.4 | 0.011* | 3.3 ±0.5 | 3.3 ±0.5 | 0.933 |
| 25(OH)D [ng/ml] | 6.1 (2.9–15.8) | 34.7 (26.4–70.3) | < 0.001* | 5.6 (3.0–22.0) | 34.7 (26.8–56.8) | < 0.001* |
| iPTH [pg/ml] | 75.6 (38.3–169.0) | 41.2 (19.4–85.3) | < 0.001* | 75.3 (31.6–174.7) | 46.4 (28.9–96.0) | < 0.001* |
| Insulin [µIU/ml] | 12.9 (4.2–33.0) | 3.7 (2.0–5.8) | < 0.001* | 16.5 (8.0–45.6) | 8.6 (4.1–37.2) | < 0.001* |
| HOMA-IR | 3.6 (1.0–6.7) | 2.0 (0.7–3.2) | < 0.001* | 4.2 (2.8–10.8) | 2.4 (1.2–7.0) | < 0.001* |
Numerical variables with normal distribution are expressed as mean ± standard deviation. Numerical variables without normal distribution are shown as median (min.–max.).
∆ p: Overweightbaseline-after supplementation vs. obesebaseline-after supplementation. BMI – body mass index, WHR – waist-hip ratio, SBP – systolic blood pressure, DBP – diastolic blood pressure, TC – total cholesterol, LDL-C – low-density lipoprotein cholesterol, HDL-C – high-density lipoprotein cholesterol, TG – triglyceride, FBG – fasting blood glucose, 25(OH)D – 25-hydroxy vitamin D, iPTH – intact parathormone, HOMA-IR – homeostasis model assessment of insulin resistance.
Table III
Relative changes in variables over the course of vitamin D supplementation
| Variable | Overweight (n = 72) (% change) | Obese (n = 50) (% change) | P-value# Comparison of relative change between groups |
|---|---|---|---|
| BMI [kg/m2] | –2.2 ±4.0 | –1.2 ±2.5 | 0.263 |
| WHR [cm] | –0.5 ±1.8 | 0.5 ±1.9 | 0.139 |
| SBP [mm Hg] | –0.2 ±4.3 | –0.5 ±3.2 | 0.675 |
| DBP [mm Hg] | 0.2 ±2.7 | –0.4 ±2.6 | 0.205 |
| TC [mg/dl] | –4.0 ±18.6 | –2.9 ±15.2 | 0.823 |
| LDL-C [mg/dl] | –3.8 ±24.2 | –5.8 ±21.4 | 0.753 |
| HDL-C [mg/dl] | 2.2 ±22.2 | 0.8 ±16.5 | 0.787 |
| TG [mg/dl] | –16.1 ±44.9 | –3.4 ±29.9 | 0.226 |
| FBG [mg/dl] | –3.6 ±8.7 | –1.6 ±6.8 | 0.254 |
| Calcium [mg/dl] | 2.2 ±4.8 | 2.4 ±6.0 | 0.877 |
| Phosphorus [mg/dl] | –2.8 ±15.5 | 3.0 ±15.1 | 0.131 |
| 25(OH)D [ng/ml] | 565.1 ±327.0 | 552.8 ±327.9 | 0.840 |
| iPTH [pg/ml] | –38.3 ±23.1 | –38.2 ±22.2 | 0.986 |
| Insulin [µIU/ml] | –54.8 ±18.3 | –47.2 ±19.0 | 0.087 |
| HOMA-IR | –56.4 ±17.0 | –46.8 ±19.2 | 0.035* |
BMI – body mass index, WHR – waist-hip ratio, SBP – systolic blood pressure, DBP – diastolic blood pressure, TC – total cholesterol, LDL-C – low-density lipoprotein cholesterol, HDL-C – high-density lipoprotein cholesterol, TG – triglyceride, FBG – fasting blood glucose, 25(OH)D – 25-hydroxy vitamin D, iPTH – intact parathormone, HOMA-IR – homeostasis model assessment of insulin resistance.
After supplementation, iPTH, insulin, and HOMA-IR levels decreased in both overweight and obese subjects (p < 0.001). Changes in all parameters from baseline to post-supplementation levels were compared (∆p). Changes in TG and phosphorus levels were larger in overweight subjects (p = 0.048, p = 0.035; respectively). However, the change in HOMA-IR level was larger only in obese subjects (p = 0.004).
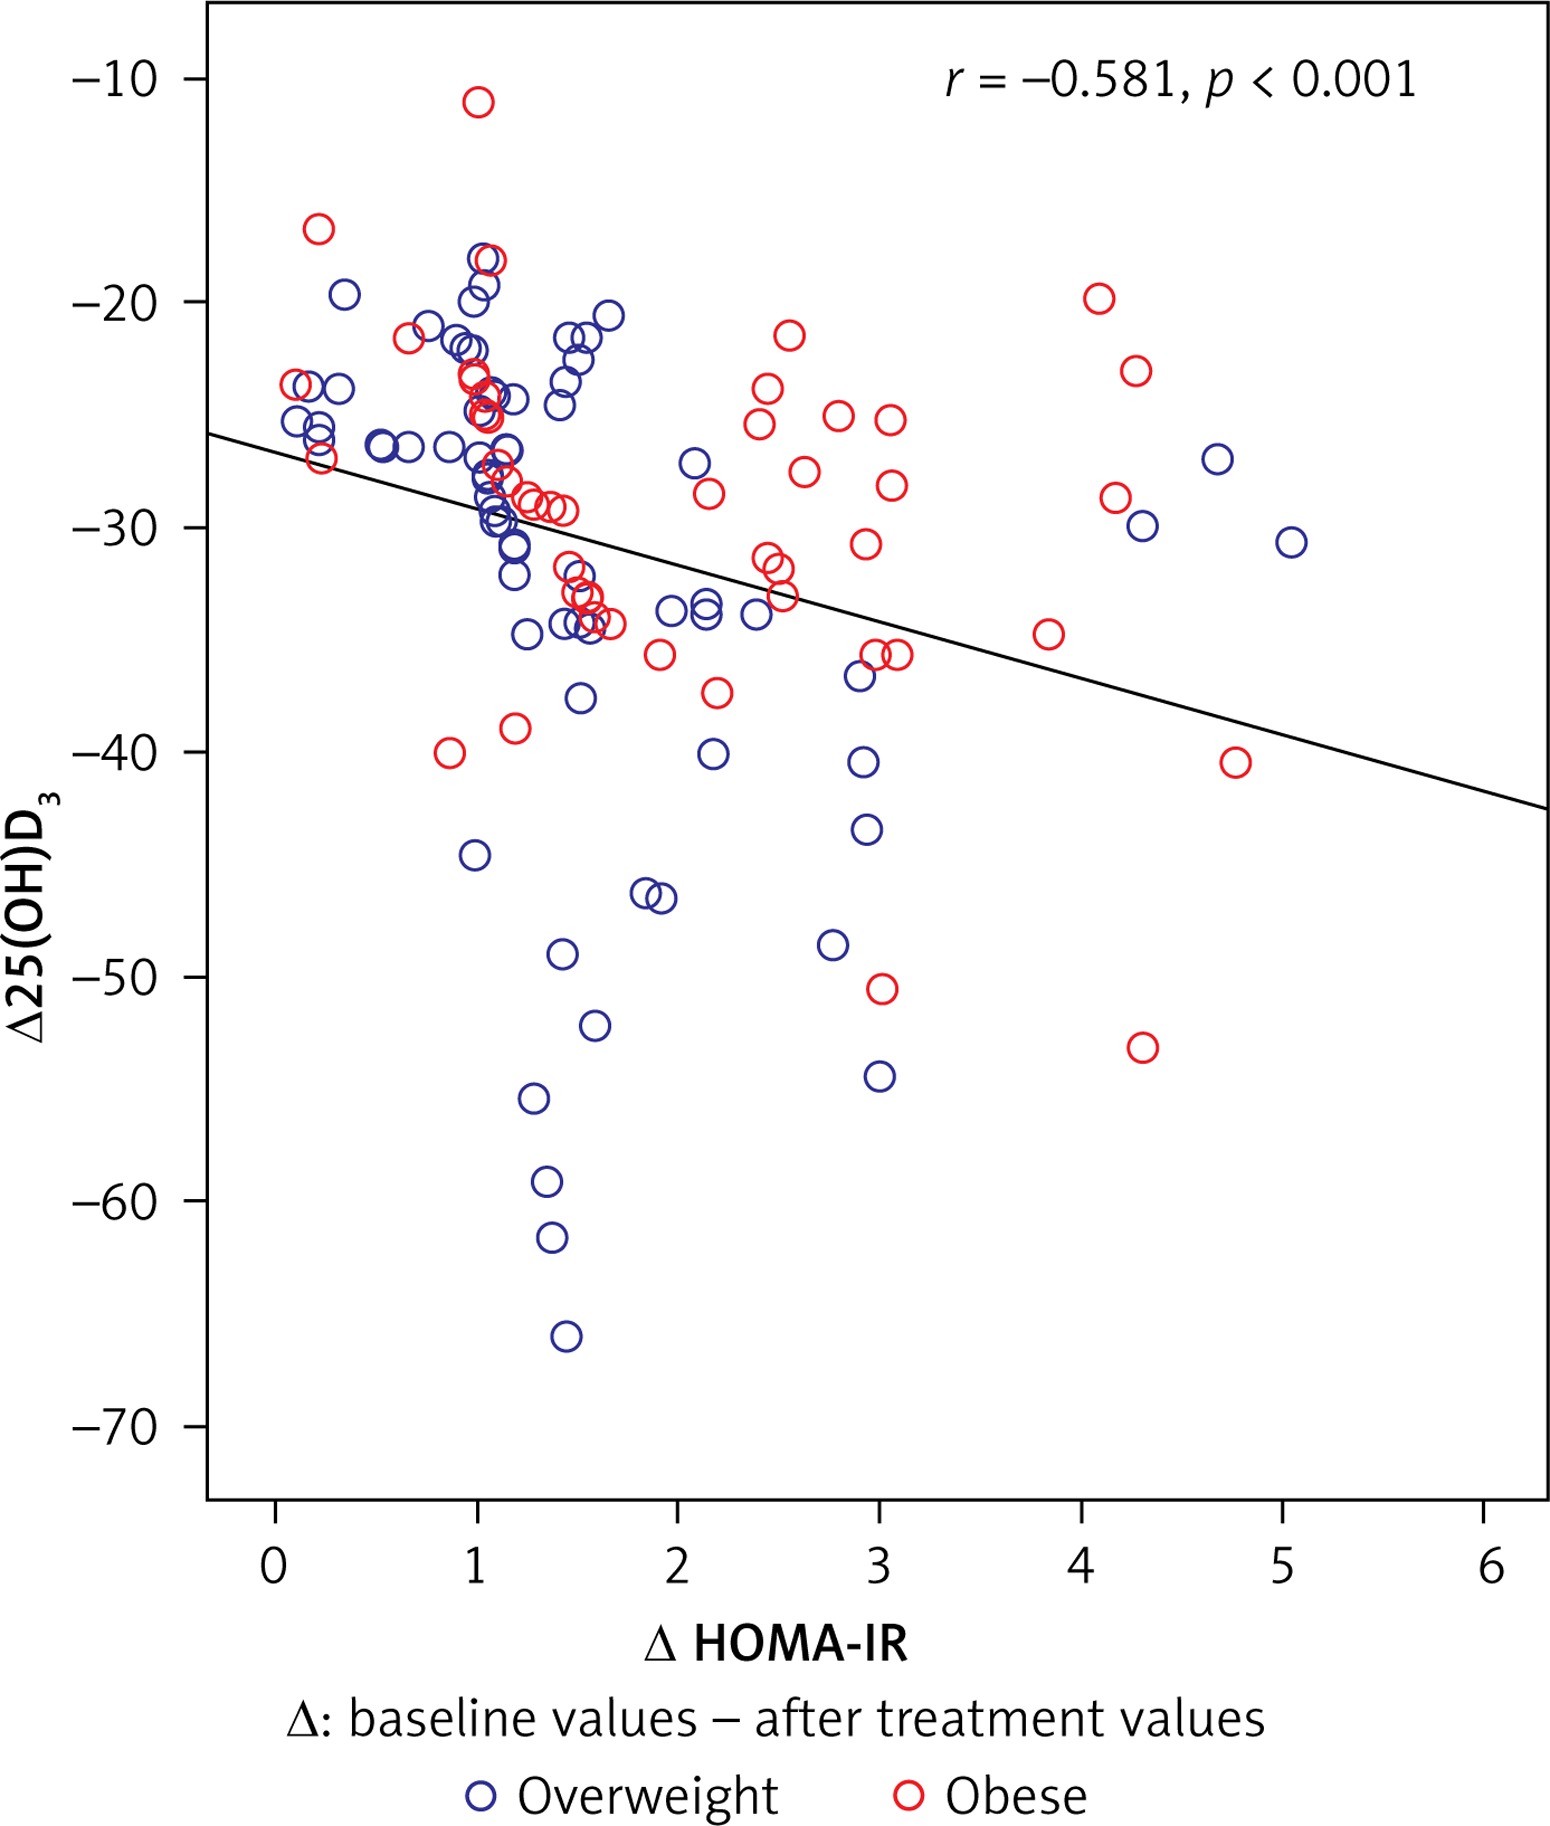
The correlation of changes in 25(OH)D and HOMA-IR levels with changes in anthropometric and laboratory findings after supplementation are shown in Table IV. In overweight subjects, change in 25(OH)D level was negatively correlated with change in HOMA-IR (r = –0.581, p < 0.001), FBG (r = –0.400, p = 0.001), and insulin (r = –0.552, p < 0.001) levels, while change in HOMA-IR level was positively correlated with change in insulin (r = 0.296; p = 0.012) level. In obese subjects, change in 25(OH)D level was negatively correlated with change in HOMA-IR (r = –0.389, p = 0.005), FBG (r = –0.362, p = 0.01), iPTH (r = –0.291, p = 0.040), and insulin (r = –0.584; p < 0.001) levels; change in HOMA-IR level was positively correlated with the change in FBG (r = 0.428; p = 0.002) and insulin (r = 0.330; p = 0.019) levels. The correlation of change in 25(OH)D and HOMA-IR levels in overweight and obese subjects is shown in Figure 2. A negative adjusted correlation was detected between Δ25(OH)D and ∆HOMA-IR levels in both overweight and obese subjects. Change in 25(OH)Dlevel is a predictor of change in HOMA-IR level. We found that a 1 ng/ml increase in serum 25(OH)D level caused a 0.30-fold reduction in HOMA-IR level (β ± SE = –0.30 ±0.10; p = 0.002).
Table IV
Correlation of change in 25(OH)D and HOMA-IR levels with the change in anthropometric and laboratory parameters in overweight and obese subjects
| Variables | Overweight | Obese | ||||||
|---|---|---|---|---|---|---|---|---|
| ∆25(OH)D | ∆HOMA-IR | ∆25(OH)D | ∆HOMA-IR | |||||
| r | p | r | p | r | p | r | p | |
| ∆25(OH)D | – | – | –0.581 | < 0.001* | – | – | –0.389 | 0.005* |
| ∆HOMA-IR | –0.581 | < 0.001* | – | – | –0.389 | 0.005* | – | – |
| ∆BMI | 0.078 | 0.516 | 0.096 | 0.424 | –0.214 | 0.106 | 0.078 | 0.591 |
| ∆WHR | –0.044 | 0.715 | 0.135 | 0.258 | –0.157 | 0.275 | 0.038 | 0.796 |
| ∆SBP | 0.194 | 0.102 | –0.102 | 0.394 | 0.171 | 0.234 | –0.207 | 0.148 |
| ∆DBP | 0.087 | 0.467 | –0.178 | 0.136 | 0.140 | 0.333 | –0.052 | 0.722 |
| ∆TC | –0.001 | 0.990 | –0.034 | 0.778 | –0.067 | 0.644 | 0.012 | 0.936 |
| ∆HDL-C | –0.039 | 0.742 | 0.022 | 0.855 | 0.233 | 0.103 | 0.024 | 0.867 |
| ∆LDL-C | 0.036 | 0.763 | –0.063 | 0.597 | 0.027 | 0.854 | 0.047 | 0.748 |
| ∆TG | 0.159 | 0.183 | –0.157 | 0.187 | –0.098 | 0.499 | –0.100 | 0.490 |
| ∆FBG | –0.400 | 0.001* | 0.180 | 0.129 | –0.362 | 0.010* | 0.428 | 0.002* |
| ∆Calcium | –0.168 | 0.157 | 0.129 | 0.278 | –0.172 | 0.233 | 0.119 | 0.412 |
| ∆Phosphorus | 0.065 | 0.588 | 0.001 | 0.991 | 0.170 | 0.239 | 0.176 | 0.221 |
| ∆iPTH | –0.024 | 0.843 | 0.034 | 0.777 | –0.291 | 0.040* | 0.130 | 0.369 |
| ∆Insulin | –0.552 | < 0.001* | 0.296 | 0.012* | –0.584 | < 0.001* | 0.330 | 0.019* |
* p ≤ 0.05 indicates statistical significance. ∆ – baseline values – post-supplementation values. 25(OH)D – 25-hydroxy vitamin D, BMI – body mass index, WHR – waist-hip ratio, SBP – systolic blood pressure, DBP – diastolic blood pressure, TC – total cholesterol, HDL-C – high-density lipoprotein cholesterol, LDL-C – low-density lipoprotein cholesterol, TG – triglyceride, FBG – fasting blood glucose, iPTH – intact parathormone, HOMA-IR – homeostasis model assessment of insulin resistance.
Discussion
Vitamin D deficiency and obesity are nutritional disorders that affect people worldwide. Several studies have demonstrated that supplementation of vitamin D has various effects on obesity, hypertension, DM, insulin sensitivity, lipid parameters, inflammatory markers and atherosclerosis risk. It is well recognized that the overweight population has a high prevalence of cardiovascular disease (CVD) risk factors such as hypertension, type 2 DM, hyperlipidemia, and atherosclerosis, similar to obese subjects. In rats and humans, adipose tissue has been found to be the main storage site of vitamin D [22, 23]. The mechanism is not clear, but it is suggested that obesity can cause vitamin D deficiency through inadequate intake or as a result of deposition of vitamin D in the large adipose tissue mass [24]. Additionally, obese people spend less time outside and are exposed to less UV radiation [25].
Vitamin D has effects on pancreatic islet cells through the vitamin D receptor (VDR), and polymorphisms of the VDR gene are related to insulin resistance and impaired insulin secretion [26]. Pancreatic β-cells have receptors for the active form of vitamin D, and the local production of 1α, 25(OH)2D3 might be an essential mediator of islet function [27]. Some studies have demonstrated a negative correlation between serum vitamin D levels and insulin resistance. A prospective study revealed an inverse relationship between baseline serum 25(OH)D and 10-year risk of hyperglycemia, metabolic syndrome, and insulin resistance [28]. Increasing 25(OH)D from 10 to 30 ng/ml can improve insulin sensitivity by 60% [29]. It is thought that vitamin D supplementation may be a cost-effective preventative and therapeutic agent for the management of insulin resistance and DM in obese individuals [30]. The present study demonstrated vitamin D-deficient overweight and obese subjects had higher HOMA-IR levels at baseline, whereas at the sixth month of supplementation it had declined. In addition, we observed a 1 ng/ml increase in serum 25(OH)D level that led to a 0.30-fold reduction in HOMA-IR level. This result is important because it emphasizes that vitamin D deficiency should be corrected to prevent diseases caused by high insulin resistance. In our study, the obese group had higher insulin resistance than the overweight group; therefore, supplementation with vitamin D may be more beneficial for people with higher insulin resistance.
Vitamin D status is related to increased levels of endothelial dysfunction biomarkers, inflammatory markers and cardiometabolic risk factors in obese non-diabetic individuals [31]. The excess of macronutrients in the adipose tissues stimulates the release of inflammatory mediators and reduces production of adiponectin, predisposing to a pro-inflammatory state and oxidative stress. Management of obesity can help reduce the risks of CVD and inhibits release of inflammatory mediators [32]. However, a recent meta-analysis indicated that vitamin D supplementation had no effect on plasma leptin and adiponectin levels [33]. Telomeres protect chromosomes from deterioration and fusion during mitosis. Higher vitamin D levels and longer telomere length have been associated with lower risk of several chronic diseases and all-cause mortality. A positive association was established between 25(OH)D levels and telomere length [34].
Some studies indicate that low 25(OH)D levels may lead to dyslipidemia. In the present study, vitamin D deficient women had higher LDL-C concentrations. After vitamin D supplementation, we observed LDL-C reduction in both overweight and obese subjects and TG reduction only in overweight subjects. Despite these reductions, no significant difference was found in TC and HDL-C levels. The mechanisms responsible for dyslipidemia in vitamin D deficient individuals are not fully understood. A positive relationship between serum 25(OH)D level and apolipoprotein AI with HDL-C levels is well known. Vitamin D can influence the formation of HDL-C particles [35]. Also, vitamin D status may affect the serum lipid levels by the effect of 1,25(OH)2D3, which leads to inhibition of murine bone marrow stromal cell differentiation and regulates adipogenesis; it also leads to increased lipogenesis and lipolysis [36]. Consistent with our results, an investigation of the effects of 25-hydroxyvitamin D on fasting lipid profile resulted in a negative correlation of 25(OH)D concentration with both total cholesterol and LDL-C [29].
The relationship between vitamin D deficiency and CVD has been investigated in many studies. Active metabolites of vitamin D bind to the VDR, which regulates many genes in essential processes and has a role in pathways of CVD, including inflammation, thrombosis, and the renin-angiotensin system [37]. Women with vitamin D deficiency had increased CVD risk biomarkers such as homocysteine, high-sensitivity C-reactive protein (CRP), cystatin-C, uric acid, and HbA1c levels compared to those with sufficient vitamin D levels [38]. Investigation of the possible role of vitamin D deficiency in statin-associated myalgia shows that low 25(OH)D levels are related to myalgia in patients on statin therapy [39]. In addition, peripheral artery disease patients had significantly higher serum concentrations of trans fatty acids and lower plasma levels of vitamin D [40]. Vitamin D induces prostacyclin in vascular smooth muscle cells; possibly, it is a vasoactive agent and may play a protective role in the development of atherosclerosis [41]. Gurses et al. reported that endothelial function is impaired in vitamin D deficient young premenopausal women; 6-month supplementation resulted in amelioration [42].
Non-alcoholic fatty liver disease (NAFLD) is the most common chronic liver disease worldwide, frequently co-existing with obesity, and has been recognized as an independent risk factor for CVD. Evidence from an increasing number of studies suggests that NAFLD may be a hepatic manifestation of metabolic syndrome [43]. Lifestyle changes and statin treatment have beneficial effects on NAFLD [44]. As a result of the correlation between hyperandrogenemia and NAFLD, bioavailable testosterone is independently associated with the fatty liver index in postmenopausal women [45]. Comparing the effect of orlistat versus metformin on body composition and insulin resistance in obese premenopausal women, it was found that orlistat and metformin produced similar improvement in insulin and glucose homeostasis [46]. Vitamin D deficiency is also associated with NAFLD and has even been correlated with the severity of the disease [47]. Vitamin D supplementation has a therapeutic role in vitamin D deficient adults with NAFLD [48]. Also, low 25(OH)D levels are associated with advanced fibrosis and severe inflammation in autoimmune hepatitis. Vitamin D level was suggested as a biomarker that predicts response to therapy and histological features in autoimmune hepatitis [49]. In our study, both overweight and obese groups, after 6-month vitamin D supplementation, had a decline in iPTH concentrations and elevation in calcium levels. Studies showed that patients with secondary hyperparathyroidism have excess body weight and fat tissue [50]. It is suggested that PTH may cause insulin resistance by reducing glucose uptake by the liver, muscle, and adipose cells [51]. A recent study revealed that vitamin D supplementation has no effect on CRP, interleukin-10, or tumor necrosis factor-α concentrations [52].
The 25(OH)D measurement before and after supplementation may not be a mirror of lifetime vitamin D status and progression of subclinical atherosclerosis over several years. In our opinion, these results may be a partial reflection of the situation of vitamin D deficiency results. The results suggest that vitamin D supplementation may be protective for possible dyslipidemia and insulin resistance, especially in patients above the normal weight.
Our study has several limitations. First, we analyzed baseline and 6-month measurements of parameters; frequent and longitudinal series of measurements may be more effective to evaluate the results. Second, this study was not a randomized placebo-controlled study. Third, we investigated the parameters in overweight and obese premenopausal women; in heterogeneous groups such as postmenopausal women and the male population, the results might have been different. Sun exposure and dietary daily vitamin D intake were not assessed, because this information was not available. In addition, we used the HOMA-IR index for the assessment of insulin resistance, but the lipid accumulation product and/or the triglyceride/glucose index can be applied as predictors of insulin resistance in clinical practice [53].
In conclusion, in healthy vitamin D deficient overweight and obese premenopausal women, 25(OH)D levels negatively correlated with HOMA-IR and LDL-C after vitamin D supplementation. These results may help highlight the importance of vitamin D supplementation to improve insulin secretion and insulin sensitivity, thereby indirectly influencing lipid metabolism and eventually prevention of atherosclerosis and cardiovascular mortality. Further studies are needed to confirm the effects of supplementation with vitamin D in healthy premenopausal overweight and obese women for insulin resistance and dyslipidemia.