Introduction
The prevalence of type 2 diabetes mellitus (T2D) is increasing worldwide, as are the morbidity and mortality due to its complications [1]. This is mostly related to the modern lifestyle that includes changes in the eating habits, overnutrition, as well as physical inactivity [2].
Hyperglycemia leads to excessive generation of reactive oxygen species (ROS), and when the antioxidant defense capacity is exceeded, it causes a redox imbalance which could lead to formation of a toxic and damaging milieu. ROS trigger several molecular mechanisms, such as activating pro-inflammatory signaling pathways, increasing secretion of proinflammatory cytokines and further leading to chronic systemic inflammation, activating apoptosis and tissue damage [1].
Therefore, it may be regarded that hyperglycemia-induced oxidative stress (OS) and chronic inflammation play an important role in the development of insulin resistance (IR) and overt T2D [2, 3]. Not only does IR per se double the risk of cardiovascular disease (CVD), it is also related to higher rates of coronary artery disease, peripheral arterial disease and cerebrovascular disease [2].
Dyslipidemia secondary to IR is a typical finding in T2D [4, 5]. It is caused by increased flux of free fatty acids and proinflammatory cytokines and adipokines secreted from visceral adipose tissue depots [2]. Apart from stimulating functional and structural changes in lipoproteins and protein molecules, these cytokines induce abnormalities of endothelial cells, and consequently atherosclerosis [6].
It is estimated that CVD are the main cause of death in about 80% of subjects with T2D [2]. Considering the fact that T2D is an independent risk factor for CVD, and since T2D and CVD share common underlying pathophysiological mechanisms, it is of great importance to explore some novel biomarkers that can help elucidate the complex pathological alterations of these disorders [3].
In line with this, endocan is emerging as a novel biomarker of endothelial dysfunction [7, 8] that is found to be increased in CVD and T2D. Its ability to stimulate endothelial cells to secrete a variety of proinflammatory cytokines, promote migration of leukocytes, and increase blood vessel permeability makes this proteoglycan a promising biomarker for recognizing increased atherosclerotic disease risk burden [9].
Although several previous studies have shown higher endocan levels in T2D [8, 10, 11], some others showed the opposite, i.e. lower endocan levels in T2D than in controls [12]. Therefore, the pathophysiological role of this biomarker is not completely elucidated in different stages of diabetes, such as prediabetes and overt T2D.
Moreover, since dyslipidemia, OS and chronic inflammation are underlying features of T2D [5, 13, 14], we aimed to examine serum endocan level and the summary involvement of dyslipidemia, oxidative stress (OS) and inflammation by calculation of its comprehensive score (i.e. Dyslipidemia-Oxy-Inflammation (DOI) score) in relation to glucoregulation in patients with prediabetes and T2D.
Material and methods
Subjects
The current case-control study encompassed a total of 59 patients with prediabetes and 102 with T2D, who were compared with 117 controls. The participants were consecutively recruited when visiting the Primary Health Care Center in Podgorica, Montenegro, for metabolic evaluation by performing laboratory analyses in a period from May 2017 to July 2017.
Each participant filled in a questionnaire consisting of questions regarding demographic characteristics, lifestyle habits (e.g., data about duration of T2D (years), alcohol consumption, cigarette smoking) and somatic illnesses.
The inclusion criteria for participants with prediabetes and T2D were taken from the 2017 American Diabetes Association Standards of Diabetes Care [15]. Participants were considered to have T2D if previously diagnosed T2D or with glycated hemoglobin (HbA1c) level ≥ 6.5% on two different determinations, or with at least two fasting glucose levels ≥ 7.0 mmol/l, or with a random glucose level of ≥ 11.1 mmol/l, or with a glucose level ≥ 11.1 mmol/l, 2 h after an oral glucose tolerance test (OGTT) with 75 g anhydrous glucose dissolved in water.
Participants were considered to have prediabetes if they were not using any antihyperglycemic medications and if they had a fasting glucose ranging between ≥ 5.6 mmol/l and < 7.0 mmol/l, but 2 h after OGTT had a plasma glucose level between 7.8 mmol/l and 11.1 mmol/l, or if they exhibited a HbA1c level between 5.7% and 6.4%.
The control group consisted of diabetes-free participants who were not using any antihyperglycemic medications, with a HbA1c level lower than 5.7% and fasting glucose lower than 5.6 mmol/l.
Participants with severe anemia, a history of acute myocardial infarction or stroke in the last 6 months, type 1 diabetes mellitus, high-sensitivity C-reactive protein (hsCRP) > 10 mg/l, thyroid dysfunction, hepatic disease other than steatosis, renal disease other than diabetic nephropathy and with estimated glomerular filtration rate (eGFR) < 15 ml/min/1.73 m2, patients with ethanol consumption > 20 g/day and pregnancy were excluded from the study.
Each participant signed consent and was well informed about the aim of the study. The Ethics Committee of the Primary Health Care Center in Podgorica, Montenegro approved the protocol of the study.
A total of 86% of T2D participants used oral antihyperglycemics (of them metformin, sulfonylureas, and inhibitors of dipeptidyl peptidase 4 (DPP-4 inhibitors) were used by 94%, 8%, and 10% of patients, respectively), whereas 30% of them were on insulin therapy. There were no participants in the control and prediabetes group who used antihyperglycemic medications, as would be expected based on inclusion/exclusion criteria. Hypolipidemics were used by 24%, 29% and 47% of participants in the control, prediabetes and T2D group, respectively. All of them used statins in the control and prediabetes group, whereas 96% of participants in the T2D group used statins and 4% of them used fibrates. Antihypertensive drugs were used by 46%, 63% and 83% of participants in the control, prediabetes and T2D group, respectively.
Anthropometric measurements were taken from each participant (i.e., body height (cm), body weight (kg), and waist circumference (WC), whereas body mass index (BMI) was calculated).
Systolic (SBP) and diastolic blood pressure (DBP) were measured with a mercury sphygmomanometer after the participant’s rest for 5 minutes. All measurements were taken by the same nurse and recorded the average of the 3 measurements taken on the right arm.
The estimation of glomerular filtration rate (eGFRMDRD) was calculated by using Modification of Diet in Renal Disease Study equation, as described previously [4].
Methods
The phlebotomy was performed and blood samples were taken in the morning after an overnight fast of at least 8 h. Samples collected in tubes with serum separator and clot activator were left to clot for 30 min, and thereafter were centrifuged at room temperature for 10 min at 3000xg. Afterwards, serum samples were divided into aliquots and stored at –80°C for determination of endocan, high-sensitivity C-reactive protein (hsCRP) and OS markers, whereas the remaining sera were analyzed immediately for fasting glucose, lipid parameters (i.e., triglycerides (TG), total cholesterol, high-density lipoprotein cholesterol (HDL-C), low-density lipoprotein cholesterol (LDL-C)) and creatinine. Samples of whole blood in tubes containing K2EDTA were used for determination of HbA1c levels using the immunoturbidimetric method. All these analyses were performed on Roche Cobas c501 chemistry analyzer (Roche Diagnostics GmbH, Mannheim, Germany). Serum hsCRP levels were measured by nephelometric assay (Behring Nephelometer Analyzer, Marburg, Germany). Endocan levels were measured using an enzyme-linked immunosorbent commercial assay (ab213776 – Human ESM1 ELISA Kit, Abcam, Cambridge, UK). Ninety-six well plates were coated with mouse monoclonal antibody specific for ESM1/endocan with samples added afterwards. A biotinylated detection polyclonal antibody from goat specific for ESM1/endocan was added subsequently and then rinsed three times in PBS or TBS buffer. Avidin-biotin-peroxidase complex was added (PBS or TBS buffer washed away unbound conjugates). HRP substrate TMB was added to visualize HRP enzymatic reaction. TMB was catalyzed by HRP resulting with the blue colored product. After adding TMB stop solution the blue product becomes yellow which is proportional to the concentration of human ESM1/endocan. The absorbance was read at 450 nm in a microplate reader for 30 min.
Determination of prooxidant-antioxidant balance (PAB) was performed using 3,3′, 5,5′-tetramethylbenzidine as a chromogen [16]. Advanced oxidation protein products (AOPP) were measured by a method that used a reaction with glacial acetic acid and potassium iodide [17]. Total oxidative status (TOS) was determined spectrophotometrically using o-dianisidine optimized by Erel [18]. Total antioxidative status (TAS) was evaluated spectrophotometrically using ABTS as a chromogen [19]. Total protein sulfhydryl (SH-) groups were measured spectrophotometrically using 5,5′-dithiobis (2- nitro benzoic acid) [20].
Calculation of novel scores
Since we aimed to explore the summary effect of the key risk factors in patients with prediabetes and T2D (i.e. dyslipidemia, OS and inflammation), we calculated the DOI score as the sum of the dyslipidemia score, oxy score and inflammation score [21, 22].
The dyslipidemia score was calculated after standardization of all the variables and calculating z scores for HDL-C, LDL-C, and TG and using mean and standard deviation calculated from the healthy control group. Afterwards, standardized HDL-C was subtracted from the average of the standardized variables (TG + LDL-C) [21, 22].
The oxy score was obtained by subtraction of the protective score (i.e. which was calculated as an average of standardized antioxidant variables (total SH- groups and TAS)) from the damage score (i.e. which was calculated as the average of standardized prooxidant factors (AOPP, TOS, and PAB)) [23].
The inflammation score was determined after standardization of hsCRP [21].
Statistical analysis
Before the start of the study, it was calculated that to achieve a power of 80% and a level of significance of 5% (two-sided) for detecting a true difference in means between the test and the reference group, a total of 111 participants in each of the control and T2D group was required. We included 10% more participants, but due to exclusion criteria, finally a total of 117 participants were included in the control group and 102 participants in the T2D group. However, we could not perform a sample size determination for the group with prediabetes because there were no previous studies that examined endocan levels in patients with prediabetes.
After testing data distribution by Shapiro-Wilk test, log-normally distributed data were presented as the geometric mean (95% confidence interval – 95% CI) and skewed distributed data as the median (interquartile range). Comparison of log-normal data was performed by one-way ANOVA with the Tukey post hoc test and comparison of skewed data was performed by the Kruskal-Wallis test when testing differences between three groups, and the Mann-Whitney test when testing the difference between two groups. Categorical data were presented as absolute and relative frequencies and compared by the χ2 test for contingency tables. Spearman’s bivariate correlation analysis was used for testing the associations between clinical parameters, and the data were presented as correlation coefficients (ρ). In-depth independent associations of clinical data with HbA1c level were tested with univariate and multivariate logistic ordinal regression analysis. Independent variables were given as continuous or dichotomous with no multicollinearity among them and each had an identical effect at each cumulative split of the ordinal dependent variable. Also, continuous independent variables included in models were correlated with HbA1c. HbA1c as a dependent variable is given at the ordinal level (1 for a HbA1c concentration less than 5.7%; 2 for a HbA1c level between 5.7 and 6.4%; and 3 for a HbA1c concentration higher than 6.4% or lower only if the patient self-reported T2D). Data from logistic ordinal regression analyses were presented as odds ratio (OR) and 95% CI. The explained variation in HbA1c level in the tested population was given by the Nagelkerke R 2 value.
All statistical testing was performed using the statistical program IBM SPSS Statistics version 22 (SPSS Inc., Chicago, Ilinois, USA). The statistical significance level was set at two-sided p < 0.05.
Results
There were unequal numbers of women and men were in the tested groups. There were unequal numbers of women and men in the tested groups. The youngest examinees were those in the control group. Patients with T2D had the highest BMI and WC compared to controls and prediabetes patients. Smokers were most prevalent in the prediabetes group. Patients on hypolipidemic and antihypertensive therapies were more frequent among patients with T2D (Table I).
Table I
Demographic characteristics of tested population groups
| Parameter | Control group | Prediabetes | T2D | P-value# |
|---|---|---|---|---|
| N (male) | 117 (30%) | 59 (34%) | 102 (53%) | 0.001 |
| Age [years] | 58 (56–60) | 62 (60–65)a** | 65 (63-67)a** | < 0.001 |
| BMI [kg/m2] | 27.3 (26.6–28.1) | 28.5 (27.4–29.6) | 30.3 (29.5–31.2)a**,b* | < 0.001 |
| WC [cm]† | 95 (87–102) | 96 (91–102) | 104 (97–110)a**,b** | < 0.001 |
| SBP [mm Hg]† | 136 (124–146) | 136 (126–150) | 133 (126–148) | 0.642 |
| DBP [mm Hg]† | 84 (77–91) | 85 (76–92) | 84 (77–94) | 0.921 |
| Smokers, n (%) | 25 (21) | 19 (32) | 14 (14) | 0.021 |
| Antihyperglycemics, n (%): | – | – | 88 (86) | – |
| Metformin | 83 (94) | |||
| Sulfonylurea | 7 (8) | |||
| DPP-4 inhibitors | 9 (10) | |||
| Insulin, n (%) | – | – | 31 (30) | – |
| Hypolipidemics, n (%): | 28 (24) | 17 (29) | 48 (47) | 0.001 |
| Statins | 28 (100) | 17 (100) | 46 (96) | |
| Fibrates | – | – | 2 (4) | |
| Antihypertensives, n (%): | 54 (46) | 37 (63) | 85 (83) | < 0.001 |
| ACE | 47 (87) | 30 (81) | 67 (79) | |
| CCB | 3 (5) | 1 (3) | 8 (9) | |
| ARB | 3 (5) | 1 (3) | 8 (9) | |
| Beta-blockers | 15 (32) | 7 (19) | 27 (32) | |
| Thiazide diuretics | 26 (48) | 18 (49) | 49 (58) | |
| Duration of diabetes, years | – | – | 5 (1–10) | – |
Most of the tested clinical markers, except for TAS, TOS and total SH groups, were significantly different between tested groups (Table II). There were significant differences in glucose and HbA1c level between all three groups, being the highest in the T2D and the lowest in the control group. The lowest TC, LDL-C and PAB levels were in the group with T2D. HDL-C level was the highest in the control group. Creatinine concentration was the highest in the T2D group. Patients with prediabetes and T2D had significantly higher hsCRP and AOPP levels than the control group. TG and endocan levels were significantly different only between the control group and T2D, being higher in the group of patients with T2D.
Table II
Clinical markers of tested population groups
| Parameter | Control group | Prediabetes | T2D | P-value# |
|---|---|---|---|---|
| Glucose [mmol/l] | 5.4 (5.2–5.6) | 6.1 (5.8–6.5)a* | 7.9 (6.7–9.6)a*,b* | < 0.001 |
| HbA1c (%) | 5.3 (5.1–5.5) | 5.9 (5.7–6.0)a* | 7.1 (6.5–8.9)a*,b* | < 0.001 |
| Total cholesterol [mmol/l]† | 5.80 (5.57–6.04) | 6.02 (5.64–6.43) | 5.23 (5.02–5.46)a**,b** | < 0.001 |
| HDL cholesterol [mmol/l]† | 1.51 (1.44–1.58) | 1.31 (1.20–1.44)a** | 1.20 (1.14–1.26)a** | <0.001 |
| LDL cholesterol [mmol/l]† | 3.42 (3.23–3.63) | 3.73 (3.42–4.07) | 2.92 (2.72–3.13)a**,b** | < 0.001 |
| TG [mmol/l]† | 1.54 (1.42–1.67) | 1.77 (1.56–2.00) | 2.06 (1.88–2.26)a** | < 0.001 |
| Creatinine [μmol/l]† | 70 (62–84) | 72 (66–71) | 80 (67–93)a*,b* | < 0.001 |
| eGFRMDRD [mL/min/1.73 m2]† | 82 (73–91) | 77 (70–86) | 73 (62–86)a* | 0.001 |
| HsCRP [mg/l] | 0.88 (0.75–1.04) | 1.31 (1.02–1.68)a* | 1.54 (1.29–1.84)a** | < 0.001 |
| AOPP [μmol/l] | 38.84 (36.89–40.89) | 45.82 (41.57–50.49)a** | 47.12 (44.14–50.31)a** | < 0.001 |
| PAB [HKU] | 103 (96–110) | 104 (93–115) | 88 (81–95)a*,b* | 0.005 |
| TOS [μmol/l]† | 9.09 (7.81–10.58) | 10.30 (8.22–12.90) | 11.09 (9.63–12.76) | 0.180 |
| TAS [μmol/l]† | 1130 (1077–1186) | 1120 (1075–1166) | 1162 (1108–1220) | 0.562 |
| Total SH- groups [μmol/l] | 0.237 (0.219–0.256) | 0.270 (0.248–0.295) | 0.269 (0.248–0.293) | 0.065 |
| Endocan [ng/ml] | 0.282 (0.246–0.323) | 0.308 (0.248–0.383) | 0.395 (0.330–0.473)a** | 0.002 |
Data are presented as geometric mean (95% CI) and compared by one-way ANOVA with Tukey post hoc test.
† Data are presented as median (interquartile range) and compared by Kruskal-Wallis test or Mann-Whitney test dependent on the number of examined groups.
HbA1c – glycated hemoglobin, HDL cholesterol – high-density lipoprotein cholesterol, LDL cholesterol – low-density lipoprotein cholesterol, TG – triglycerides, eGFRMDRD – estimated glomerular filtration rate, HsCRP – high-sensitivity C-reactive protein, AOPP – advanced oxidation protein products, PAB – prooxidant-antioxidant balance, TOS – total oxidative status, TAS – total antioxidative status, Total SH- groups – total protein sulfhydryl (SH-) groups.
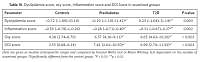
The Kruskal-Wallis test showed significant differences in all calculated scores and all of them were significantly lower in the control group compared to the prediabetes and T2D groups (Table III). The scores showed no difference between the prediabetes and T2D groups.
Table III
Dyslipidemia score, oxy score, inflammation score and DOI Score in examined groups
| Parameter | Controls | Prediabetes | T2D | P-value |
|---|---|---|---|---|
| Dyslipidemia score | –0.72 (–1.89)–(0.14) | –0.19 (–1.10)–(1.41)a* | 0.23 (–1.04)–(1.14)a** | 0.003 |
| Inflammation score | –0.59 (–0.78)–(–0.26) | –0.28 (–0.71)–0.40a* | –0.31 (–0.67)–0.27a** | 0.002 |
| Oxy score | 4.38 (2.74–6.70) | 6.57 (4.16–9.11)a* | 6.65 (4.63–10.26)a* | < 0.001 |
| DOI score | 3.55 (0.68–6.14) | 7.41 (2.62–10.50)a* | 6.99 (2.70–11.92)a* | < 0.001 |
Results from Spearman’s correlation analysis between HbA1c and other variables are presented in Table IV. Significant positive correlations were established between HbA1c and the following variables: years of age, BMI, WC, glucose, TG, creatinine, hsCRP, AOPP, TAS, total SH groups and calculated scores in all participants. Significant negative correlations were observed between HbA1c and total cholesterol, HDL-C, LDL-C and PAB in all participants.
Table IV
Spearman’s correlation analysis between HbA1c and clinical markers in all participants
| Parameter | Rho (ρ) |
|---|---|
| Age [years] | 0.311** |
| BMI [kg/m2] | 0.282** |
| WC [cm] | 0.351** |
| SBP [mm Hg] | 0.002 |
| Glucose [mmol/l] | 0.744** |
| Total cholesterol [mmol/l] | –0.165* |
| HDL cholesterol [mmol/l] | –0.334** |
| LDL cholesterol [mmol/l] | –0.157** |
| TG [mmol/l] | 0.254** |
| Creatinine [μmol/l] | 0.207** |
| HsCRP [mg/l] | 0.239** |
| AOPP [μmol/l] | 0.284** |
| PAB [HKU] | –0.143* |
| TOS [μmol/l] | 0.109 |
| TAS [μmol/l] | 0.130* |
| Total SH- groups [μmol/l] | 0.180** |
| Endocan [ng/ml] | 0.157** |
| Dyslipidemia score | 0.169** |
| Inflammation score | 0.165** |
| Oxy-score | 0.299** |
| DOI score | 0.239** |
HbA1c – glycated hemoglobin, BMI – body mass index, WC – waist circumference, SBP – systolic blood pressure, DBP – diastolic blood pressure, HDL cholesterol – high-density lipoprotein cholesterol, LDL cholesterol – low-density lipoprotein cholesterol, TG – triglycerides, HsCRP – high-sensitivity C-reactive protein, AOPP – advanced oxidation protein products, PAB – prooxidant-antioxidant balance, TOS – total oxidative status, TAS – total antioxidative status, Total SH- groups – total protein sulfhydryl (SH-) groups.
Further we wanted to test whether endocan and scores were independently associated with HbA1c concentration using logistic ordinal regression analysis (Table V). Significant ORs obtained in univariate analysis were evident for all tested parameters. This analysis indicated that a rise in endocan concentration by 1 unit increased the probability of higher HbA1c concentration 3 times (OR = 3.69, 95% CI: 1.84–7.01, p < 0.001). Also, a rise in dyslipidemia score, oxy score, inflammation score and DOI score by 1 unit increased the probability of higher HbA1c concentration by 19%, 13%, 51% and 11%, respectively. When tested in different models, endocan, dyslipidemia score and DOI score were found to be independent predictors of HbA1c level. In all four models (Models 1–4), as endocan concentration rose by 1 unit, the probability of a higher HbA1c level increased by 2.66, 2.31, 2.64 and 2.28 times, respectively. As dyslipidemia score (Model 1) and DOI score (Model 4) rose by 1 unit, the probability of a higher HbA1c level increased by 31% and 9%, respectively. Nagelkerke R 2 for Models 1–4 were 0.366, 0.395, 0.395 and 0.359, respectively, which means that 36.6%, 39.5%, 39.5% and 35.9% of variation in HbA1c level could be explained by parameters included in the models.
Table V
Estimated odds ratios after ordinal regression analysis for HbA1c cut-offs as dependent variable
[i] Data are given as OR (95% CI). Model 1 included continuous variables: age, WC, creatinine, hsCRP, endocan, dyslipidemia score and categorical variables: gender, smoking habits, antihypertensive therapy, hypolipidemic therapy. Model 2 included continuous variables: age, WC, creatinine HDL-c, TG, hsCRP, endocan, oxy score and categorical variables: gender, smoking habits, antihypertensive therapy, hypolipidemic therapy. Model 3 included continuous variables: age, WC, creatinine HDL-c, TG, endocan, inflammation score and categorical variables: gender, smoking habits, antihypertensive therapy, hypolipidemic therapy. Model 4 included continuous variables: age, WC, creatinine, endocan, DOI score and categorical variables: gender, smoking habits, antihypertensive therapy, hypolipidemic therapy
Discussion
To the best of our knowledge, this is the first study that has estimated serum endocan levels and the summary involvement of dyslipidemia, OS and inflammation by comprehensive score calculation (i.e., DOI score) in relation to glucoregulation in patients with prediabetes and T2D. Although previous studies investigated separately some of the biomarkers that were used for calculation of these scores in patients with T2D, we presumed that the mutual effect of several of these biomarkers calculated as DOI score could better explain the complex interrelationship between glucoregulation and these features, rather than examining each single biomarker. Additionally, endocan is not explored thoroughly in different stages of diabetes, such as prediabetes and overt T2D.
In line with this, we have shown that serum endocan levels were significantly higher in T2D group than in the controls. Although median values of endocan levels were higher in the prediabetes than the control group, the differences between these two groups did not reach statistical significance, perhaps due to the small sample size group of patients with prediabetes. On the other hand, the lack of significant difference in endocan levels between the prediabetes and T2D group, even though median values of endocan levels were higher in T2D, might be explained by the fact that patients with T2D used anti-hyperglycemic medications, unlike patients with prediabetes in our study, which might affect the results [11].
The current study has also for the first time shown that all examined novel scores (i.e., oxy-score, inflammation, dyslipidemia and its summary DOI score) were significantly higher in the prediabetes and T2D group, as compared with the control group. Furthermore, our research showed that endocan and summary DOI score are independently correlated with HbA1c level in examined population groups.
Inflammation is one of the underlying risks of β cell damage and IR in patients with T2D [2]. Furthermore, the vicious circle of hyperinsulinemia and hyperglycemia and the prolonged burden of pro-inflammatory cytokines lead to deeper imbalance in the lipoprotein levels, promote lipid peroxidation, as well as oxidative modification of protein structures, and aggravate endothelial dysfunction and atherosclerosis [6, 24]. Having these facts in mind, a novel inflammation biomarker of endothelial dysfunction, such as endocan [3], and a comprehensive DOI score which includes all these key features of T2D may be important determinants of the progression of this metabolic disorder.
In the study of Balamir et al. [25], serum endocan levels were shown to be associated with endothelial dysfunction in T2D patients. Also, a recent study of Lv et al. [26] suggested that serum endocan might be a reliable parameter for the early diagnosis of subclinical atherosclerosis in T2D patients, showing its independent relationship with carotid intima-media thickness. Furthermore, higher levels of endocan were also reported in T2D patients with acute ST-segment elevation myocardial infarction compared with the newly diagnosed untreated T2D patients and healthy controls [8]. Moreover, Arman et al. [11] showed a significant decrease in endocan levels in patients with T2D after 3-month follow-up with lifestyle modification and anti-hyperglycemic treatment.
The potential of endocan to stimulate secretion of proinflammatory cytokines by endothelial cells, as well as its ability to enhance the permeability of blood vessels may increase atherosclerotic disease risk burden [9], especially in subjects with prediabetes and T2D. Since poor glucoregulation represents an important risk factor for CVD morbidity and mortality [15, 24], further prospective studies are needed to elucidate whether determination of examined biomarkers (i.e. endocan and DOI scores) in a timely manner may be useful to detect increased atherosclerotic risk and also to elucidate whether the lowering of these biomarkers can enable prevention of T2D and/or its vascular complications.
Limitations of the current study need to be mentioned. The majority of examined participants, especially those with T2D, were on some kind of medication treatment, which might influence the results [3, 11, 27]. Namely, previous studies have shown that antihypertensive medications, such as amlodipine and valsartan, may lower serum endocan levels and hsCRP [28]. Moreover, metformin was shown to decrease levels of endocan and some endothelial markers [11, 29], whereas antilipemic agents exert beneficial effects on endothelial cells, and consequently lower endocan levels, also [30]. Above this, the duration of diabetes and its complications may also influence examined biomarkers. Additionally, diseases that were excluded from the study were self-reported by participants, which might be a source of bias, also. Therefore, new research is needed to further explore endocan levels and their relation with OS, inflammation and dyslipidemia in patients with prediabetes and newly diagnosed T2D. Furthermore, environmental and genetic factors [31, 32] included in the glucose homeostasis regulatory mechanisms which may play an important role in the occurrence of T2D have not been explored in the current study, but might have influenced the obtained results.
On the other hand, the strength of our study is the fact that, beside endocan, we explored a relatively wide spectrum of OS markers and calculated a novel summary score of the key features of T2D (i.e. the DOI score) in order to gain deeper insight into the cardiometabolic changes in prediabetes and T2D.
In conclusion, the current study has for the first time shown that endocan and a novel score for dyslipidemia, oxidative stress and inflammation (DOI score) are independently correlated with HbA1c in patients with prediabetes and T2D. Knowing that poor glucoregulation represents an important risk factor for CVD, future studies are needed to examine whether determination of these biomarkers in a timely manner may be useful to detect atherosclerotic disease risk burden in (pre)diabetes, and to investigate whether lowering it can enable prevention of T2D and/or its cardiometabolic complications.