Introduction
Heel pain is a common problem among the adult population [1]. There can be many causes of heel pain such as plantar fasciitis (PF), heel spur, or gout, with PF being the most common cause. Planter fasciitis affects approximately 10% of the population, with approximately 1 million people being treated annually [2,3]. Females are more commonly affected compared to males. PF is considered to be a degenerative disease of plantar fascia probably due to overuse trauma that leads to micro tears. It significantly hinders routine activities as well as athletic endeavours [4]. Plantar fascia is a strong connective tissue that extends from the os calcis to the level of the metatarsal heads [5]. It comprises three bundles: medial, central, and lateral, with the central bundle being the most commonly affected. There is also an entity called distal plantar fasciitis, which is a cause of recalcitrant heel pain [6]. Risk factors for developing plantar fasciitis include bio-mechanical factors such as severe pronation and decreased dorsiflexion of ankle, obesity, prolonged standing, walking, running, and improper footwear [7-11]. Rheumatoid arthritis and seronegative spondyloarthropathies are also associated with this disease [12]. The diagnosis is made clinically with the help of history and physical examination with the major symptom being pain on the plantar aspect of the heel, which increases on weight bearing. On clinical examination, there is localised tenderness, predominantly on the inferomedial aspect of the calcaneal tuberosity [13,14].
Imaging is of immense help in arriving at an appropriate diagnosis, providing adequate treatment and in assessing response to treatment. It has been observed that in PF the thickness of the plantar fascia is increased compared to individuals without PF. The modalities used are plain radiograph, ultrasound, or magnetic resonance imaging (MRI). Because it is a disease of soft tissues, plain radiography has been unrewarding [15]. MRI is expensive, time consuming, and is unsuitable for claustrophobic patients. Hence, ultrasonography is now being increasingly used to assess plantar fascia in patients with clinical diagnosis of plantar fasciitis. It has the added advantages of being non-invasive, cost-effective, easily accessible, good with spatial resolution for the superficial structures and evaluation of the tissues with real-time dynamics. It is also useful in guiding treatment. Ultrasound-guided local injection has been shown to produce better pain relief as compared to injection by palpation alone [16,17]. It can also be used in guiding shockwave therapy and successive follow-up of the patients [18,19].
The aim of this study was to assess the efficacy of ultrasonography in the assessment of plantar fascia in individuals with plantar fasciitis.
Material and methods
The current study was a prospective study. Approval of the Institutional ethics committee was obtained. The study was conducted from January 2016 to May 2019. It consisted of two groups: a control group and a study group. The control group comprised 50 asymptomatic volunteers (100 heels), and the study group comprised 44 patients (50 heels). Written informed consent was obtained from all the individuals included in the control and study groups.
In the control group there were 25 males and 25 females. Volunteers in these two sub-groups were age matched. It was designed to establish normal thickness of the plantar fascia at its attachment to the calcaneal tuberosity (within 1 cm) in the asymptomatic population in the region. The majority of these volunteers presented to the department of radiodiagnosis for ultrasonography of a region other than the heel. Patients who had any past history suggestive of heel pain, systemic disease such as rheumatoid arthritis, gout, or had sustained any injury to the heel were excluded.
The study group consisted of 44 patients (50 heels); six patients had bilateral disease and 38 patients had unilateral disease. There were 42 females and two males, with ages ranging between 40 and 58 years. Inclusion criteria in the study group were chronic heel pain (> 3 months) and heel pad tenderness on clinical examination. Exclusion criteria were patients who had systemic inflammatory arthritis and neuromuscular disease. Diagnosis was made on the basis of history and clinical examination.
Ultrasonography examinations of all patients in both groups was performed by two radiologists. Each radiologist took measurements twice. The mean of the two values was taken into consideration. It was performed with a linear 17-5 MHz probe (Philips iU22, Bothell, WA, USA). Patients were asked to lie prone with feet hanging from the edge of the table, and their ankles were placed in dorsiflexion. Care was taken to maintain the ultrasound beam perpendicular to the plantar fascia so that anisotropy could be avoided. Calcaneal attachment was better appreciated on sagittal images. Plantar fascia appears as a “hyperechoic band with linear fibres” on the background of a hypoechoic matrix [20]. The thickness of the plantar fascia was measured within 1 cm of the calcaneal attachment. Once the range of normal thickness of plantar fascia was established in the control group, the study on symptomatic patients was carried out.
Body weight and body height were measured in both the groups, and the body mass index (BMI) was calculated.
Statistical analysis
After collecting the data, it was entered in a Microsoft Excel spreadsheet. Mean, standard deviation, and standard error were calculated for quantitative data. Frequency and percentages were calculated for qualitative data. Data was analysed by using “IBM SPSS STATISTICS” (version 16.0). Analysis was done by using Student’s t-test and χ2 test. All statistical tests were applied at a significance level of α = 0.05 (p value < 0.05).
Results
There were 25 males and 25 females, with ages varying from 40 to 65 years (mean age was 38.22 ± 8.38 years) in the control group. The ages of the patients in the study group ranged between 40 and 58 years (mean age was 36 ± 4.24 years). There were 42 females and two males (Table 1). There was no statistical difference between both the groups with respect to age (p = 0.721). Ultrasound examinations of all patients were performed by two radiologists, with each radiologist taking measurements twice. The mean of the two values was taken into consideration. Analysis of collected data showed excellent intra-observer agreement with an intraclass correlation coefficient (ICC) value of 0.839 (95% confidence interval [CI]: 0.752-0.901) and an excellent inter-observer agreement with an ICC value of 0.842 (95% CI: 0.762-0.907).
Table 1
Demographic data of the participants
| Parameter | Control group n = 50 (100 heels) | Study group n = 44 (50 heels) | p value |
|---|---|---|---|
| Age (years) | 40-65 | 40-58 | 0.721 |
| 38.22 ± 8.38 | 36.00 ± 4.24 | ||
| BMI (kg/m2) | 25.67 ± 2.47 | 28.76 ± 2.23 | 0.03 |
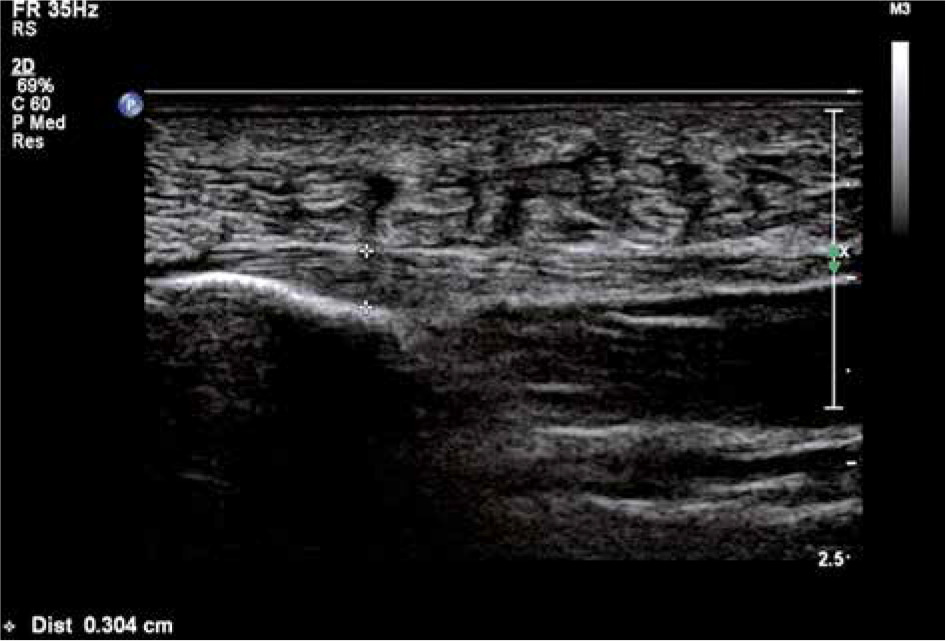
In the control group, the minimal and maximal thickness of plantar fascia (right or left) was 2.7 ± 0.4 mm and 3.1 ± 0.8 mm, respectively, with mean thickness of 2.9 ±0.7 mm (Figure 1).
Figure 1
Longitudinal ultrasound of a normal individual showing thickness of normal plantar fascia: 3.04 mm
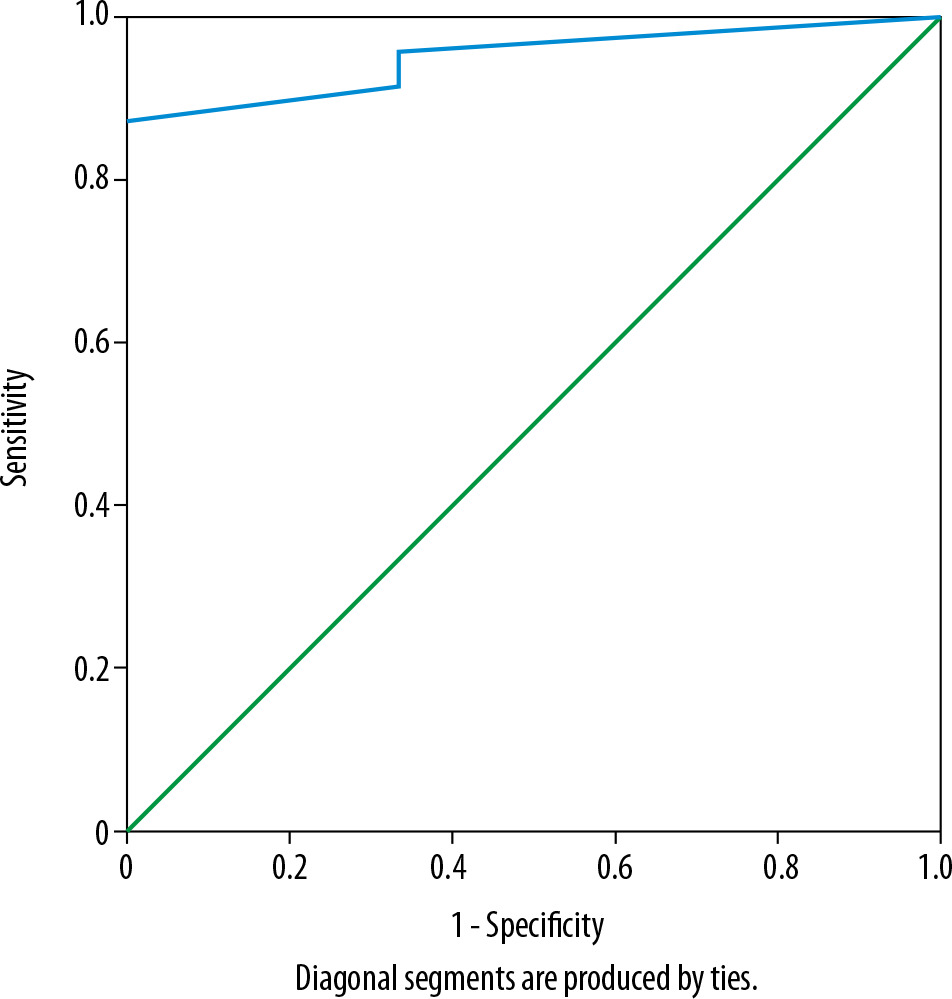
In the study group the mean thickness of the plantar fascia was 5.2 ± 1.13 mm on the right side and 5.3 ± 1.24 mm on the left side (Figure 2). The maximal thickness of the plantar fascia (right or left) in these patients was 6.2 ± 1.09 mm, and the minimal thickness of the plantar fascia (right or left) was 4.7 ± 0.4 mm (Table 2). In 48/50 heels of study (42/44 patients) group participants the plantar fascia thickness was found to be > 4 mm. The thickness of the plantar fascia on the affected side was increased in 36 patients with unilateral involvement as compared to the uninvolved side, whereas in two patients the thicknesses of the plantar fascia on the affected side was 3.82 mm and 3.9 mm as compared to 3.10 mm and 2.80 mm, respectively, on the normal side. The receiver operating characteristic (ROC) curve was analysed (Figure 3). Area under the curve was 0.950 (95% CI: 0.881-1.020). A cut-off value of 4 mm of plantar fascia thickness provided sensitivity of 96% and specificity of 100%.
Table 2
Values of plantar fascia thickness in control and study groups
Figure 2
Longitudinal ultrasound of a symptomatic individual showing increased thickness of plantar fascia: 6.6 mm
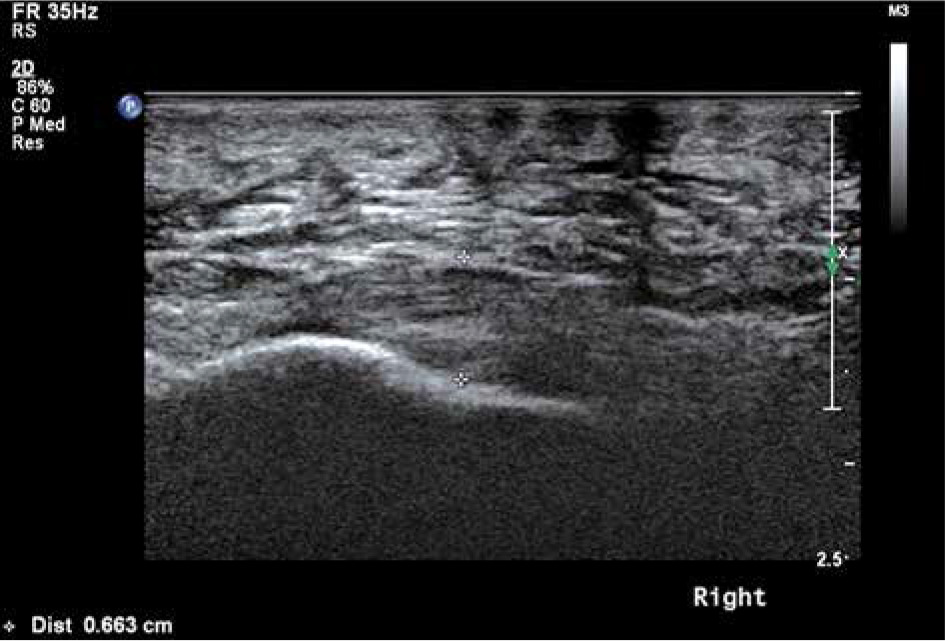
Figure 3
ROC curve. Area under curve is 0.950 (95% CI = 0.881-1.020). Cut-off value of PF thickness > 4 mm provided 96% sensitivity and 100% specificity
The mean BMI for the study group was 28.76 ± 2.23 kg/m2 whereas the mean BMI in the control group was 25.67 ± 2.47 kg/m2. There was a significant difference in BMI between both groups (p = 0.03). The BMI was increased (> 25 kg/m2) in 25/42 (60%) female patients.
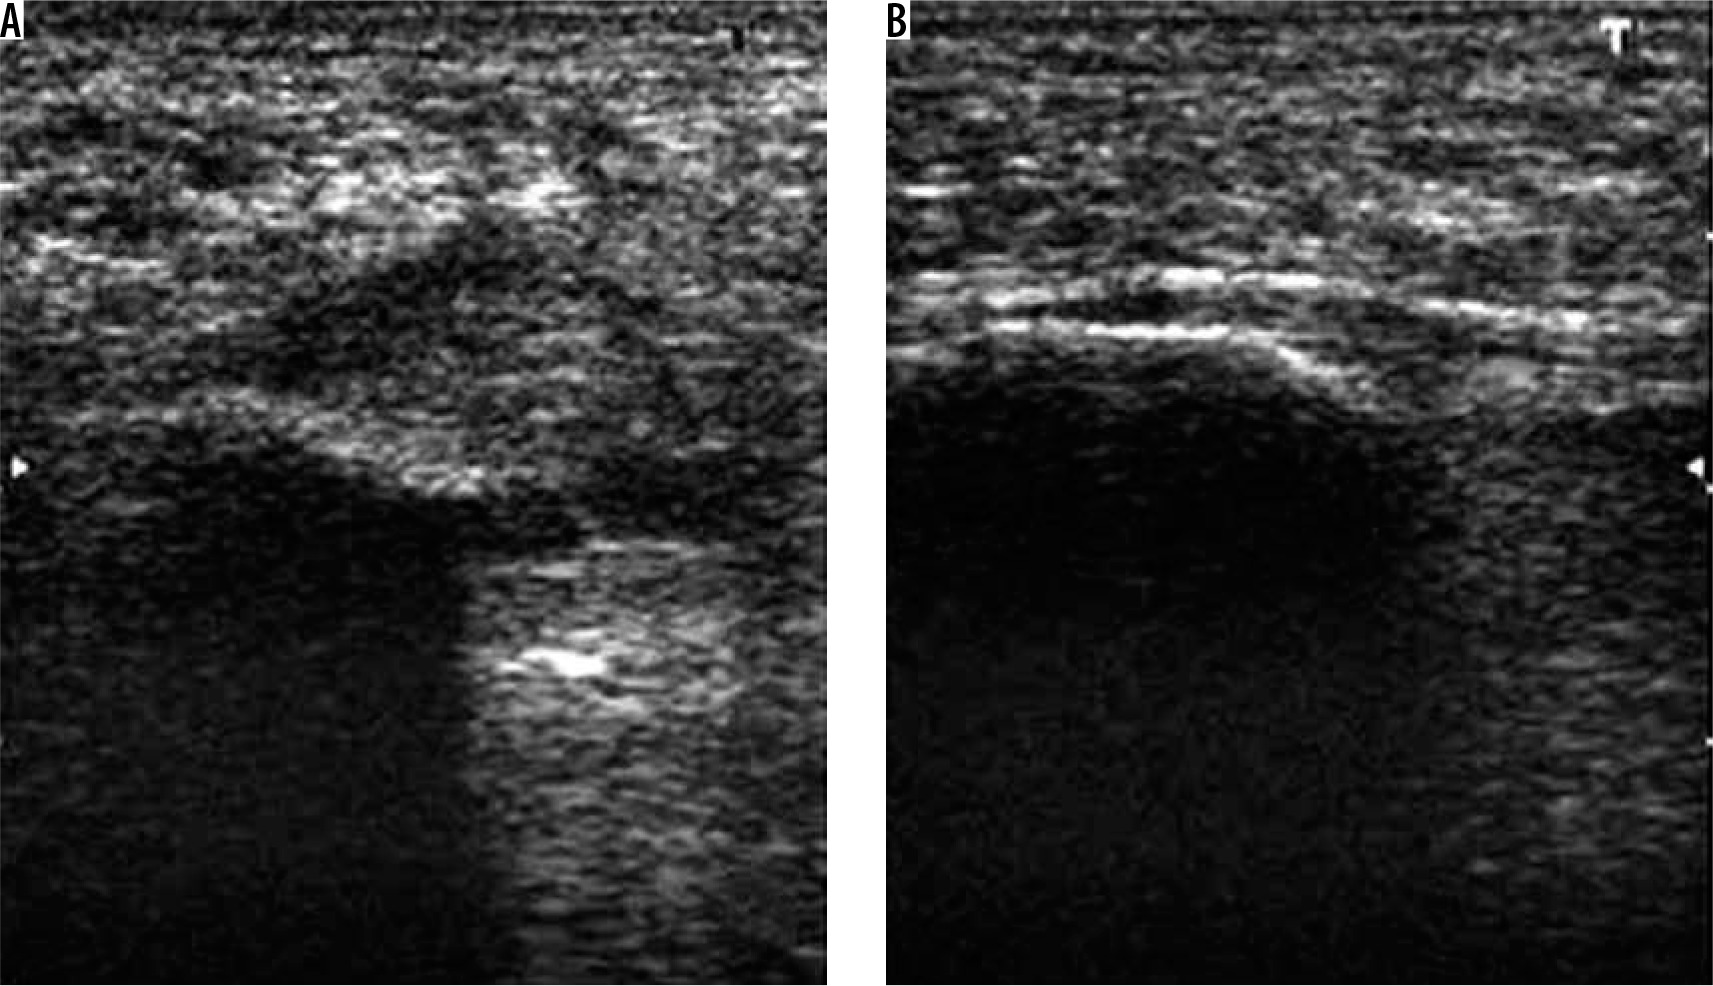
All symptomatic patients were given local injection containing a mixture of 4 ml of local anaesthetic bupivacaine and 1 ml (40 mg) of corticosteroid methylprednisolone without ultrasound guidance. These patients were re-evaluated with ultrasonography after six weeks of local steroid injection. In 37 patients (43 heels) where there was complete resolution or significant improvement in symptoms, the thickness of the plantar fascia was reduced to < 4 mm (Figure 4). In six patients (six heels) with no notable improvement in symptoms, there was no significant decrease in the plantar fascia thickness as compared to pre-injection thickness. In one patient (one heel) in whom there was no relief of symptoms, the plantar fascia thickness was found to be decreased, i.e. 3.8 mm compared to 4.9 mm before injection.
Figure 4
A) Longitudinal ultrasound of a symptomatic patient who had earlier showed increased plantar fascia thickness when re-evaluated after 6 weeks of local steroid injection (B) showing normal thickness of plantar fascia: 2.75 mm
The plantar fascia was hypoechoic in all the study subjects, and it was of normal echogenicity in the control subjects. The outline of the plantar fascia was sharp in control subjects and was indistinct in all the study subjects. Fluid collection, intratendinous calcifications, or rupture of the plantar fascia were not seen in any of the patients in this study.
Discussion
The plantar fascia is a tough connective tissue that helps to maintain the longitudinal arch of the foot. It is the “tendon aponeurosis” for the superficial layer of the intrinsic muscles of the foot. It absorbs and disperses the loading/weight-bearing forces across the mid-foot joints and helps during gait [21]. PF is the commonest cause of chronic heel pain. It is seen in individuals who do a lot of physical exertion and is common in middle-aged women. It is related also to repetitive micro-trauma. Tarsal tunnel syndrome, osteomyelitis, or stress fracture of calcaneum, gout, and subcalcaneal bursitis are the differential diagnoses [22]. Because the plantar fasciitis is mainly diagnosed clinically, the role of imaging modalities is debated and is generally used to rule out other alternative/rare diseases. Because it is a disease of soft tissues, MRI or ultrasono-graphy is the preferred modality of imaging in these patients. Plain radiography can be used to supplement these modalities. MRI is the imaging modality of choice in confirming the diagnosis of plantar fasciitis. However, ultrasonography has the advantages of easy accessibility, lower cost, it is relatively fast, and has very good spatial resolution for superficial structures; hence, it is used increasingly in the diagnosis of plantar fasciitis [23,24]. There are few studies on the role of ultrasound elastography, which can detect initial changes in plantar fascia stiffness before the detection of findings on routine ultrasound [25]. Softening of plantar fascia is seen with ageing and in individuals with plantar fasciitis [26]. A study conducted by Lee et al. revealed that plantar fascia softening did not differ significantly between controls and subjects with plantar fasciitis in older individuals, while it differed significantly in a younger group [27]. Some studies suggested that when sonoelastography was combined with routine B-mode ultrasonography in the diagnosis of plantar fasciitis there was a significant increase in diagnostic accuracy [25,28]. Sonoelastography may also be useful in monitoring the response to treatment as studied by Kim et al. because it can detect increased stiffness of the plantar fascia [29].
The aim of this study was to assess the role of diagnostic ultrasonography in establishing the diagnosis of plantar fasciitis. In this study, the majority of patients (42/44) were female, which is in concordance with the results published by Ozdemir et al., where plantar fasciitis was more common in females as compared to males [22].
The ages of the patients in the present study ranged from 40 to 58 years, which is similar to the findings reported by Khalifa et al. where PF was observed in the age group 40-60 years [30].
Increased body weight has been implicated as a causative factor in the evolution of PF.
Our study showed that the mean BMI for symptomatic group (study group) was significantly higher, i.e. 28.76 ± 2.23 kg/m2, as compared to 25.67 ± 2.47 kg/m2 in the control group. This difference was statistically significant. This is in agreement with the study conducted by Sabir et al. where the BMI (≥ 25 kg/m2) was significantly higher in the patient group [31].
Increase in thickness and/or hypoechogenicity of plantar fascia, perifascial oedema, fluid collection, intratendinous calcifications, and rupture of the plantar fascia are findings associated with plantar fasciitis. Many studies have used combinations of these for the diagnosis of plantar fasciitis [16,32,33]. In our study, the thickness of the plantar fascia in the control group was in the range 2-4 mm (mean 2.9 ± 0.7 mm). In none of the individuals in this group, the thickness of plantar fascia was > 4 mm. Thickness of plantar fascia was increased in 48/50 heels in the study group (42/44 patients), where the maximal thickness was 6.2 ± 1.09 mm and minimal thickness was 4.7 ± 0.4 mm. With ≥ 4 mm of thickness of plantar fascia as the cut-off, ultrasonography was diagnostic of PF in 42/44 patients (48 heels), giving a sensitivity of 96%, specificity of 100%, and accuracy of 98%. Similar results were reported by Wearing et al. and Akfirat et al., where the mean thickness of the plantar fascia in symptomatic patients was 6.1 ± 1.43 mm and 4.8 ± 1.52 mm, respectively [34,35]. All patients in our study with plantar fasciitis showed hypoechogenicity of plantar fascia, as described by Tsai et al. in their study [36].
Another finding that was seen in patients of plantar fasciitis in our study was loss of sharp outline due to perifascial oedema, as described by Akfirat et al. and Gibbon et al. in patients with plantar fasciitis [32,33]. None of the patients in our study had fluid collection or intratendinous calcifications or rupture of the plantar fascia.
Another finding that can be seen in patients with plantar fasciitis is increased vascularity of plantar fascia, which can be assessed by colour Doppler. Colour Doppler ultrasound can identify hyperaemia in the plantar fascia and perifascial tissues. However, it can be better visualised by power Doppler [12,37]. The study conducted by Walther et al. revealed that moderate or marked hyperaemia is seen in individuals with acute plantar fasciitis but not in chronic plantar fasciitis [38]. Thus, power Doppler can be used with routine B-mode ultrasound in the diagnosis of plantar fasciitis and also in determining whether the fasciitis is acute or chronic. However, further studies are needed to validate these findings.
All patients included in the study group were treated with local steroid injection without ultrasound guidance. Follow-up ultrasounds performed at six weeks after the injection revealed that that there was a decrease in the thickness of the plantar fascia in almost all patients who showed significant improvement in symptoms. Thus, it can be used to diagnose as well as to assess the response to treatment.
Conclusions
Diagnosis of plantar fasciitis can be easily confirmed with ultrasonography. Thickness > 4 mm, indistinct margins, and hypoechogenicity are diagnostic. It is low cost, easily available, highly accurate, and has high patient acceptance due to its noninvasive nature. Ultrasonography is highly sensitive and specific in diagnosing plantar fasciitis. Ultrasound provides adequate detail and information to the practicing clinician to confirm the primary diagnosis of plantar fasciitis. It can also assess the response to treatment (post local steroid injection) and helps the clinician in deciding the management regimens and follow-up. However, the major limitation of ultrasonography is that it is operator dependent.