Introduction
Chronic inducible urticaria (CIndU) encompasses a variety of subtypes, each triggered by specific physical or environmental stimuli, such as cold, heat, pressure, and sunlight, among others [1, 2]. Omalizumab, a recombinant anti-IgE antibody, has been shown to be effective in treating CIndU, particularly in cases where patients are refractory to H1-antihistamines [3, 4]. The efficacy of omalizumab varies across different CIndU subtypes [3]. In a study involving 80 patients, omalizumab demonstrated a high rate of satisfactory or complete response [5]. However, response rates can differ with some patients experiencing a slower response time [5]. Predictors of treatment response include disease duration, presence of angioedema, and baseline urticaria control test scores [6]. Despite its efficacy, the cost and response heterogeneity of omalizumab necessitate the development of a clinic-friendly prediction tool to optimise its use [4]. Real-world data further support omalizumab’s safety and effectiveness, with a significant proportion of patients achieving complete or good response, and a median treatment duration exceeding 5 years [7]. The need for a prediction tool is underscored by the variability in treatment outcomes and the potential for long-term management strategies to be individualised based on patient response.
Studies indicate that non-response to omalizumab typically exhibit lower baseline IgE levels [8, 9]. Additionally, inflammatory markers such as the systemic immune-inflammation index (SII) and systemic inflammatory response index (SIRI) have been explored for their prognostic value [10]. Patient-reported outcomes correlate with IgE levels post-treatment [11]. CIndU presents unique challenges in treatment response prediction, particularly when compared to chronic spontaneous urticaria (CSU). Existing studies highlight a significant gap in predictive models specifically tailored for CIndU [2, 12]. While treatment response rates for CIndU are promising, predictors of these responses remain underexplored [2]. Current literature emphasises the need for dynamic prediction models that incorporate early changes in patient status and decision-analytic evaluations to assess clinical utility [13, 14]. Furthermore, the Chronic Urticaria Index has shown potential in identifying disease severity and treatment responsiveness [14]. Because CIndU-specific prognostic evidence remains limited [2, 12], our Pre-specified candidate predictors were partly informed by CSU literature, which may not fully capture CIndU-specific mechanisms. Thus, comprehensive research focusing on CIndU-specific indicators is essential for advancing personalised treatment strategies.
Our aim was to develop and internally validate SIMPLE-CIndU, a parsimonious “simple-indicator” prediction model based on routinely available variables at treatment start and to construct a dynamic week-4 update that incorporates the early patient-reported change in control (∆UCT-7) to refine individual risk of week-12 omalizumab response (defined by UCT ≥ 12). We hypothesised that a compact baseline model comprising readily obtainable indicators – would achieve clinically useful discrimination and calibration, and that adding ∆UCT-7 at week 4 would significantly improve predictive performance and clinical utility.
Material and methods
Study design and oversight
We conducted a single-centre, non-interventional observational cohort study at our hospital to develop and internally validate a multivariable model for predicting week-12 non-response to omalizumab in CIndU from January 2019 through April 2025 with clinical records supplemented by standardised research assessments, with all care delivered per routine practice and no protocol-mandated treatment changes. This study was conducted in accordance with the Declaration of Helsinki. The protocol was reviewed and approved by the Ethics Committee of The First Affiliated Hospital of Soochow University, which waived the requirement for informed consent because this was a retrospective analysis of de-identified routinely collected data and posed no more than minimal risk to participants. All data were anonymised prior to analysis.
Participants and diagnostic confirmation
Eligibility criteria included age ≥ 12 years, clinician-confirmed CIndU with reproducible, stimulus-dependent wheals/angioedema for ≥ 6 weeks, and at least one positive standardised provocation test for the implicated subtype. Provocation methods included TempTest® for cold/heat (critical temperature threshold), FricTest®/dermographometer for symptomatic dermographism (friction/pressure thresholds), weighted-rod/dermographometer with 6-hour assessment for delayed pressure, phototesting for solar (minimal urticarial dose/action spectrum), and pulse-controlled ergometry or passive warming for cholinergic urticaria. When clinically safe, H1-antihistamines were discontinued for approximately 3 days and systemic glucocorticoids for approximately 7 days prior to testing, per consensus recommendations [15], and recently affected skin (≤ 24 h) was avoided to reduce false negatives. Exclusion criteria were concomitant biologic therapy at baseline, inability to confirm inducibility on standardised testing, or missing core baseline data required for modelling. Subtypes were coded as symptomatic dermographism, cholinergic, cold, delayed pressure, and a pooled solar/heat/other group to ensure adequate cell sizes.
Exposure and routine care
The exposure was initiation of omalizumab after failure of up-dosed second-generation H1-antihistamines, with the index date defined as the first omalizumab dose. Dosing (typically 150–300 mg at 4-week intervals) and any interval adjustments or add-on therapies were at physician discretion and recorded. Post-baseline treatment modifications were not included as predictors to avoid information leakage but were summarised descriptively and used for stratified calibration checks.
Outcomes and assessment schedule
The primary clinical outcome was week-12 response defined a priori as UCT ≥ 12 (score range 0–16; well-controlled disease), with the binary modelling event specified as non-response (UCT < 12) at week 12 (±2 weeks) to support early identification of patients unlikely to achieve control by week 12. An early-response variable, ∆UCT-7, was calculated as the change from baseline to week 4 (±1 week) using the 7-day recall UCT (range 0–16 for each time point). By definition, ∆UCT-7 can be negative or positive, with higher positive values indicating improvement. Secondary outcomes included “complete response” at week 12 (UCT = 16 plus normalised provocation threshold where applicable), changes in quality of life (DLQI for all; CU-Q2oL where available), and adverse events. Subtype-specific provocation thresholds were obtained at baseline and week 12 using the instruments above; for exploratory analyses across subtypes, thresholds were standardised within-subtype to z-scores and allowed to enter the modelling pool but were not forced into the final model when penalisation shrank their effects. Week-12 outcomes were not imputed; primary model development used participants with observed week-12 UCT. For descriptive baseline comparisons, missing week-12 UCT was conservatively classified as non-response, and sensitivity analyses evaluated complete-case outcome handling, inverse-probability-of-censoring weighting, and a “missing = non-response” scenario.
Predictors and assays
Pre-specified simple indicators collected at baseline (within 4 weeks prior to index and always before the first dose) included demographics (age, sex, BMI), disease duration, CIndU subtype, baseline UCT, and a minimal laboratory panel aligned with guideline-concordant testing: total IgE (kU/l), CBC with differential (absolute eosinophils and derived NLR/PLR/SII), CRP (mg/l), and anti-TPO (binary). Total IgE was measured on a single chemiluminescent platform and log2-transformed to address right-skew (per-doubling effect). CBC-derived ratios were computed directly from analyser outputs. To reduce multicollinearity, raw leukocyte counts were not modelled concurrently with multiple ratio indices in the same candidate block. Post-dose laboratory values were not considered as predictors.
Sample size and model complexity
Based on contemporary CIndU data, we anticipated ~60–65% week-12 responders, implying an event fraction for non-response ≈ 37%; with n = 557 and approximately 206 events, we capped model degrees-of-freedom at ≤ 10 to meet modern shrinkage/EPV guidance and favour parsimony, which informed the selection of penalised regression and the pooling of rarer subtypes.
Statistical analysis
Analyses were performed in R (Version 4.4). Continuous variables were summarized by medians (IQR) and compared using Wilcoxon rank-sum tests; categorical variables were summarised by counts/percentages and compared using χ2 tests. The family-wise false discovery rate within the table was controlled using the Benjamini–Hochberg procedure, with both p-values and q values reported (two-sided α = 0.05). The primary prediction model was a penalised logistic regression (glmnet) for week-12 non-response, with restricted cubic splines considered for continuous predictors and retained only if they improved out-of-sample performance under resampling. In the final model, spline terms were not retained because they did not improve optimism-corrected performance and increased model complexity. Hyper-parameters (λ and α) were tuned within resampling. The candidate pool comprised baseline UCT, log2(total IgE), disease duration, CIndU subtype indicators (reference symptomatic dermographism), eosinophils or NLR (but not both together with raw counts), CRP, anti-TPO, and the standardised threshold metric; penalisation allowed data-driven exclusion of weak predictors. Adjusted odds ratios with 95% confidence intervals (CIs) are presented for retained predictors, acknowledging lasso/LASSO shrinkage biases Wald p-values toward the null.
Internal validation, performance, and calibration
Internal validation used ≥ 1000-sample bootstrap that repeated the entire modelling pipeline in each resample, including multiple imputation of predictors (m = 20; MICE), penalty tuning, model fitting, and performance estimation. We report optimism-corrected AUROC, Brier score, and calibration intercept/slope, with paired AUROC differences between baseline and dynamic models tested by DeLong’s method using out-of-bootstrap predictions. Calibration was examined with loess/LOESS-smoothed curves and summarised by intercept and slope (ideal 0 and 1).
Dynamic early-update model, reclassification, and temporal testing
A dynamic model added ∆UCT-7 at week 4 to the baseline predictor set and was refit under the same bootstrap pipeline. Improvement was quantified by AUROC/Brier changes and category-free NRI and IDI with 1000-bootstrap 95% CIs. For clinical interpretability, we Pre-specified non-response risk categories as low < 20%, intermediate 20–40%, and high > 40%, and constructed a reclassification matrix. Transportability was further assessed by leave-one-subtype-out analyses and by a temporal test training on initiations before January 2024 and evaluating on 2024–2025 initiations.
Decision curve analysis
We used decision curve analysis to estimate net benefit of using predicted week-12 non-response risk to trigger early management changes compared with treat-all and treat-none strategies. Threshold probabilities from 10% to 40% were examined a priori, reflecting plausible probabilities at which clinicians might intensify follow-up or consider dose/interval adjustment or switching; we therefore highlight the 15–35% range where such decisions are commonly preference-sensitive.
Results
Participants and baseline characteristics
From January 2019 to April 2025, 612 patients were screened, 55 were excluded, and 557 initiated omalizumab (Figure 1). Primary model development used observed week-12 outcomes (no outcome imputation). Week-12 UCT was observed for 544/557 (97.7%) and week-4 UCT-7 for 512/557 (91.9%). For descriptive summaries and baseline comparisons, the 13 missing week-12 outcomes were classified as non-response, yielding 343/557 (61.6%) responders and 214/557 (38.4%) non-responders (Figure 1). The cohort’s median age was 34 years (IQR 26–45) and 58.0% were female with symptomatic dermographism, cholinergic, and cold being the most frequent subtypes (Table 1). Compared with responders, non-responders had longer disease duration (36 vs. 24 months; p < 0.001; FDR q < 0.001), lower baseline UCT (5 vs. 8; p < 0.001; q < 0.001), and lower total IgE (70 vs. 150 kU/l; p < 0.001; q < 0.001), while anti-TPO positivity was more frequent among non-responders (22.6% vs. 14.5%; p = 0.010; q = 0.020). The overall subtype distribution differed by outcome, with cold and delayed-pressure phenotypes over-represented among non-responders (p < 0.001; q < 0.001) (Table 1).
Figure 1
Study flow diagram. Participant disposition from January 2019 to April 2025. A total of 612 patients were assessed; 55 were excluded (not CIndU by standardised provocation testing, n = 21; concomitant biologic at baseline, n = 14; incomplete baseline data, n = 20)
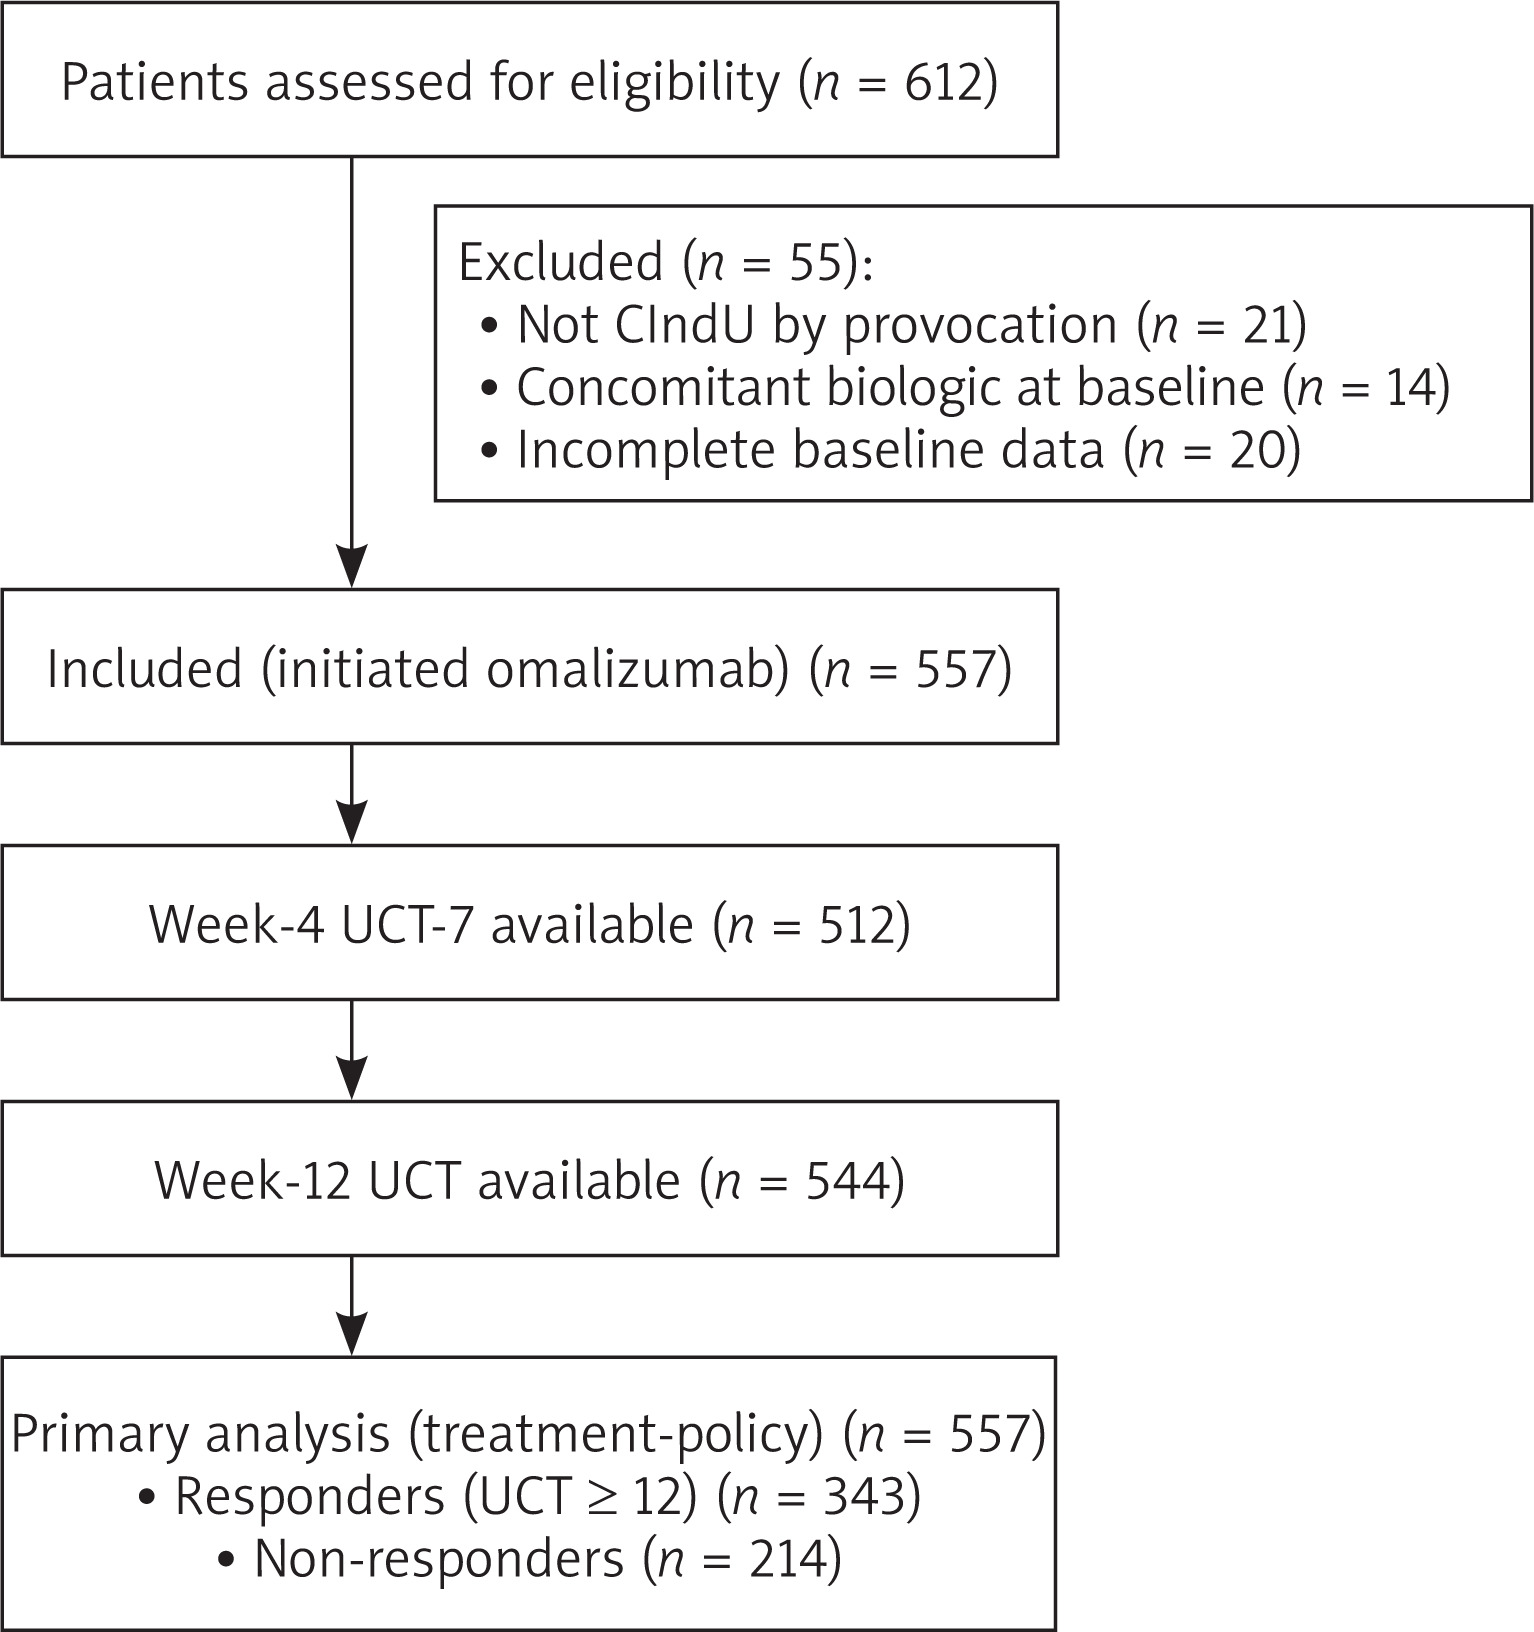
Table 1
Baseline characteristics overall and by week-12 outcome
Baseline prediction model
In the penalised logistic regression predicting week-12 non-response among those with observed outcomes, baseline UCT, log2(total IgE), disease duration, and subtype indicators were retained after shrinkage, while other exploratory markers were penalised toward zero (Table 2). Higher baseline UCT and higher total IgE were associated with reduced odds of non-response (adjusted OR per 1-point UCT 0.85, 95% CI: 0.80–0.90; adjusted OR per doubling of IgE 0.74, 95% CI: 0.63–0.86; both p < 0.001; q < 0.001), and longer disease duration increased non-response risk (OR per year 1.05, 95% CI: 1.02–1.08; p = 0.001; q = 0.003). For example, holding other predictors constant, a patient with baseline UCT 8 vs. 5 has approximately 39% lower odds of week-12 non-response (OR ≈ 0.61), and a patient with total IgE 200 vs. 50 kU/l has approximately 45% lower odds (OR ≈ 0.55). Relative to symptomatic dermographism, cold (OR = 1.58, 95% CI: 1.10–2.26; p = 0.013; q = 0.026) and delayed pressure urticaria (OR = 1.65, 95% CI: 1.01–2.72; p = 0.046; q = 0.069) had higher odds of non-response, while cholinergic and solar/heat/other did not differ significantly. Optimism-corrected performance showed AUROC 0.78 (95% CI: 0.74–0.82), Brier 0.19, and near-ideal calibration (slope 0.98; intercept 0.01) (Figures 2 A, B and Table 3).
Table 2
Penalised logistic regression (lasso/elasticnet) for week-12 non-response
Figure 2
A – ROC curves for the baseline model (penalised logistic regression) and the dynamic model adding the week-4 change in UCT-7 (ΔUCT-7). AUROCs are 0.78 and 0.84, respectively (DeLong p < 0.001). B – Calibration plots show slopes near 1.0 and small intercepts after bootstrap optimism correction; Brier scores were 0.19 (baseline) and 0.16 (dynamic)
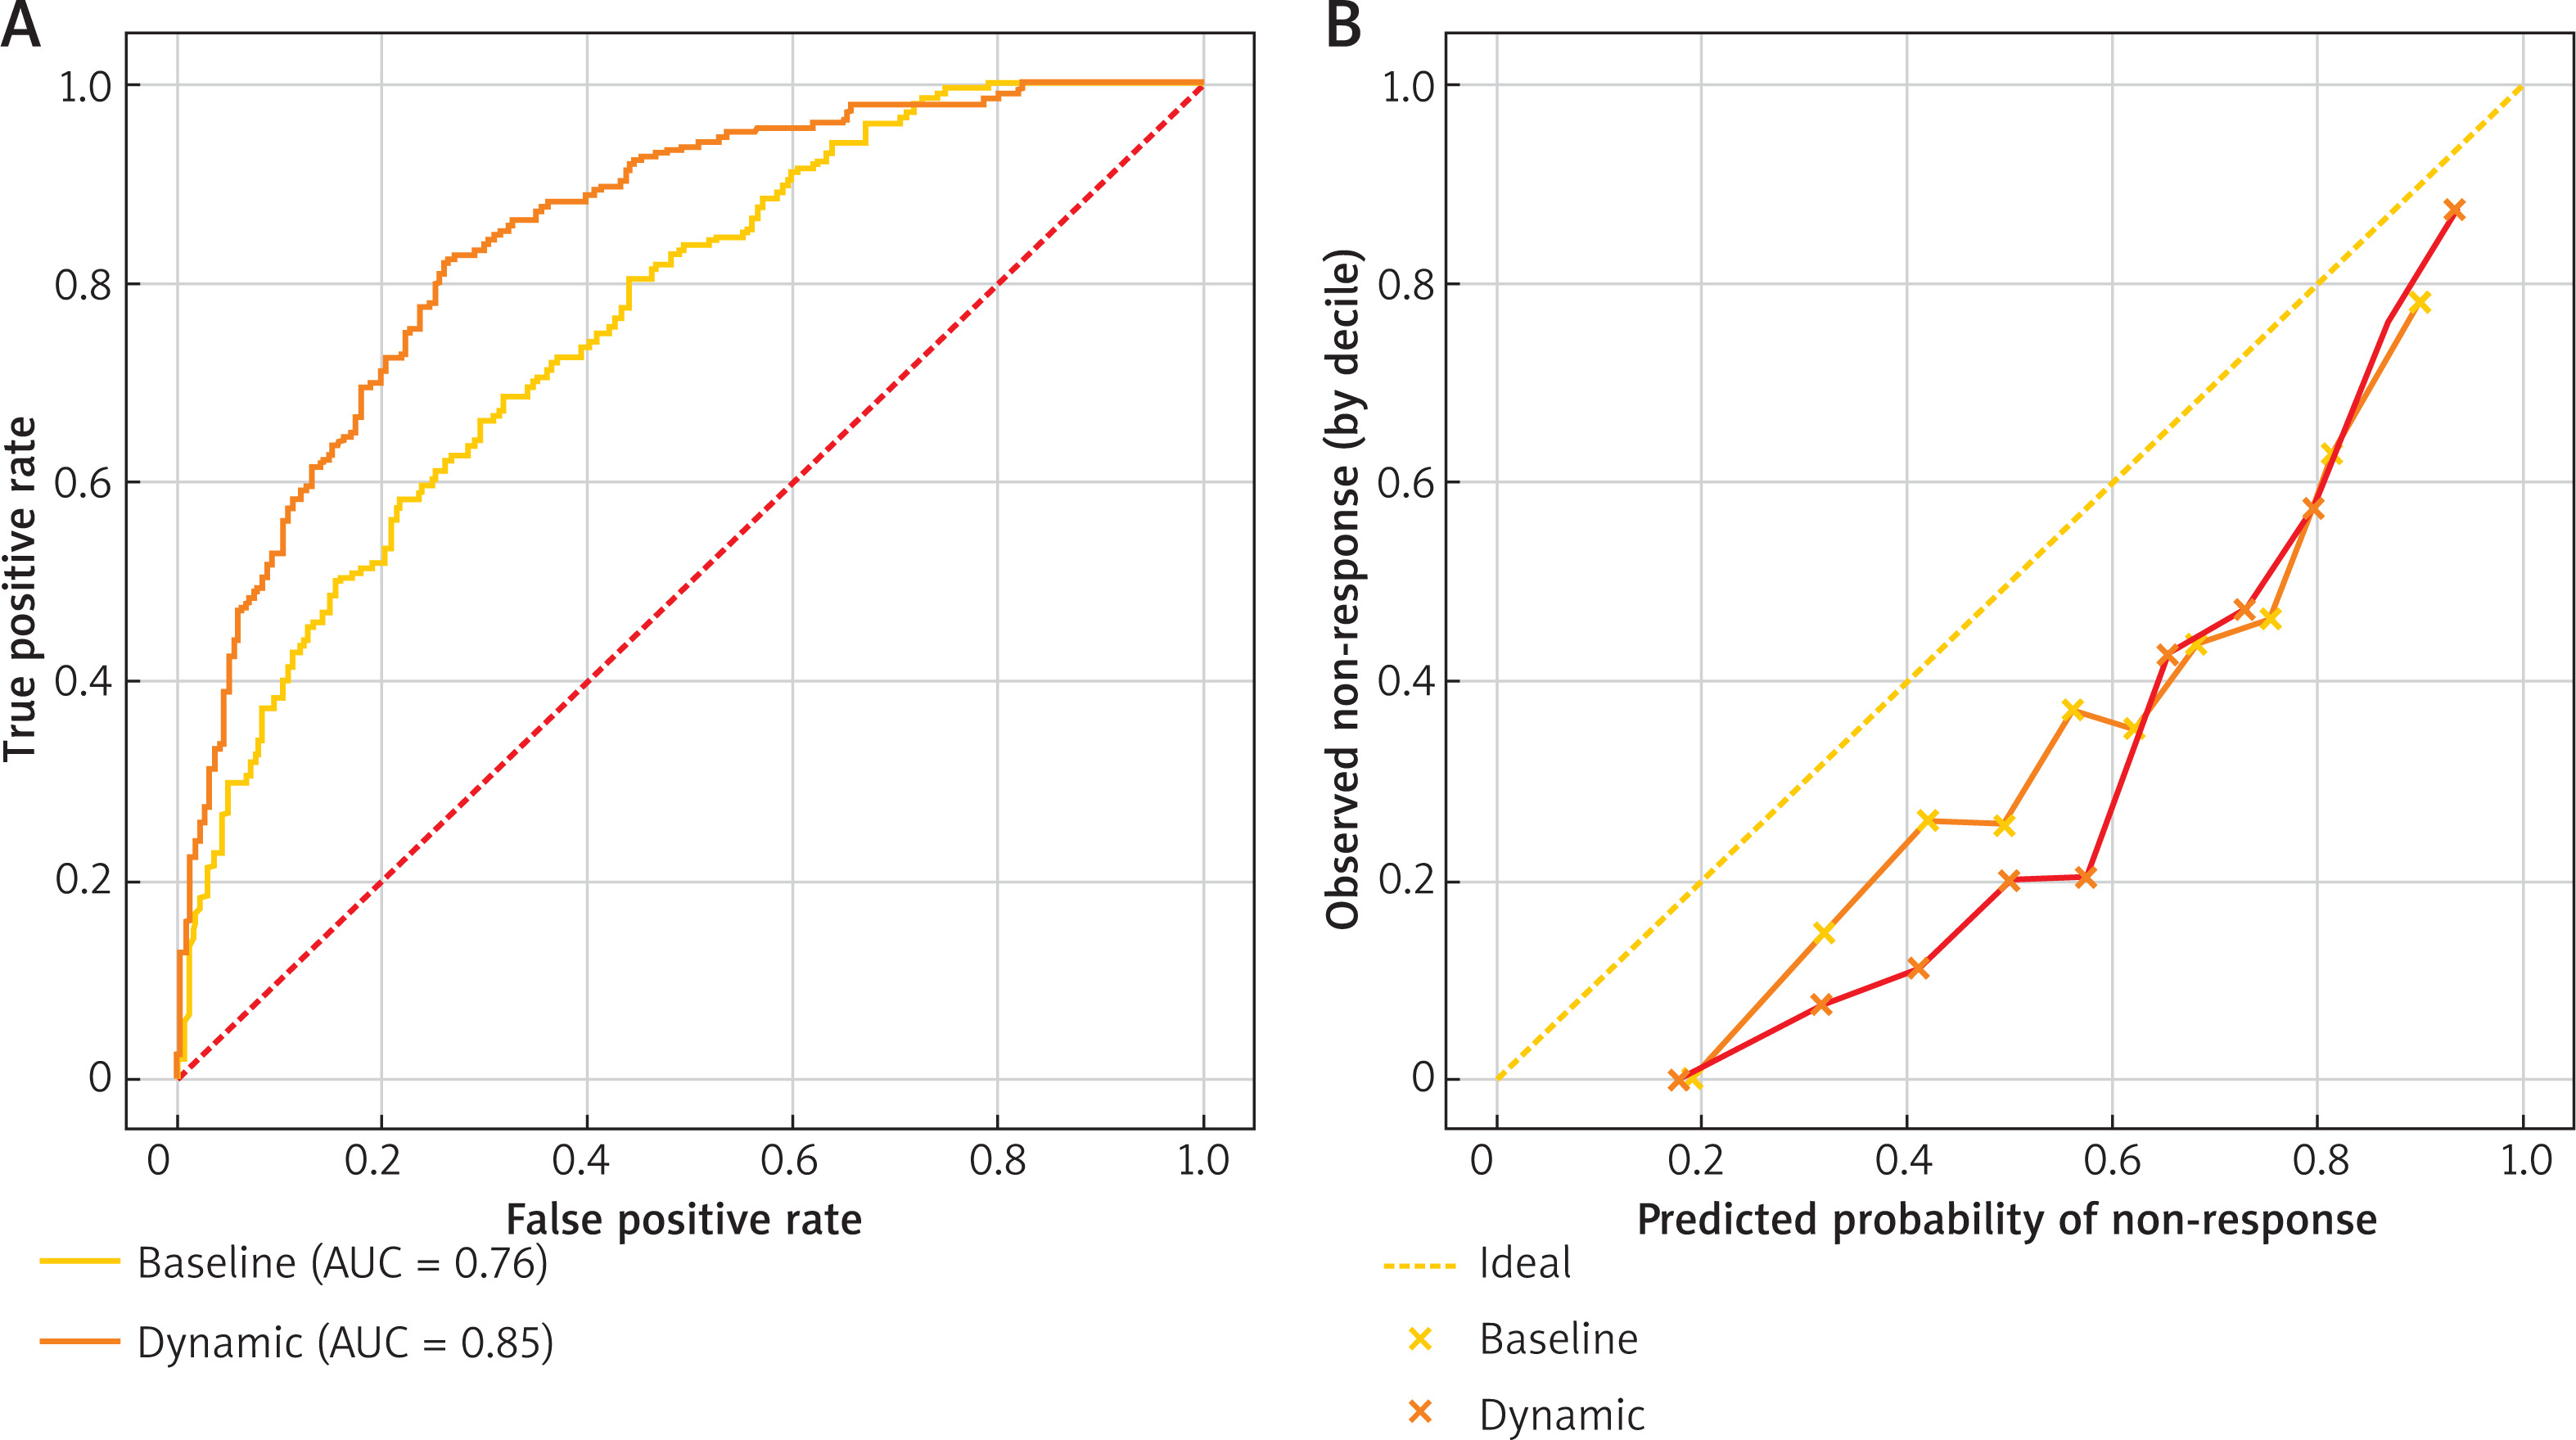
Table 3
Discrimination and calibration overall and by subtype: baseline vs. dynamic (Week4 ΔUCT-7 added)
Dynamic week-4 model and reclassification
Adding ∆UCT-7 at week 4 improved discrimination and accuracy in those with week-4 data, increasing AUROC from 0.78 to 0.84 (95% CI: 0.81–0.87) with a DeLong p < 0.001 (FDR q < 0.001) and reducing the Brier score from 0.19 to 0.16. Although ∆UCT7 was modelled as a continuous predictor, changes of ~0–2 points (minimal/no improvement), 3–5 points (moderate improvement), and ≥ 6 points (marked improvement) provide a pragmatic bedside interpretation of early control change on the 0–16 scale. Calibration slopes remained approximately 1.0 after optimism correction (Figures 2 A, B and Table 3). Using pre-specified non-response risk strata (< 20%, 20–40%, > 40%), the reclassification matrix showed clinically meaningful movement (Table 4): among non-responders (n = 190), 27.4% were up-classified and 12.6% down-classified; among responders (n = 322), 19.3% were down-classified and 16.8% up-classified. Category-free NRI = 0.18 (95% CI: 0.09–0.27; p < 0.001; q < 0.001) and IDI 0.06 (95% CI: 0.04–0.08; p < 0.001) supported the added value of early change information (Table 4).
Subtype and temporal validation
Model performance was consistent across major CIndU phenotypes, with gains from the dynamic update in each stratum (Table 3). For symptomatic dermographism, AUROC improved from 0.80 (95% CI: 0.75–0.85) to 0.85 (95% CI: 0.80–0.89) (p = 0.002; q = 0.006); for cholinergic (n = 128), from 0.77 (95% CI: 0.67–0.86) to 0.84 (95% CI: 0.75–0.91) (p = 0.030; q = 0.045); and for cold (n = 118), from 0.74 (95% CI: 0.66–0.82) to 0.82 (95% CI: 0.75–0.88) (p = 0.010; q = 0.020). Smaller strata (delayed pressure and solar/heat/other) showed numerically similar improvements with wider confidence intervals. In a temporal test set of 2024–2025 initiations (n = 176), AUROC increased from 0.76 (95% CI: 0.70–0.82) to 0.83 (95% CI: 0.78–0.88) (p = 0.004; q = 0.008) with corresponding Brier reduction and preserved calibration, indicating transportability over calendar time (Table 3).
Decision-curve analysis and clinical utility
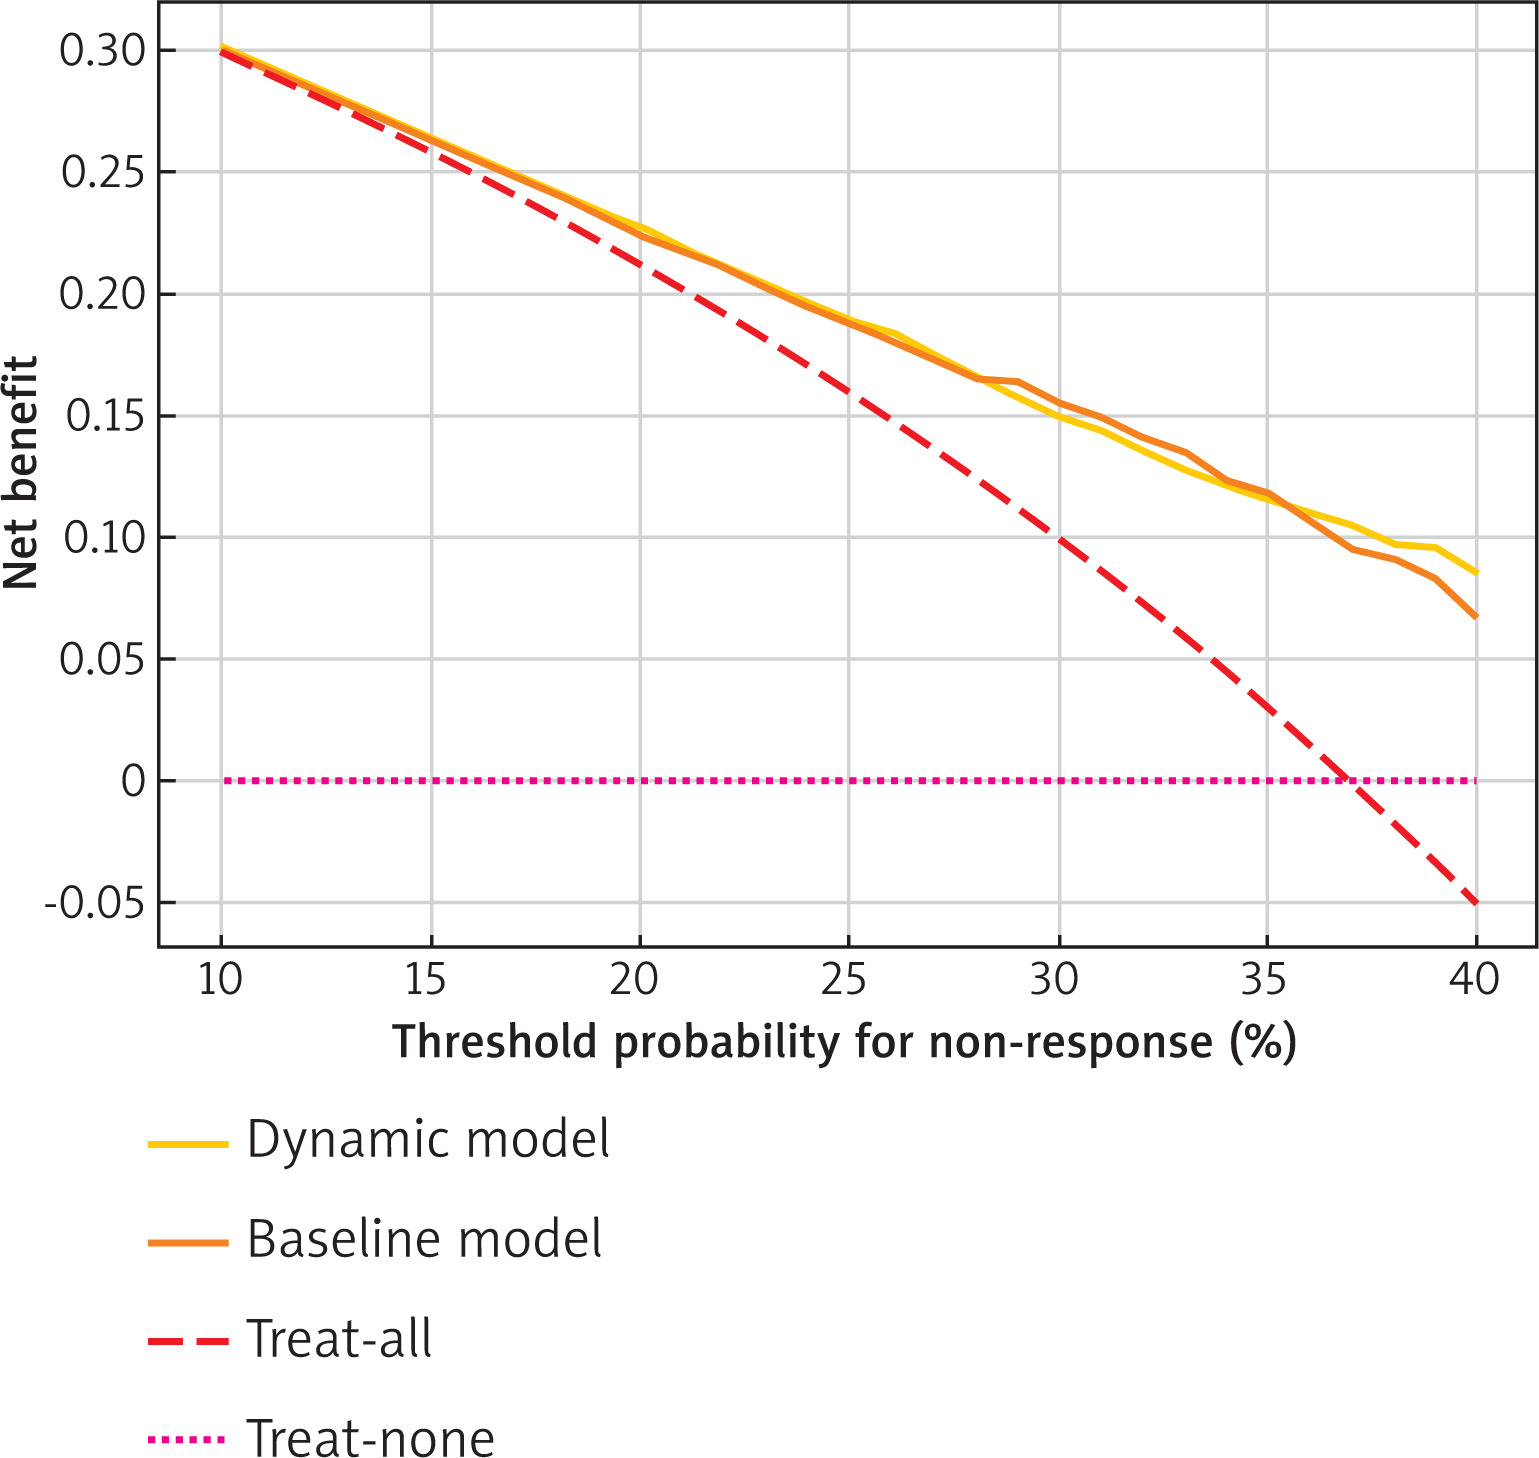
Decision curve analysis demonstrated that both models yielded higher net benefit than treat-all or treat-none across clinically plausible escalation thresholds, with the dynamic model providing the greatest net benefit between ~15% and 35% predicted risk of non-response (Figure 3). We highlighted this ~15–35% region because it overlaps the intermediate-risk zone in our Pre-specified strata and represents a clinically plausible range where escalation decisions are most sensitive to individualised risk estimates. These findings align with the observed gains in discrimination and accuracy and suggest that incorporating week-4 ∆UCT-7 into risk estimation could reduce unnecessary escalations while prioritising high-risk patients for earlier intervention (Figure 3 and Table 3).
Safety and sensitivity analyses
No anaphylaxis occurred, and 5 (0.9%) patients experienced mild adverse events (injection-site reactions or transient headache) without treatment discontinuation. Results were robust to attrition handling: inverse-probability-of-censoring weights produced AUROC and calibration estimates within the bootstrap 95% CIs of the main analyses, and counting all missing week-12 outcomes as non-response did not materially alter event proportions or the direction and magnitude of key associations.
Discussion
In this single-centre cohort with chronic inducible urticaria, we developed a parsimonious baseline model for predicting week-12 omalizumab non-response using only routine data, the optimism-corrected baseline model showed solid discrimination, accuracy, and good calibration, with higher baseline UCT and higher log2(total IgE) associated with a lower non-response risk, and longer disease duration plus certain subtypes associated with a higher risk. Adding the early patient-reported change at week-4 (∆UCT-7) yielded a clinically meaningful improvement in performance while preserving calibration, and DCA demonstrated greater net benefit than treat-all or treat-none across plausible escalation thresholds. Pre-specified, practical non-response risk categories provided actionable stratification to tailor counselling and follow-up intensity and to trigger early dose/interval escalation or switching where appropriate.
Our findings fit the pharmacology of omalizumab and current endotype thinking. Omalizumab neutralises free IgE and down-regulates FcεRI on basophils and mast cells, a cascade that reduces effector-cell responsiveness over weeks [16, 17]. In CSU, pretreatment total IgE robustly associates with response, and similar biology plausibly applies to CIndU subtypes [18–20]. Autoimmune signatures are linked to poorer or slower omalizumab responses and may mark patients whose disease is less IgE-dependent [21, 22]. Inflammatory-tone markers such as CRP show consistent relationships with disease activity and treatment course, whereas CBC-derived ratios (NLR/PLR/SII) show mixed predictive performance and are best treated as adjuncts [23, 24]. The prognostic value of ∆UCT-7 in our cohort is biologically plausible that early symptomatic change integrates pharmacodynamic engagement of the IgE–FcεRI axis and patient behaviour, and is supported by validation of the UCT/UCT-7 and by biomarker data that baseline soluble FcεRI predicts early response [25–27]. Finally, trigger–effector mechanics that define cold urticaria, symptomatic dermographism, cholinergic urticaria, delayed pressure urticaria, and solar urticaria can be quantified using standardised provocation tests, strengthening measurement across subtypes and motivating our use of cross-subtype severity standardisation [28–31].
Because all inputs to our score are routinely available, the tool can be used at baseline to counsel on the likelihood of week-12 control and, at week-4, to update the risk and tailor action. In practice, patients with predicted non-response risk in the ~15–35% range are candidates for closer follow-up, earlier dose/interval adjustment, or switch per guideline-concordant pathways [16]. Randomised, placebo-controlled trials show omalizumab efficacy in symptomatic dermographism and cold urticaria, and large UCARE data support effectiveness and safety across CIndU subtypes, aligning with our observation that early ∆UCT-7 meaningfully reclassifies risk and could reduce unnecessary escalation while prioritising those unlikely to respond by week-12 [32–34]. Decision curve analysis provides the right lens to determine whether model-guided actions improve outcomes over treat-all or treat-none strategies and justifies embedding risk thresholds into routine visits without specialised testing [35, 36].
Most predictive work in CSU highlights total IgE and autoimmune markers as risk signals for poor response, whereas CIndU evidence has been limited to smaller trials and series [18–22, 32, 33]. Our single-centre CIndU cohort study extends this literature by combining simple baseline indicators anchored in CSU evidence, validated, device-based provocation thresholds that allow harmonised severity measurement across ColdU (TempTest), SD/DPU (FricTest/dermographometer), CholU (pulse-controlled ergometry), and SolarU (action spectrum/MUD), and a dynamic early-update (∆UCT-7) that improves discrimination, calibration, and clinical utility. This design aligns with registries showing early control under omalizumab in CIndU and with guideline emphasis on standardised outcomes, while adding decision-analytic evaluation that has been largely absent from prior subtype-specific reports [16, 25, 26, 28–31, 34].
There are certain limitations of this study. The single-centre retrospective design may constrain generalisability to other settings and device protocols, off-label heterogeneity in omalizumab dosing/intervals (typically 150–300 mg; interval adjustments) and routine co-medications could introduce management variation not fully captured by our predictors, the observational design means residual confounding cannot be excluded even though our goal was prediction rather than causation. Missing predictor data were handled by multiple imputation, which assumes missing-at-random and may be violated in practice and while temporal and subtype analyses support internal transportability, external validation is still required. Future work should perform multicentre external validation across diverse climates, devices, and care pathways, undertake prospective impact analyses to test whether model-guided early escalation/switch improves outcomes and resource use, embed the points-based score into EHR calculators with automated data pulls for real-time risk estimates, and explore bio-marker extensions assessed strictly for incremental value over the simple baseline + week-4 framework to preserve usability and cost-effectiveness.
In this study, we developed and internally validated a pragmatic prediction approach that uses only routine information at the point of care, which offers a low-cost, implementable path to personalise omalizumab use in CIndU and to streamline treat-to-target care, while highlighting clear next steps for external validation and prospective impact evaluation.