Introduction
Smoking is considered to be a risk factor for tuberculosis, among other diseases [1, 2], which increases with consumption [3]. An immune response in the lungs is induced by cigarette smoke, recruiting inflammatory cells such as macrophages and T (CD8*) lymphocytes. Macrophages are the main defence cells in nonsmokers; bronchoalveolar aspiration in smokers (when compared with nonsmokers) shows a fivefold increase in the number of inflammatory cells in the lungs, with 85–90% being macrophages [4].
A few studies have evaluated the impact of biomass smoke as a risk factor for tuberculosis. Either occupational or house environment contaminations due to cooking with solid fuels (wood or charcoal) are responsible for respiratory diseases in children and adults [5]. High levels of gaseous compounds and solid particle concentrations within the breathable size range are present in this type of smoke; these compounds are thought to be more harmful to humans [6].
An association between alcohol intake and tuberculosis has also been found; namely, that heavy drinkers have more tuberculosis relapses [7], a worse prognosis, and a higher probability of suffering more destructive forms of tuberculosis [8, 9]. Immunoregulation impairment, involving cytokines, caused by alcohol intake is one of the main risk factors for tuberculosis as well as other pathologies that develop from immunodeficiency, making individuals vulnerable to infectious agents in different tissues [10, 11].
Recently, tumor necrosis factor α (TNF-α) has been associated with heavy alcohol intake [12]. An increased production of cytokines by blood monocytes and Kupffer cells in alcoholic steatosis patients and in animal models with alcohol-induced liver damage has been shown [13–15]. Additionally, excessive TNF-α production depends on the amount of alcohol ingested [16].
In addition to wood smoke, cigarette, and alcohol exposure, genetic factors can alter interindividual cytokine levels [3]. Two polymorphisms in the promoter region of the TNF gene affect its expression: a negative gene regulation that diminishes TNF-α production is caused by the TNF –238G/A polymorphism [17], and an increase in production up to fivefold the basal level is caused by the TNF –308G/A polymorphism [18]. Both polymorphisms have been identified as risk factors for different non-infectious and infectious diseases, including tuberculosis [19–21]. However, the results remain inconsistent and contradictory [22, 23]. The TNF –308AA genotype has been associated with the highest risk for mild airway diseases that could eventually progress to pulmonary obstructive disease [24]. The –308A allele has also been associated with pulmonary disease susceptibility due to cigarette smoke [25]. The aim of this study was to determine the association between TNF polymorphisms and tuberculosis in the presence of biomass smoke, cigarettes, and alcohol.
Material and methods
Study design and subjects
We studied 118 tuberculosis patients and 223 inhome controls. Blood samples from all participants were taken at the National Institute of Respiratory Diseases, Mexico City. The controls were in-home contacts of the patients, all healthy individuals without a previous tuberculosis history, and they were enrolled at the same time as the patients. All cases were microbiologically confirmed according to World Health Organisation guidelines.
DNA was extracted from frozen blood using the salting out procedure without phenol extraction [26]. Briefly, red cells were lysed with Tris-Triton-Sucrose buffer (TTS), then the DNA was extracted from lymphocytes with 5 mM NaCl, 1% sodium dodecyl sulphate (SDS), and saturated NaCl followed by deproteinisation with chloroform : isoamyl alcohol 24 : 1 and precipitation with absolute ethanol. Finally, DNA was dried out and resuspended in sterile water.
Demographic data on the participants were collected through interviews with professional personnel. The information collected included ethnicity, gender, age, biomass combustion exposure (fumes and asbestos for occupational smoke; wood or charcoal for in-home smoke), cigarettes, and alcohol intake. By analysing cooking habits, we classified between modern nonsolid (gas, electricity) and solid fuels (charcoal, wood). Subjects, who had cooked with charcoal or wood and worked with direct exposure to fumes and dust (asbestos) for the year prior to this study were classified as positive for biomass smoke exposure. Subjects with at least a 20-cigarette intake within the last 30 days or one cigarette per month for the last year were classified as smokers. There are questionnaires that consider positive alcohol consumption as the intake of 16 g a day [27] or 25 g per week [11]. However, we defined regular drinkers as those who drank 20 to 40 g per day. Informed consent was signed by all the subjects.
This study was approved by the Institutional Science and Bioethics Committee, code E-05-06.
Genotyping
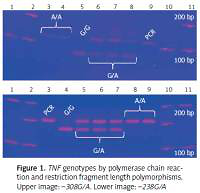
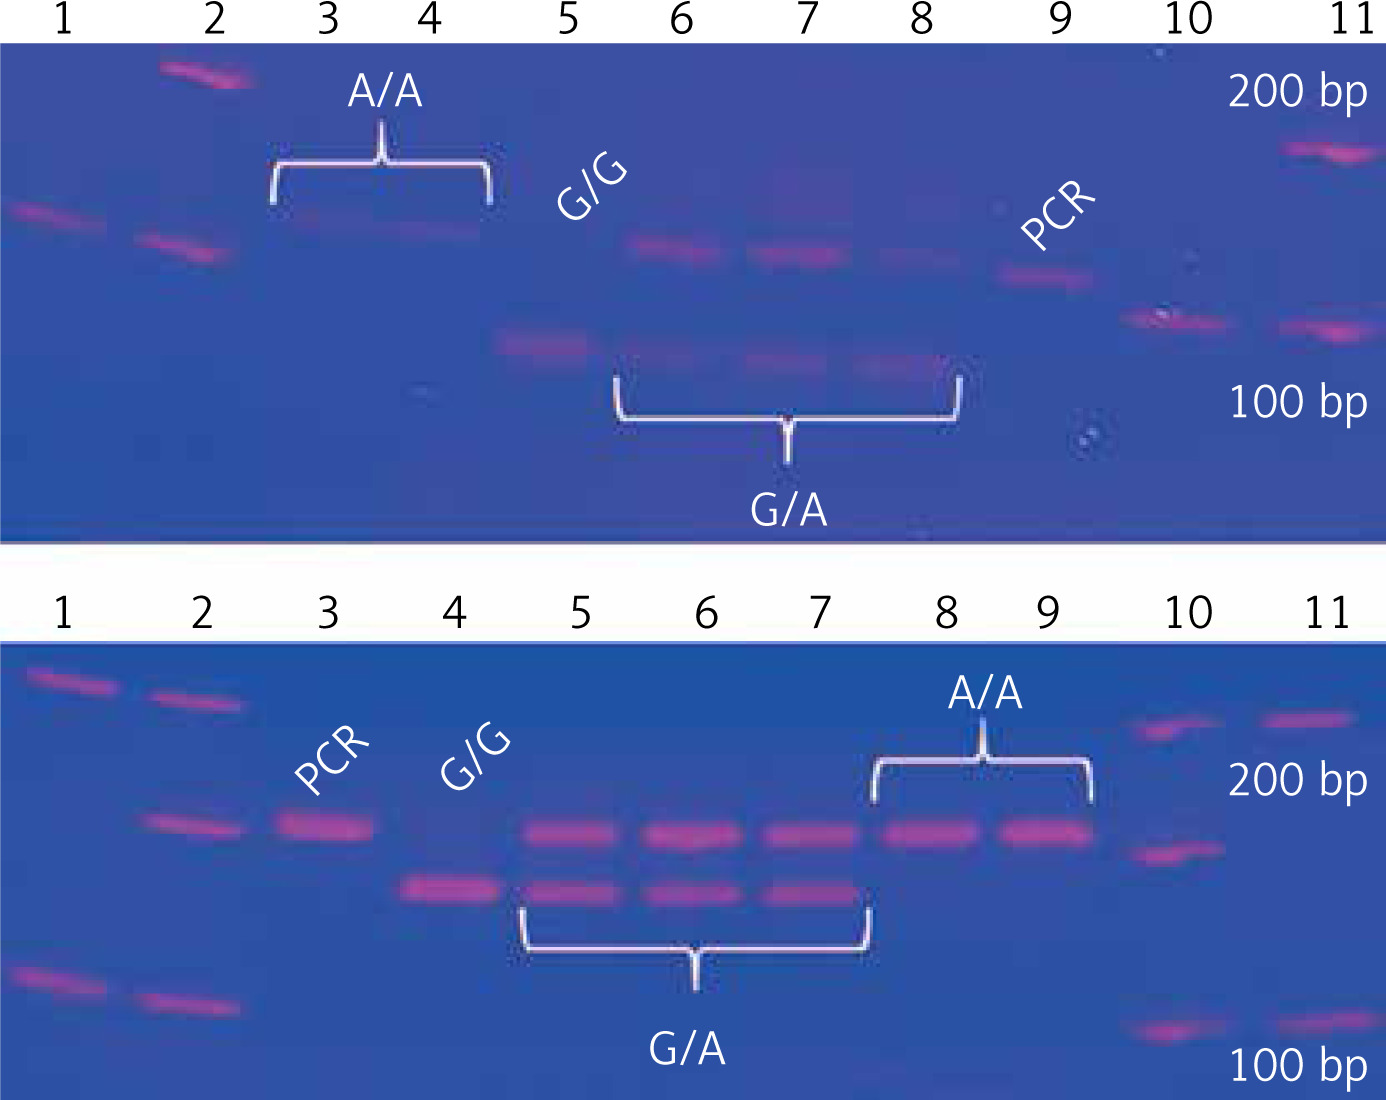
Two TNF gene polymorphisms, previously associated with tuberculosis in European, Mexican American, Hispanic, and Latino populations, were selected [19, 28–31]. TNF –308G/A and –238G/A gene polymorphisms were genotyped by polymerase chain reaction and restriction fragment length polymorphisms (PCR-RFLP) [32]. The –308G/A homozygous AA genotype is identified by a 107 bp fragment, the GG genotype has a combination of 87 and 20 bp bands, and the heterozygous GA has three bands (107, 87, 20 bp). The –238 AA polymorphic genotype is identified by a 152 bp fragment, the GG wild type has two bands (133, 19 bp), and the heterozygous GA has three fragments. Genotypes were confirmed by Sanger sequencing with an ABI Prism 3130 genetic analyser and ABI Prism BigDye Terminator® v3.1 (Applied Biosystems, USA); each genotype was confirmed twice in a bidirectional way by PCR (Figure 1).
Statistical analysis
Calculated genotypic and allelic frequencies for both TNF polymorphisms in tuberculosis patients and controls were compared and the odds ratio (OR) between polymorphisms was evaluated. We also determined the possible gene-environment interaction between TNF polymorphisms and the exposure factors (biomass smoke, cigarettes, and alcohol). A univariate, bivariate, stratified analysis was performed, and using the χ2 test we calculated p-values in a case-control study design, allowing for the evaluation of the possible association between TNF polymorphisms and pulmonary tuberculosis susceptibility. Haplotype analysis with both TNF polymorphisms was also carried out. All the information gathered from each patient by SPSS version 20.0 (IBM, USA) software was stored in a database.
Results
We studied 118 patients with confirmed pulmonary tuberculosis (PTB) and 223 confirmed healthy controls (TC). One hundred and forty consanguineous contacts (CC) and 83 nonconsanguineous contacts (NCC) comprised the control group. All groups were in Hardy-Weinberg’s equilibrium (p > 0.05). Genotypic and allelic frequencies for both polymorphisms for each group were calculated. Significant differences were found for the TNF –308GA genotype (OR = 0.35, 95% CI: 0.13–0.93, p = 0.03) and the –308A allele (OR = 0.37, 95% CI: 0.14–0.95, p = 0.04) between nonconsanguineous carriers and tuberculosis patients. No association for the TNF –238G/A polymorphism was found. The results are shown in Table I.
Table I
Genotypic and allelic frequencies for the TNF –308G/A polymorphism (A), TNF –238G/A polymorphism (B)
A
| Genotype/allele | PTB N = 114, n (%) | CC N = 140, n (%) | NCC N = 83, n (%) | TC N = 223, n (%) |
|---|---|---|---|---|
| GG | 107 (93.86) | 128 (91.43) | 70 (84.34) | 198 (88.79) |
| GA | 7 (6.14) | 11 (7.86) | 13 (15.66)* | 24 (10.76) |
| AA | 0 | 1 (0.71) | 0 | 1 (0.45) |
| G | 221 (96.93) | 267 (95.36) | 153 (92.17) | 420 (94.17) |
| A | 7 (3.07) | 13 (4.64) | 13 (7.83)§ | 26 (5.83) |
Regarding the exposures studied, the median number of years of smoking was 17 (15–19.5), occupational exposure to fumes was 10 years (3–21), stove use in years was 18 (10–30), and alcohol intake time was also 18 years (10–25). Comparisons of PTB with CC, NC, and TC are shown in Table II. Significant p-values with risk OR for occupational biomass smoke exposure between patients, consanguineous controls, and total controls were obtained; in-home biomass smoke exposure had no association.
Table II
Comparison of exposure factors between the different control groups and tuberculosis patients
No association for the –238G/A polymorphism between patients and controls exposed to biomass smoke (occupational/in-home), cigarettes, and alcohol intake was found. In contrast, the statistical analysis results for the TNF –308G/A variant showed significant differences for the –308A allele carriers (GA and AA genotypes) with protective OR between patients and controls without exposure to biomass smoke (occupational/in-home) and without alcohol intake. In regard to cigarette intake, an association was found only between patients and nonconsanguineous controls (OR = 0.24, 95% CI: 0.06–0.92, p = 0.02) (Table III).
Table III
A – Genotype frequencies of the TNF –308G/A polymorphism without exposure to the environmental factors. B – Genotype frequencies of the TNF –238G/A polymorphism with exposure to the environmental factors. Comparisons were made between tuberculosis patients and each control group
A
| Exposure factor | Genotype | TBP | CC | NCC | TC |
|---|---|---|---|---|---|
| Occupational biomass smoke | n = 45 | n = 76 | n = 42 | n = 118 | |
| GG, n (%) | 44 (97.8) | 69 (90.8) | 34 (81) | 103 (87.3) | |
| GA, n (%) | 1 (2.2) | 6 (7.9) | 8 (19) | 14 (11.9)§ | |
| AA, n (%) | 0 | 1 (1.3) | 0 | 1 (0.8) | |
| In-home biomass smoke | n = 55 | n = 79 | n = 39 | n = 118 | |
| GG, n (%) | 54 (98.2) | 72 (91.1) | 32 (82.1) | 104 (88.1) | |
| GA, n (%) | 1 (1.8) | 6 (7.6) | 7 (17.9) | 13 (11)¥ | |
| AA, n (%) | 0 | 1 (1.3) | 0 | 1 (0.9) | |
| Cigarette intake | n = 98 | n = 106 | n = 60 | n = 166 | |
| GG, n (%) | 94 (95.9) | 98 (92.5) | 51 (85) | 149 (89.8) | |
| GA, n (%) | 4 (4.1) | 7 (6.6) | 9 (15)* | 16 (9.6) | |
| AA, n (%) | 0 | 1 (0.9) | 0 | 1 (0.6) | |
| Alcohol intake | n = 95 | n = 99 | n = 57 | n = 156 | |
| GG, n (%) | 92 (96.8) | 90 (90.9) | 47 (82.5) | 137 (87.8) | |
| GA, n (%) | 3 (3.2) | 8 (8.1) | 10 (17.5) | 18 (11.6)† | |
| AA, n (%) | 0 | 1 (1) | 0 | 1 (0.6) |
B
Of the four possible haplotypes (GG, AG, GA, AA) originated by the TNF polymorphisms (–308G/A, –238G/A), only the AG polymorphism had a significant association between patients and nonconsanguineous controls without exposure to the environmental factors studied here. The OR values obtained were of protection (Table IV). The analyses with haplotypes GG and GA are shown in the supplementary material (Tables V and VI); no analysis was done with the AA haplotype because it only had an n = 2.
Table IV
TNF –308A/–238G haplotype associations between groups and exposure factors
Table V
TNF –308G/–238G haplotype associations between groups and exposure factors
Table VI
TNF –308G/–238A haplotype associations between groups and exposure factors
Validation
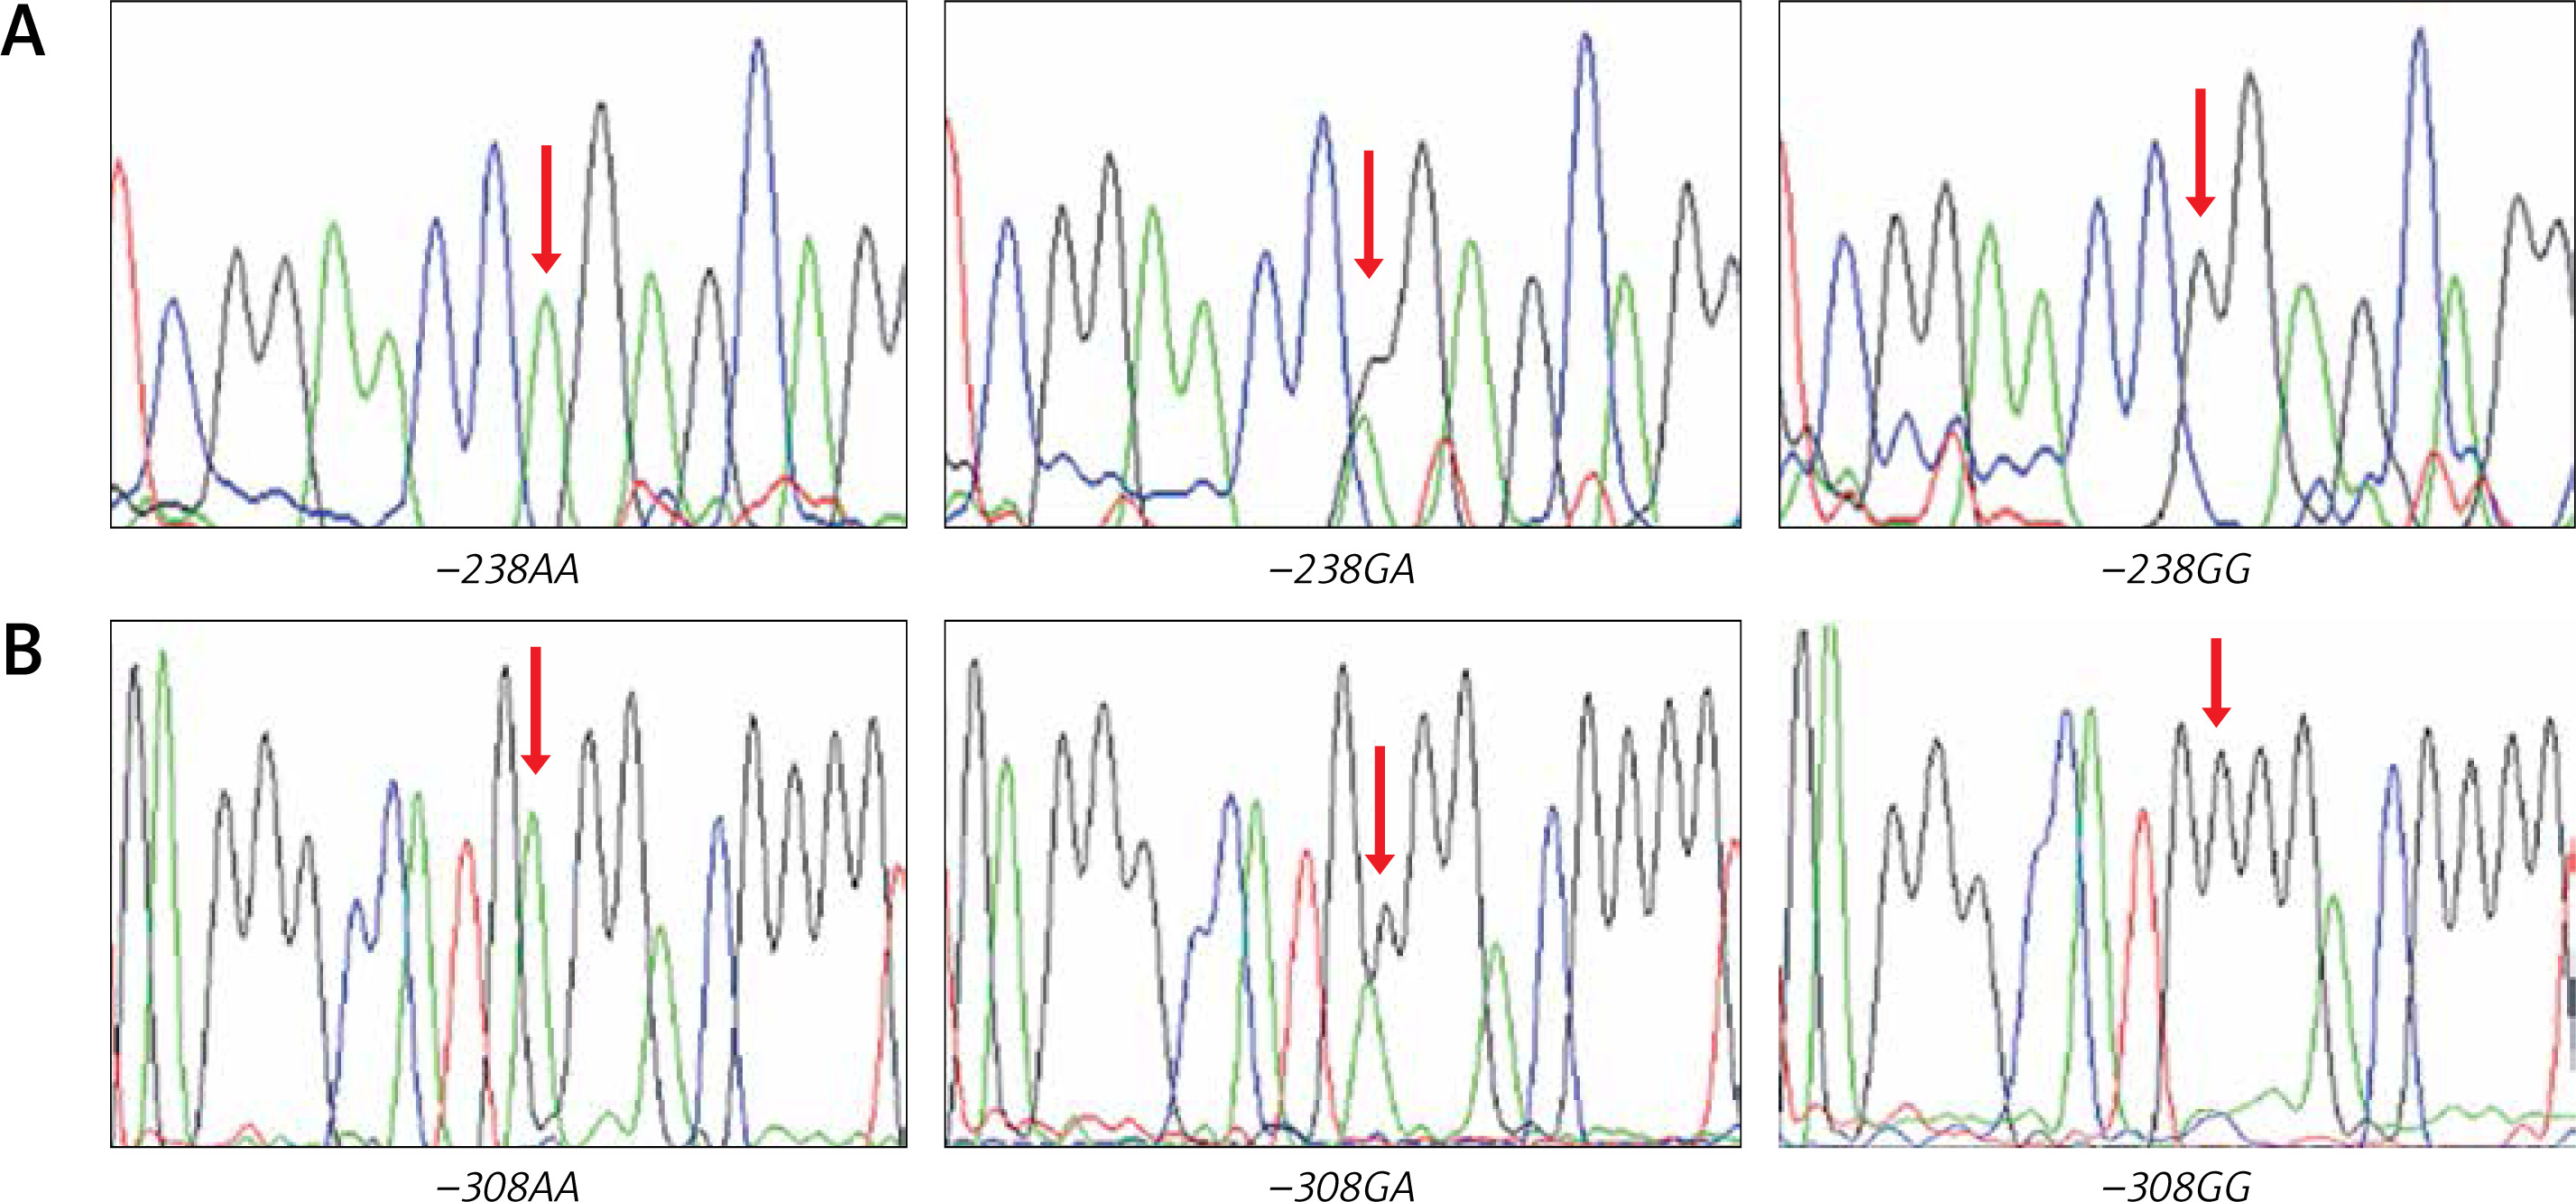
Randomly chosen samples (n = 12) for each genotype were validated by duplicated Sanger sequencing from PCR products, using Big Dye™ terminator v3.1 (Applied Biosystems), sequencing reactions were purified with Sephadex G50® (Sigma-Aldrich) and highly deionised Formamide (Hi-Di)™ (Applied Biosystems). Samples were analysed in an AB3130 Applied Biosystems genetic analyser (Figure 2).
Discussion
We found that the presence of the TNF –308A allele is associated with tuberculosis (OR = 0.37, 95% CI: 0.14–0.95, p = 0.04) in our Mexican sample. The same behaviour was observed (protective OR) with the –308GA genotype carriers without exposure to biomass smoke, cigarettes, and alcohol. On the other hand, the –308A/–238G haplotype was also found to be a protective factor against tuberculosis in individuals not exposed to the environmental factors. These results are similar to previous findings that determined that the –308A/–238G haplotype gives protection against tuberculosis in Colombians [29]. Another study of a Greek population found that haplotypes other than GG have a protective effect against the development of sepsis [33]. This could be a result of the fact that every population may have favourable and unfavourable combinations of gene polymorphisms [34] and, in consequence, haplotypes. However, in our population, such protection is lost when exposed to biomass smoke, cigarettes, and alcohol. The explanation for this possibly involves several factors. Biomass smoke, cigarettes, and alcohol impair both the innate and adaptive pulmonary immune response, increasing an individual’s susceptibility to infection by Mycobacterium tuberculosis and subsequent progression to active tuberculosis [4, 35, 36]. Biofuel combustion generates compounds such as cytotoxic polycyclic aromatic hydrocarbons, which increase the secretion of proinflammatory cytokines, such as IL-1β and TNF-α, by alveolar macrophages and pneumocytes. This secretion results in the inability to mount an efficient immune response against infections [37–39], as has been reported in Mexican, Canadian, and Chinese populations [40–42], despite these populations being very different from one other. This may suggest a common mechanism associated with an increased risk of pulmonary tuberculosis. On the other hand, the TNF –308A allele increases expression up to fivefold from its basal levels [43], which favours granuloma formation [44]. The immune response against tuberculosis is mediated by T lymphocytes, whose main function is the activation of macrophages and other cells [45]. Exposure to one or more of these factors (TNF polymorphisms, mycobacteria, alcohol, biomass, cigarette smoke) stimulates TNF-α production by T lymphocytes, which quickly causes macrophage, granulocyte, and cytolytic T lymphocyte activation and maturation, as well as T lymphocyte proliferation. Thus, a positive feedback loop is established, which promotes granuloma formation and maintenance by recruiting macrophages and lymphocytes to the infection site to contain the mycobacteria [46]. This mechanism could explain the possible protective behaviour observed, and we observe that this correlates with our findings because the association is suppressed by exposure to environmental factors.
On the other hand, similar frequencies for the TNF –308G/A polymorphism to the ones we report in this study have been found in Iran [29, 47], Macedonia [48], and Colombia [29]. Merza et al. [47] found an association between this polymorphism and tuberculosis. However, it was with the –308A allele as a risk factor, the other studies did not find any association. This seemingly paradoxical finding needs to be explained in the light of existing literature regarding tuberculosis and TNF polymorphisms.
The genetic structure of the Mexican Mestizo population consists of three primary sources: Amerindians, Caucasians, and Africans [49]. This unique admixture, when compared with other populations, may have some influence on the frequency of the polymorphisms, causing the discrepancy or coincidence observed in our results with respect to other researchers. Supporting this theory, a 2012 meta-analysis involving 18 studies [50] regarding the TNF –308G/A polymorphism and tuberculosis susceptibility revealed that the –308A allele was had a significant risk among Asians, but not in Caucasians, who have an important contribution to the genetic component of the Mexican mestizos.
It has been widely validated that TNF-α inhibitors are drugs that can be used to treat inflammatory conditions successfully, such as rheumatoid arthritis (RA), juvenile arthritis, psoriatic arthritis, inflammatory bowel disease, and psoriasis, among others. These drugs reduce inflammation and stop disease progression by targeting the inflammation-causing TNF-α. However, a major concern is that patients receiving this therapy have an increased risk of bacterial infection, particularly TB reactivation/infection, which interferes with innate immune responses, such as phagosome maturation and apoptosis through complement-mediated cytotoxicity [51]. It is important to clarify that in our study none of the patients or controls had any indications for anti-TNF-α treatment. Our work has the advantage of the available demographic data, which was collected based on a validated questionnaire that is one of the most complete used for respiratory disease epidemiology [52, 53]. Additionally, validation of our technique makes the exposure measurement (polymorphisms) trustworthy. However, biomass smoke exposure levels could not be quantified with adequate equipment, nor were tobacco or alcohol confirmed by lab tests. The only way this information was obtained was through the validated questionnaire, so this could be a limiting factor for our study, which could diminish the precision of these variables due to possible memory bias from interviewed patients. Even though our work is one of the few with a large number of patients analysed, future studies will require even larger sample sizes to conclusively determine the influence of the TNF polymorphisms on tuberculosis in the presence of biomass smoke, cigarettes, and alcohol.
In conclusion, the results indicate that the TNF −308A allele and the –308A/–238G haplotype are associated with tuberculosis and exposure to biomass smoke, cigarettes, and alcohol. However, no association for the –238G/A polymorphism was found. Our results provide insight into a possible protective role of TNF polymorphisms in tuberculosis in our population.