Introduction
Coronary heart disease (CHD) is a vascular stenosis caused by coronary atherosclerosis, followed by myocardial ischemia and hypoxia. It results in degeneration and necrosis of cardiomyocytes, and a significant decrease in cardiac pump function [1]. Coronary CT angiography (CTA) can be used to evaluate the degree of vascular stenosis preoperatively, and CTA coronary artery calcium score (CACS) is one of the most important indicators, and also one of the crucial bases for diagnostic imaging of CHD. Its level has potential value in terms of evaluating the disease condition. According to El Khoudary et al. [2], through imaging, higher CACS was directly associated with coronary artery adverse events. However, limited studies are available based on CACS and its related factors in recent years. Earlier studies have found that abnormal expression of inflammatory factors and oxidative stress related indicators are linked to formation of atherosclerotic plaque, which could accelerate the formation and progression of the lesion [3]. Interleukin (IL)-6 and IL-12 are proinflammatory cytokines, which not only participate in the formation of inflammation and macrophage response, but also mediate local lipid metabolism disturbance and oxidative stress [4]. Superoxide dismutase (SOD) is one of the important indicators of oxidative stress and an activator of the interleukin family and is involved in the regulation of mRNA.
Investigators have focused on the regulatory role of micro-RNA (miRNA) in recent years. MiRNA, as an endogenous non-coding small molecule RNA, with an average length of 18 to 24 nucleotides, can regulate the stress response, redox process and inflammatory factors, especially in the repair process of macrophage damage after phagocytosis of lipids. Different miRNAs play different roles in the formation and secondary changes of atheromatous plaques. On the basis of the relevant reports of CHD, investigators screened inflammatory injury-associated factors and oxidative stress markers in the TCGA database for clinical research (access date: Aug 2nd, 2019 at http://www.tcga.org/), and micro-RNA-497-5p (miR-497-5p) was selected. Based on the abovementioned background, the current study examined the expression of serum IL-6, IL-12, SOD and miR-497-5p in patients with CHD with an attempt to analyze their association with CACS and disease severity, and explored the potential significance and new biomarkers for clinical practice.
Material and methods
Participants
A total of 81 patients with CHD who were admitted to our hospital between January 2017 and October 2019 were selected as the observation group. The procedures followed the ethical standards of the responsible committee on human experimentation (national and institutional) and the Helsinki Declaration of 1975, as revised in 2000. In order to be included in the current study, the following inclusion criteria should be met: 1) patients had precordial pain during fatigue or rest, and were examined by coronary angiography; 2) patients were diagnosed for the first time with CHD. Exclusion criteria were as follows: 1) patients were complicated with myocarditis and valvular heart disease; 2) patients with rheumatic disease; 3) patients with malignant tumor; 4) patients who quitted. There were 41 males and 40 females, aged 38 to 87 years, with an average age of 62 years. In addition, 81 adults without obvious organic diseases were selected as the control group to collect serum samples, including 41 males and 40 females, aged 36 to 70 years, with an average age of 52 years. The study was approved by the hospital ethics committee and all patients signed an informed consent form.
Detection of parameters
ELISA and SOD detection
After diagnosis, 3 ml of fasting venous blood was drawn routinely and serum was separated by centrifuge at 3000 rpm/min for 20 min. Serum IL-6 and IL-12 were detected by ELISA, and serum SOD was detected by the hydroxylamine oxidation method. All the procedures were performed by the same technician to reduce man-made error.
Real-time fluorescence quantitative PCR
The mature sequences of related miR-497-5p were obtained from the miR Base database (www.mirbase.org), and primers were designed (synthesized by Suzhou Ruiwin Biotechnology Co., Ltd.), with upstream: 5’-ATGCGACTTCGAATCGCCA-3’, and downstream: 5’-TGCGTGCAAAAAAGTCTATGGCAG-3’. Serum miR-497-5p was detected by real-time fluorescence quantitative PCR (qPCR). cDNA was synthesized by reverse transcription. The PCR was run for 1 cycle at 95°C for 6 min, 15 cycles at 95°C for 25 s, 64°C for 20 s, and 72°C for 20 s, and 35 cycles at 93°C for 25 s, 60°C for 35 s and 72°C for 20 s. The Ct value was recorded and the result was expressed as 2–ΔΔ Ct.
ΔΔCt = [Ct target gene (sample) – Ct GAPDH (sample)] – [Ct target gene (calibration sample) – Ct GAPDH (calibration sample)].
Evaluation method of CACS
Before coronary angiography, all patients underwent coronary CTA with a Siemens SOMATOM Definition dual-source CT machine, and the heart rate was controlled at 90/min, and the scan was complete in one time. The CACS of the left main coronary artery, left anterior descending coronary artery, left circumflex coronary artery and right coronary artery were calculated by the Agatston method, and the total CACS was calculated.
Statistical analysis
SPSS17.0 was used for data analysis. Quantitative data were expressed by mean ± standard deviation, and the t-test was used for comparison between two groups to analyze the variance (SNK method for pairwise comparison), and Spearman correlation analysis was utilized. A p-value < 0.05 represented a significant difference.
Results
Comparison of IL-6, IL-12, SOD and miR-497-5p levels between the control group and the observation group
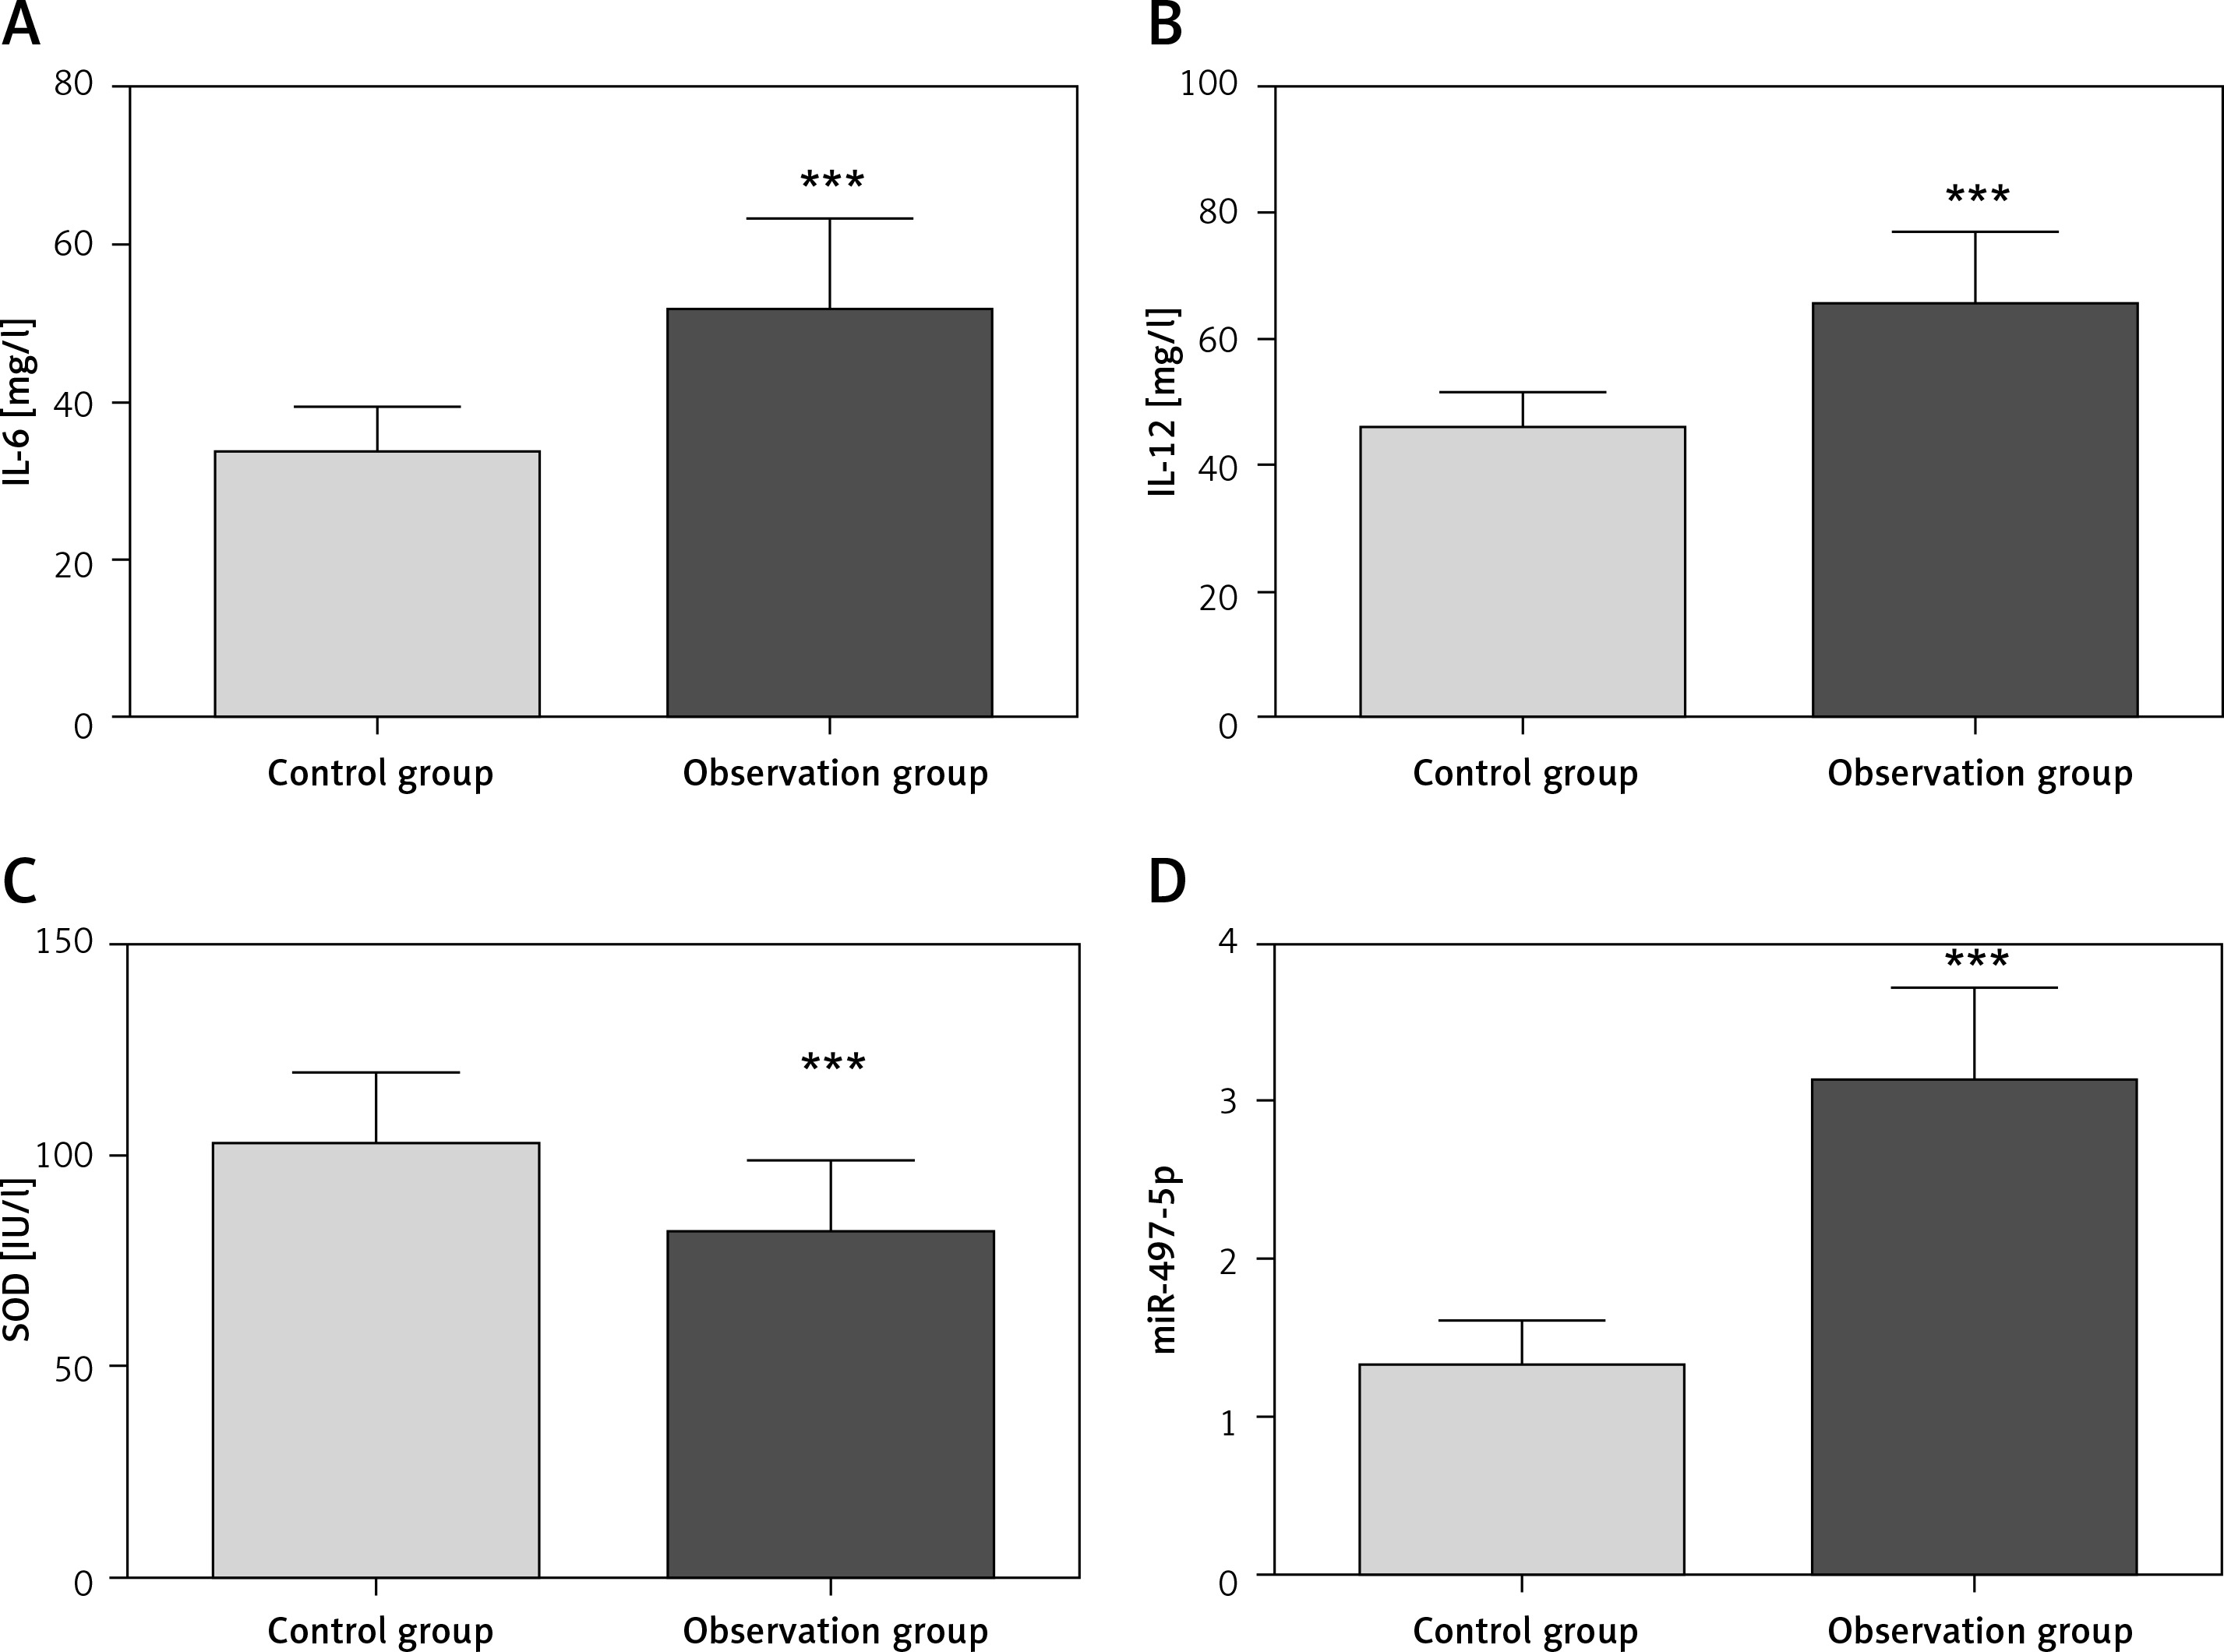
There was a significant difference in the levels of IL-6, IL-12 and SOD and the expression of miR-497-5p between the control group and the observation group (p < 0.05, Figure 1). Compared with the control group, the levels of IL-6 and IL-12 in the observation group were higher by 54.55% (p = 0.003) and 43.31% (p = 0.010), respectively, and the level of SOD was lower by 19.64% (p = 0.031). Notably, the expression level of miR-497-5p was significantly higher by 137.88% in the observation group (p = 0.002) compared to the control group.
Levels of IL-6, IL-12, SOD and miR-497-5p in lesions of different degrees
Patients in the observation group were divided into three groups according to the number of lesions: the one lesion group, the group with two lesions group and the group with three or more lesions. Significant differences were observed in the levels of serum IL-6, IL-12, SOD and miR-497-5p of patients with different numbers of lesions (p < 0.05, Table I). With the increase in the number of CHD lesions, the levels of IL-6 and IL-12 increased gradually while the level of SOD decreased gradually. In addition, the expression level of miR-497-5p was upregulated with increase in the number of CHD lesions.
Table I
Comparison of the expression of IL-6, IL-12, SOD and miR-497-5p in different lesion degrees in the observation group
Correlation analysis between CACS and serum IL-6, IL-12, SOD, and miR-497-5p in observation group
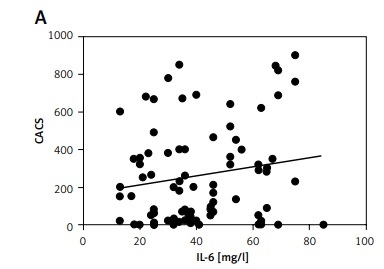
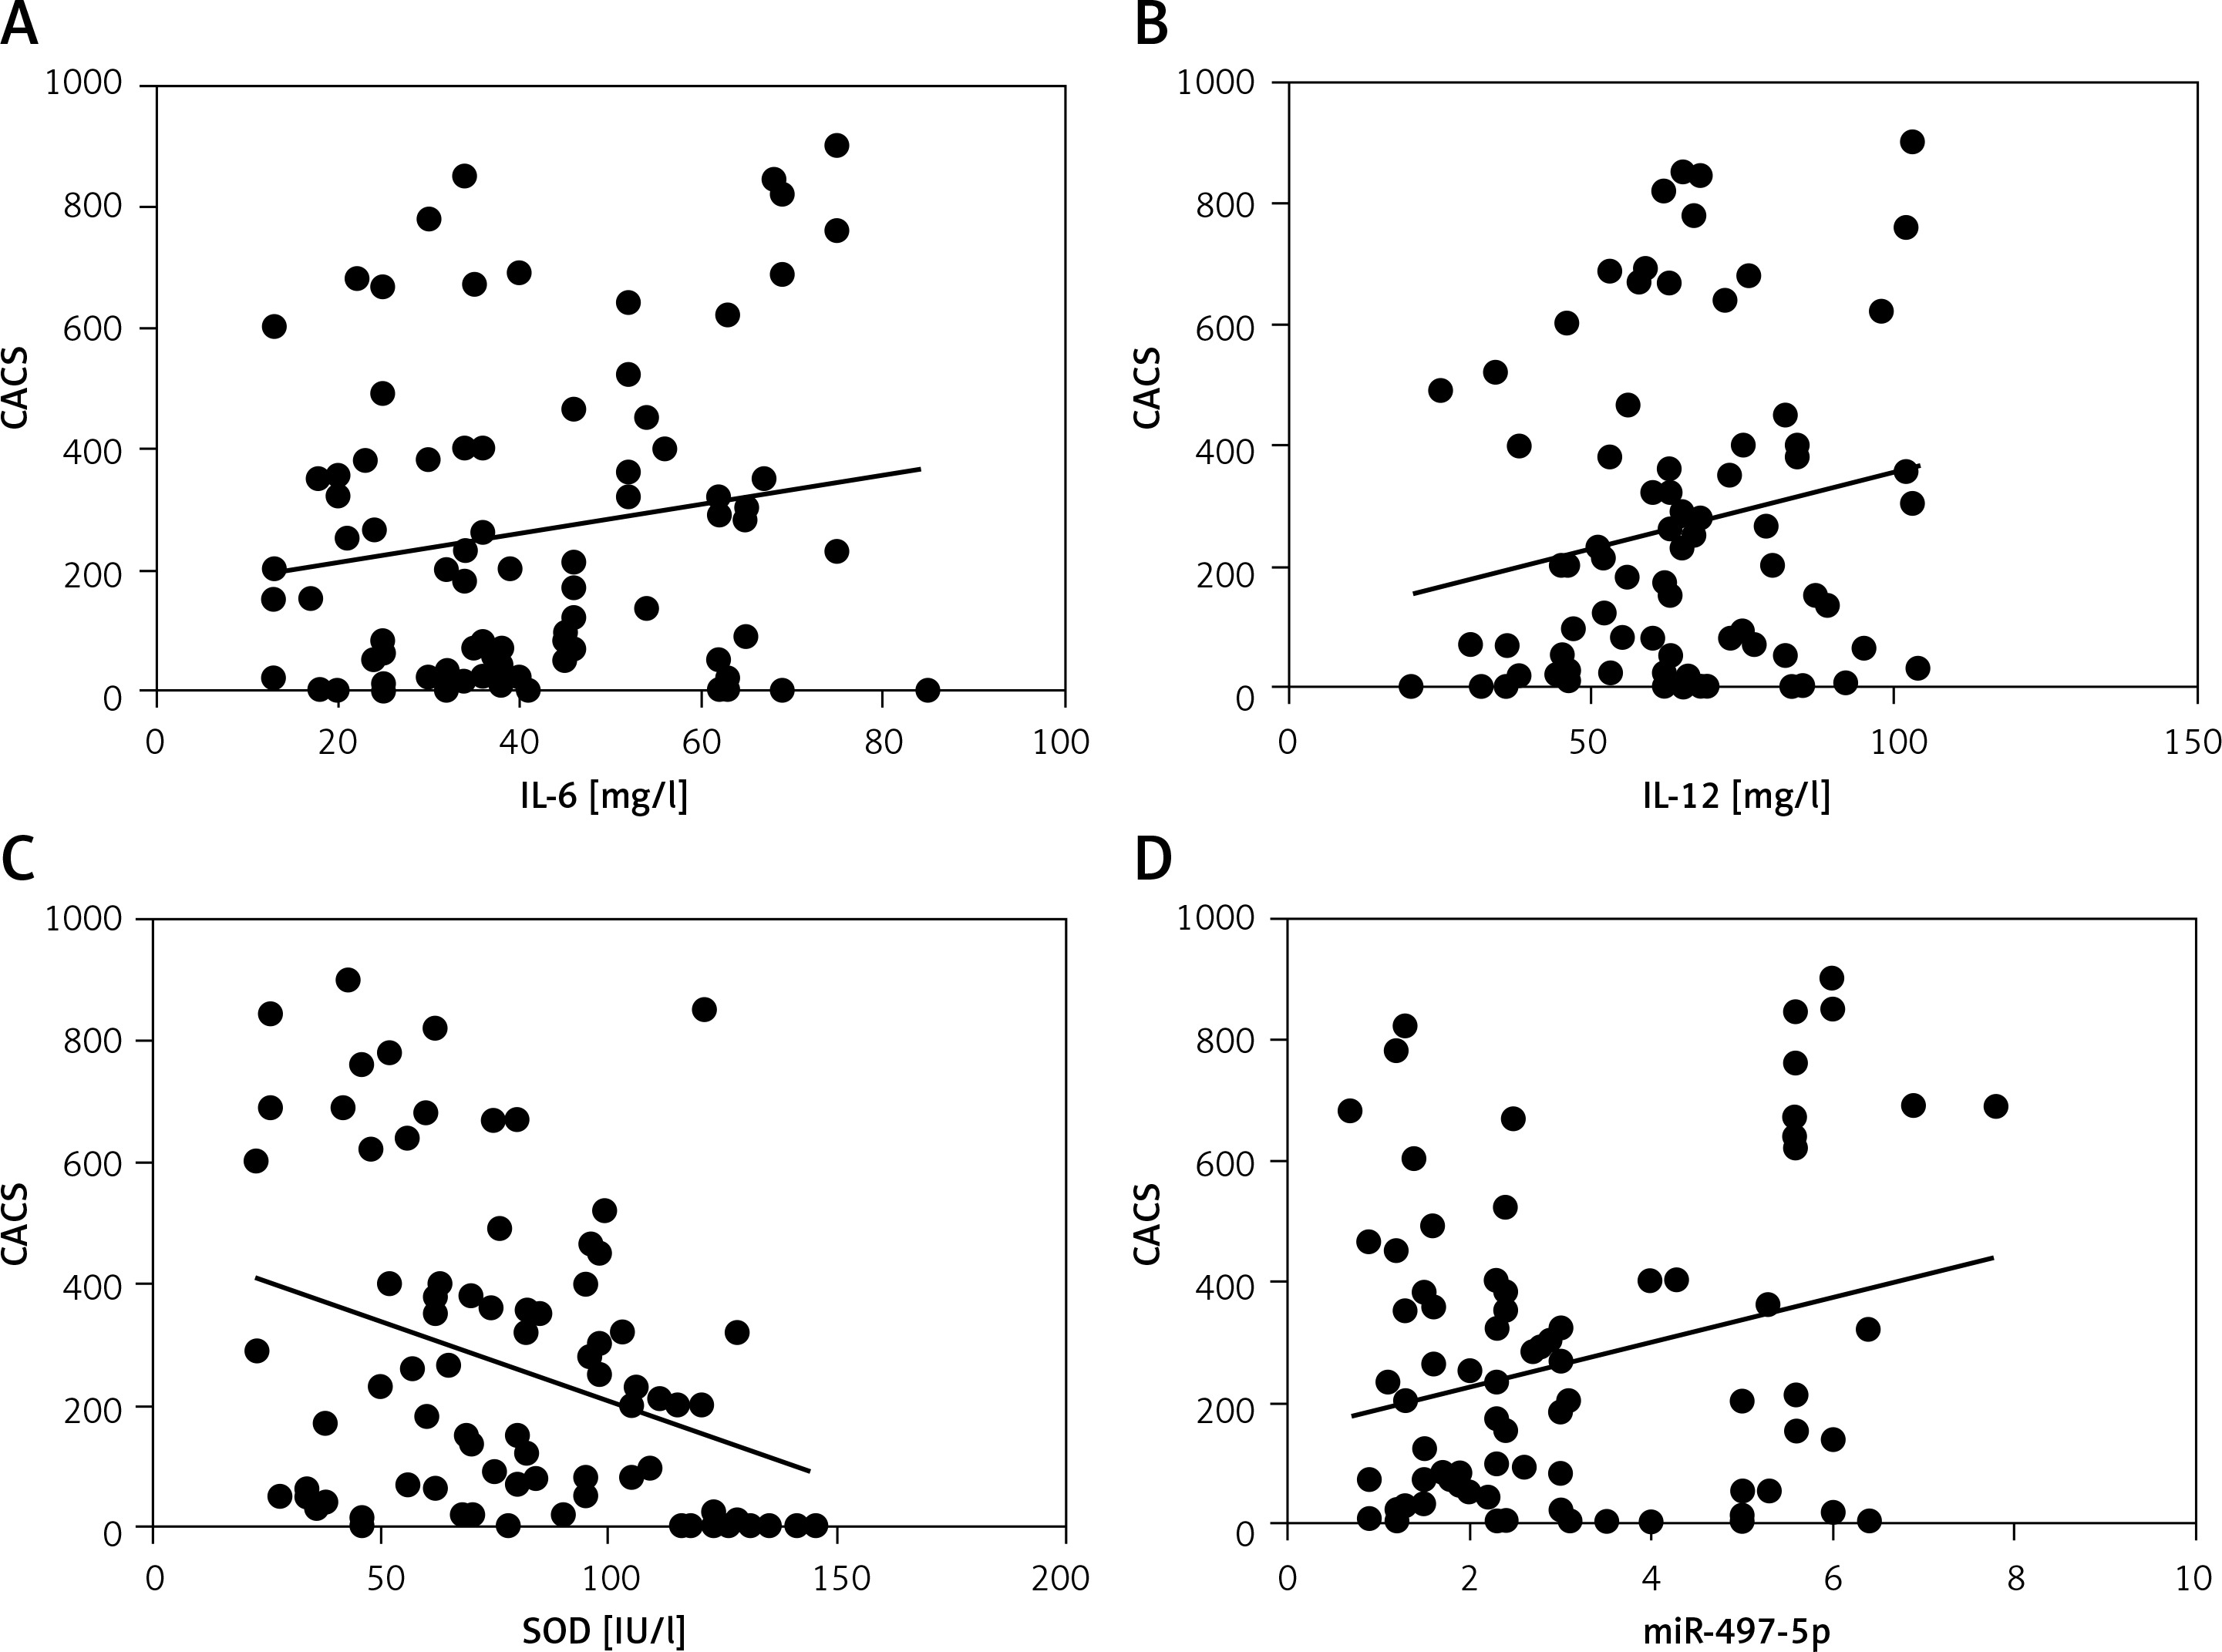
We explored the correlation between the CACS of patients in the observation group and various indicators in the serum. The range of CACS in the observation group was from 0 to 910. Spearman correlation analysis showed a positive correlation between CACS and IL-6 (r = 0.46, p = 0.032), CACS and IL-12 (r = 0.49, p = 0.012), and CACS and miR-497-5p (r = 0.48, p = 0.018), and a negative correlation between CACS and SOD (r = –0.55, p = 0.004) (Figure 2).
Discussion
The formation of coronary atherosclerotic plaques is a pathological process with the involvement of several factors, and abnormal lipid metabolism is a crucial factor in the formation of coronary atherosclerotic plaques [5]. Based on previous research in recent years, much attention has been focused on the involvement of inflammatory factors in abnormal lipid metabolism and plaque formation [6]. IL-6 and IL-12 are promoters of an inflammatory response, which can induce activation of phagocytes and inflammatory mediators [7]. IL-6 and IL-12 can regulate lipid metabolism and participate in the local oxidative stress of atherosclerotic plaques, and are highly associated with SOD [8]. It has been found that SOD is the target gene of miR-497-5p in the database of TCGA, TargetScan and RNA22. IL-6 and IL-12 are inflammatory factors; hence, the combination of the two factors and SOD were observed to be characteristics of local oxidative stress in atherosclerotic plaque.
Based on the above results, the expression levels of IL-6, IL-12 and miR-497-5p were upregulated while the expression of SOD was downregulated in patients with CHD, suggesting that abnormal expression of IL-6, IL-12, SOD and miR-497-5p was linked to the formation of CHD, which mainly regulates the formation of atherosclerotic plaques. The results showed that the expression of IL-6, IL-12, SOD and miR-497-5p was related to the severity of the lesion (Table I), indicating that abnormal expression of IL-6, IL-12, SOD and miR-497-5p was associated with lesion progression. In addition, there was a correlation between CACS and IL-6, IL-12, SOD and miR-497-5p, suggesting a synergistic trend between CACS and the expression of IL-6, IL-12, SOD and miR-497-5p, which linked CT with serum indexes. IL-6 and IL-12 are not only important proinflammatory mediators in the body, but are also involved in the regulation of lipid metabolism. According to earlier studies, IL-6 secreted by adipose tissue in the basal state accounts for 15% to 35% of the total circulation, and its mediation role in lipid aggregation is achieved by regulating MAPK phosphorylation [9]. IL-6 can promote the formation of local cholesterol crystallization and participate in regulation of the cytokine network. IL-12 is able to induce the aggregation of interstitial inflammatory cells, contribute to abnormal lipid metabolism, enhance the local inflammatory environment, and accelerate abnormal lipid metabolism [10]. Histopathology showed that the expression of IL-12 could be detected in atherosclerotic plaques, indicating that increased IL-12 expression is a morphological feature of lipid plaques [11]. MiR-497-5p is a non-coding small molecule RNA that regulates lipoprotein metabolism and plaque formation [12, 13]. When the body is under oxidative stress, biomolecules such as DNA, lipids, and proteins and cells such as macrophages are oxidized, resulting in an increase in oxidation products including MDA and carbonyl proteins, and the weakening of the protective effect of SOD on the body. Furthermore, injury-induced miR-497-5p secretion increases, weakens the deformability of neutrophils and macrophages, activates nuclear factors, regulates the release of inflammatory mediators, and results in imbalance between local oxidation and antioxidation. The regulation of lipids by miR-497-5p is attributed to the regulation of macrophages [12, 14]. The characteristics of serum IL-6, IL-12, SOD, and miR-497-5p expression may provide clinical reference for the diagnosis of CHD, but multicenter research with large samples is required to confirm its critical value. The results of this study may offer an alternative indicator for clinical screening.
In conclusion, the abnormal expression of serum IL-6, IL-12, SOD and miR-497-5p may be able to reveal the severity of the disease, and the combination with CACS is of potential value in terms of evaluating the condition of patients harboring CHD. Our results suggest that miR-497-5 may serve as a new diagnostic biomarker for CHD, and subsequent studies can explore its clinical significance.