Introduction
Rheumatoid arthritis (RA) is a chronic systemic inflammatory disorder that may affect many tissues and organs but principally attacks the joints, producing a nonsuppurative proliferative and inflammatory synovitis that often progresses to destruction of the articular cartilage and ankyloses of the joints. About 1% of the world’s population is afflicted by RA, women two to three times more than men [1]. Symptoms usually develop in small bones of the hands and feet followed by the wrists, ankles, elbows, and knees [2].
Deformities as a consequence of the inflammatory process in the proximal interphalangeal and metatarsophalangeal joints of the feet are often observed at the time of initial diagnosis, problems with foot pain being a common complaint [2]. Also, disturbances of postural stability in patients with RA are often observed [3].
Different factors influence the structure and function of the foot; one of them is body mass [4–6].
Obesity prevalence is rising in the early phase of RA and is associated with an increased Disease Activity Score in 28 joints (DAS28) and significantly reduces everyday activity of patients [7–11]. Patients with high body mass index (BMI) values have higher disease activity, a worse response to treatment, and more extensive disability [9, 11–14]. In women, obesity has been associated with higher risk of RA [8, 9].
The examination of a dependence between overweight and obesity and postural changes in the feet of RA patients seems to be a proper direction in the search for a preventive strategy and improvement of the quality of life of this population [15].
The aim of the study was to evaluate the degree of foot deformities and static disturbances in overweight patients with RA, in correlation with DAS28, BMI, the Foot Posture Index (FPI-6), and Health Assessment Quality (HAQ).
Material and methods
The examinations were carried out in the Department of Rehabilitation, the Department of Endocrinology, Diabetology and Internal Medicine of the Medical University of Bialystok. The research was approved by the Local Bioethical Commission of the Medical University of Bialystok.
The experimental group consisted of 50 overweight women (25 kg/m2 < BMI values < 30 kg/m2) with RA at the ages of 32–69 (the mean age was 57.46 ±9.56 years). Patients were divided into subgroups depending on radiological evaluation according to Steinbrocker’s classification and DAS28.
The duration of RA ranged between 2 and 21 years (mean 12.5 ±7.5 years). Treatment included methotrexate (MTX) 15–20 mg once a week and folic acid 15 mg once a week (given on the day after MTX administration).
Steroids and immunosuppressive drugs were not used during the 2 months prior to the study.
Fifty healthy overweight women (25 kg/m2 < BMI values < 30 kg/m2) participated in the study as a control group. Their age ranged from 31 to 61 years (the mean age was 42.20 ±8.34 years).
To evaluate the presence of static foot changes we applied a podoscope with spatial scanner and computer-aided foot examination software CQ ST2K (Poland).
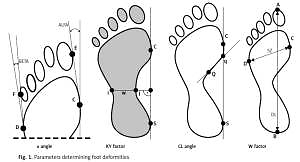
The following parameters, indicating foot deformity, were determined (Figure 1):
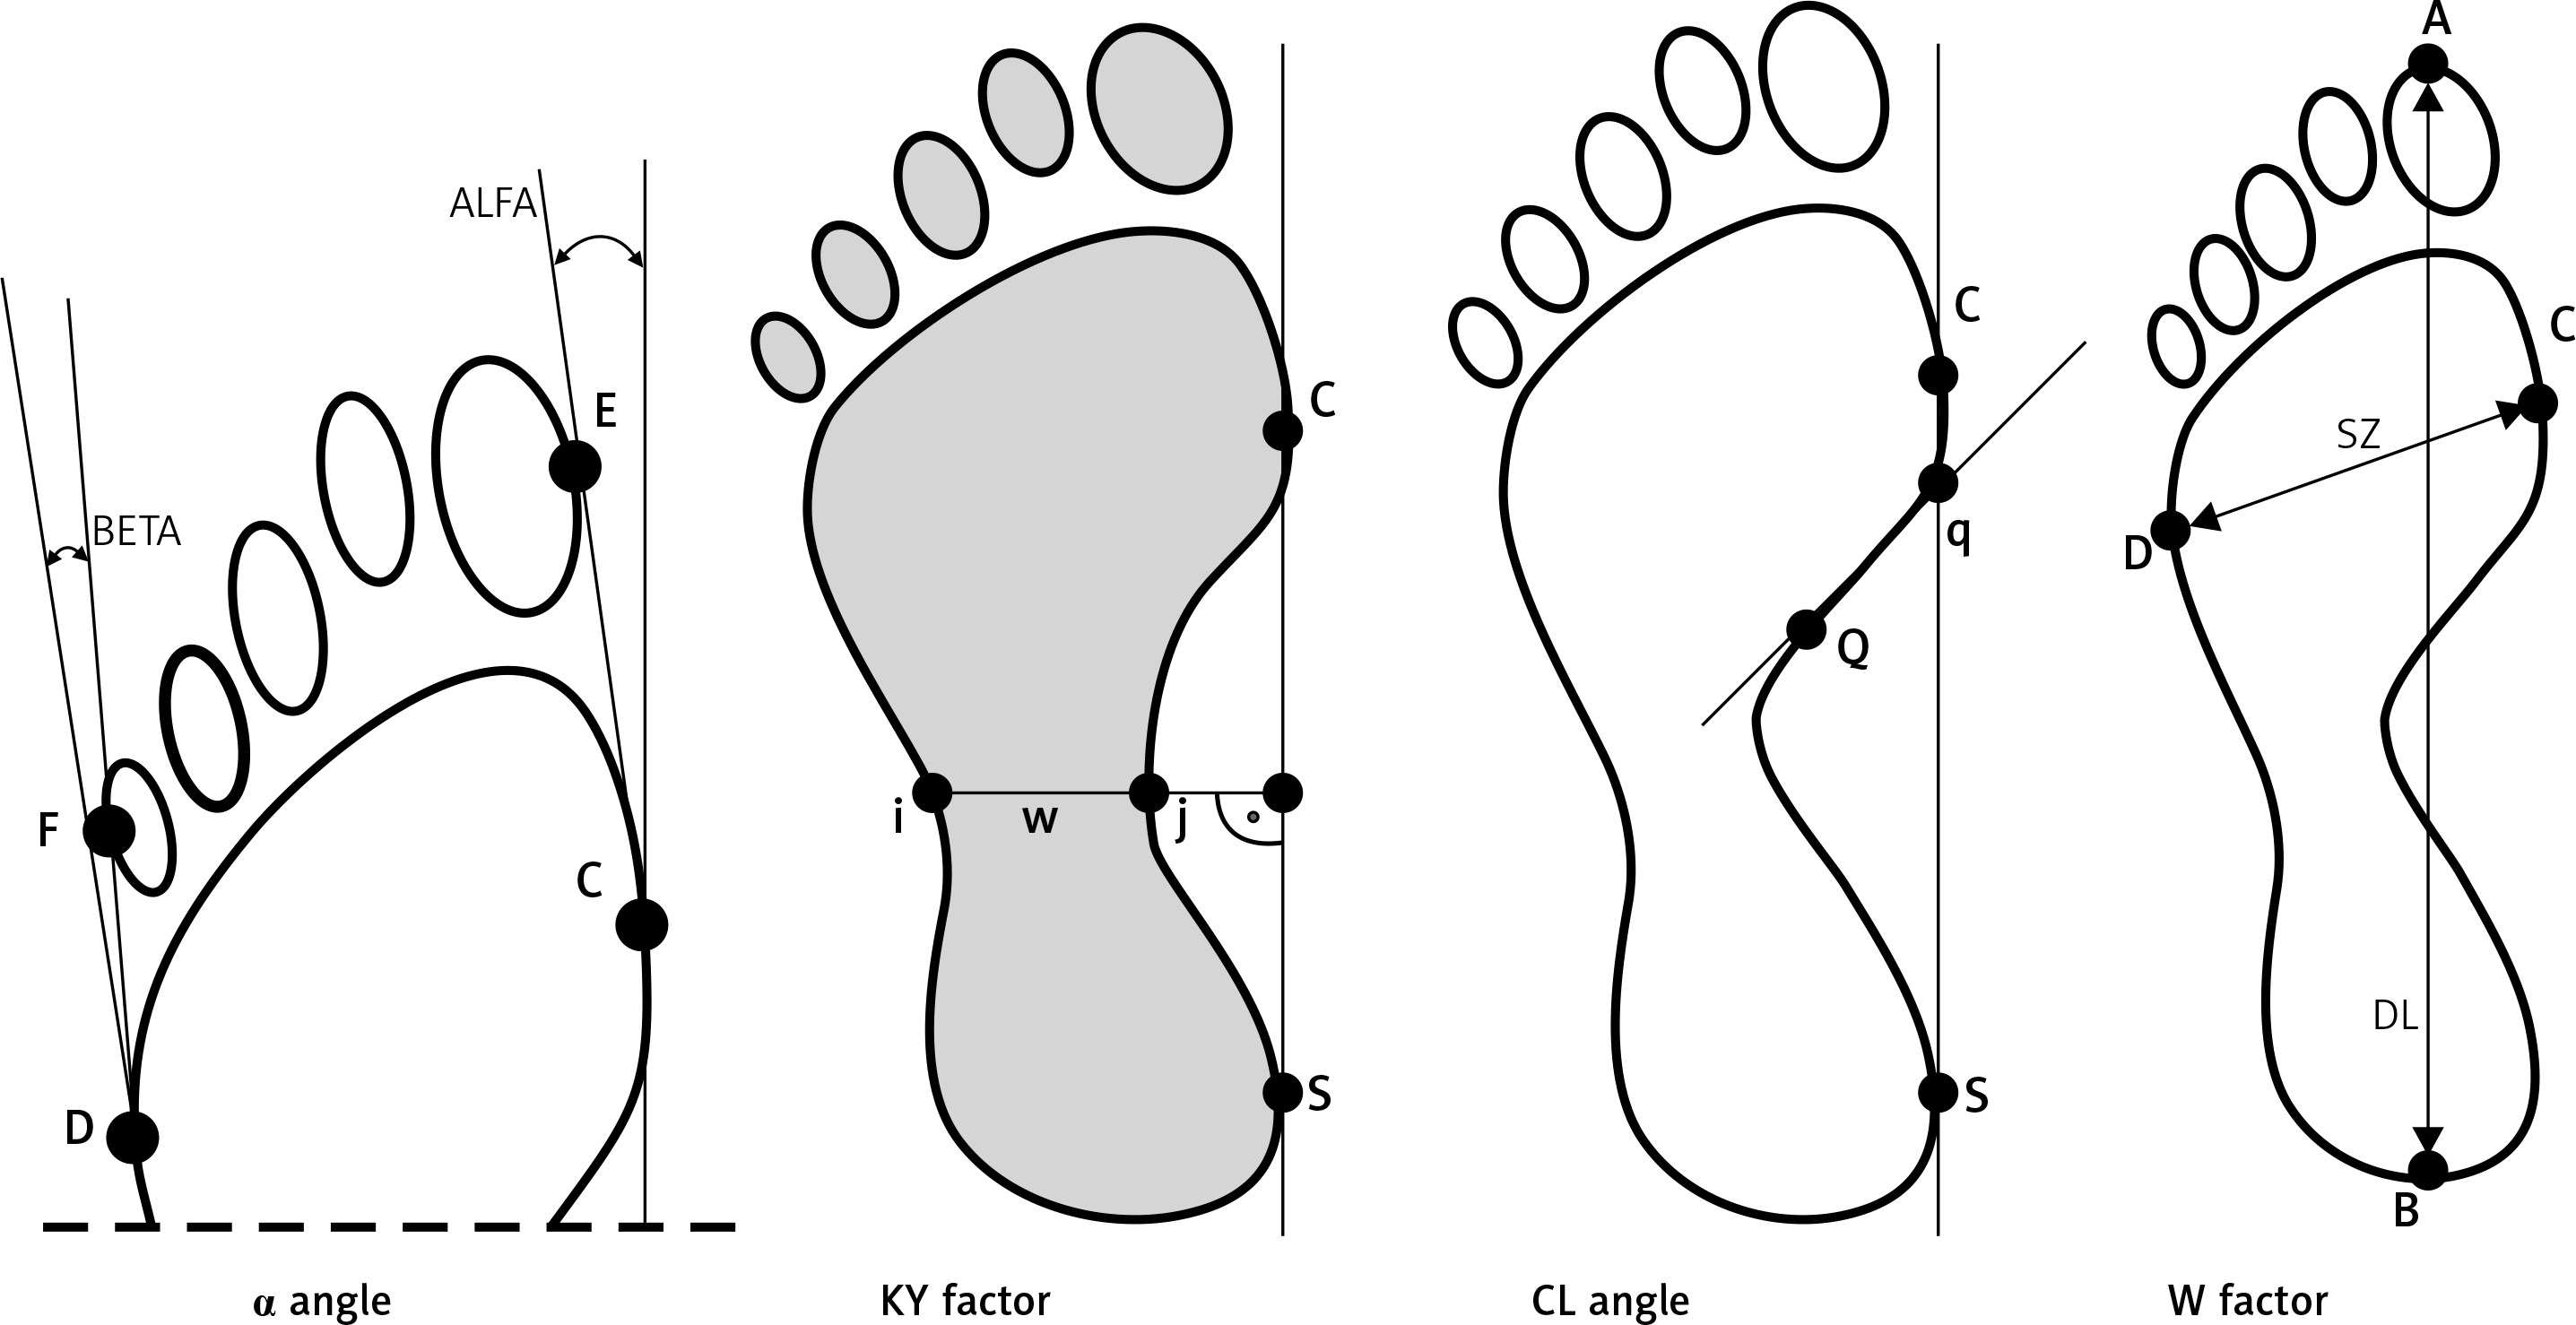
Hallux valgus angle (α) (the angle between a tangential line of the medial edge of the foot and a tangential line from the widest part of the forefoot to the outside edge of the hallux). The norm is 0–9°.
The Sztriter-Godunow factor (KY) represents the proportion of the length of the segment located in the foot arch centre (blackened area) and the length of the segment marked by the unblackened part of the plantar contourograph, [KY = (W – i)/(j – I)].
The Wejsflog index (W) estimates the proportion between the length and width of the foot. Its normal proportion is 3 : 1.
Clarke’s angle (CL) – measurement of this index involves marking a straight line that joins the most internal points of the forefoot and the rearfoot and internal line (Q-q). The interpretation of the value of Clarke’s angle: flat foot ≤ 30°, foot with a lower arch 31–41°, foot with a normal arch 42–54°, foot with a higher arch ≥ 55°.
Disease activity of RA was measured by the DAS28, and intensity of pain by the visual analogue scale (VAS).
The Foot Posture Index (FPI-6) is designated for foot posture evaluation based on palpation of the head of the talus, curvatures above and below the lateral malleolus, position of the calcaneus in the frontal plane, prominence in the talonavicular joint, the medial longitudinal arch’s congruence, and abduction/adduction of the forefoot on the rearfoot.
Body composition analysis was performed using In Body 220 (Biospace). Bioelectrical impedance is a non-invasive method of measuring body composition.
According to the World Health Organization, BMI values below 18.5 indicate underweight, values between 18.5 kg/m2 and 24.9 kg/m2 indicate normal weight, values 25 kg/m2 < 30 kg/m2 indicate overweight, and values over 30 kg/m2 indicate obesity.
Results
Table I presents analysed data in the control and experimental group.
Table I
Values of the analysed parameters in the examined groups of patients
| Parameter | Control group | Experimental group – RA patients |
|---|---|---|
| Number of participants (women) | 50 | 50 |
| Age | 31–61 42.20 ±8.34 | 32–69 57.47 ±9.56 |
| BMI [kg/m2] | 25.64 ±2.33 | 27.74 ±3.88 |
| Fat tissue mass [kg] | 23.14 ±4.20 | 27.78 ±7.97 |
| Skeletal muscle mass [kg] | 25.54 ±5.86 | 25.94 ±5.36 |
| Protein content [kg] | 9.16 ±1.65 | 9.25 ±1.78 |
| % body fat (PBF) | 32.74 ±7.00 | 36.35 ±8.00 |
| Foot Posture Index (FPI-6) | 0.48 ±0.82 | 5.17 ±2.28 |
| Health Assessment Questionnaire (HAQ) | – | 1.72 ±0.54 |
| Disease Activity Score (DAS28) | – | 5.38 ±0.72 |
| Wejsflog’s index (W): | ||
| Left foot | 2.79 ±0.14 | 2.60 ±0.13* |
| Right foot | 2.81 ±0.18 | 2.64 ±0.18* |
| α angle: | ||
| Left foot | 5.30 ±3.20 | 17.34 ±5.44* |
| Right foot | 5.46 ±3.70 | 17.08 ±4.47* |
| Sztriter-Godunow’s index (KY): | ||
| Left foot | 0.25 ±0.17 | 0.43 ±0.19* |
| Right foot | 0.27 ±0.16 | 0.44 ±0.17* |
| Clarke’s angle (CL): | ||
| Left foot | 61.50 ±10.46 | 58.06 ±11.06 |
| Right foot | 62.52 ±14.53 | 60.75 ±12.74 |
Statistical analysis of Wejsflog’s index indicated significantly lower values for feet in the experimental group of patients than in the control group.
Statistically significantly higher values of α angle in both the left and right foot, reflecting hallux valgosity, were observed in experimental group (patients with RA). Also, statistically significantly higher KY values were observed in the same group.
Comparing RA patients with radiological stage I and II to healthy women revealed statistically significant differences in the Wejsflog index, the α angle and KY of the left and right foot (Table II). Similarly, we noted significant differences of the Wejsflog index and the α angle for feet between the experimental group with stage III and IV radiological changes and the control group (Table II). The Wejsflog index during the early phase RA (stage I and II radiological changes) and advanced RA (stage III and IV radiological changes) was statistically significantly lower than in the control group. No significant differences were observed among studied RA patients with regard to radiological stages. However, α angle had statistically significantly higher values in the early RA and increased together with the severity of radiological changes.
Table II
Values of the selected stabilometric parameters in RA patients with radiological stage I/II and III/IV (data are given as mean ± SD)
| Parameter | Control group n = 50 | Patients with stage I/II RA n = 28 | Patients with stage III/IV RA n = 22 |
|---|---|---|---|
| Wejsflog’s index (W): | |||
| Left foot | 2.79 ±0.14 | 2.60 ±0.12* | 2.61 ±0.15* |
| Right foot | 2.81 ±0.18 | 2.64 ±0.16* | 2.64 ±0.22* |
| α angle: | |||
| Left foot | 5.30 ±3.20 | 16.68 ±4.65* | 19.83 ±5.76* |
| Right foot | 5.46 ±3.70 | 16.35 ±4.06* | 17.08 ±4.47* |
| Sztriter-Godunow’s index (KY): | |||
| Left foot | 0.25 ±0.17 | 0.46 ±0.20* | 0.40 ±0.16 |
| Right foot | 0.27 ±0.16 | 0.48 ±0.20* | 0.37 ±0.16 |
| Clarke’s angle (CL): | |||
| Left foot | 61.50 ±10.46 | 54.46 ±11.92 | 63.48 ±7.06 |
| Right foot | 62.52 ±14.53 | 57.29 ±14.01 | 65.95 ±8.71 |
Similarly, we noted statistically significant differences in Wejsflog index, α angle, and KY index for feet between RA patients with different disease activity 3.2 < DAS 28 ≤ 5.1 (moderate) and DAS 28 > 5.1 (high) and the control group (Table III). In the studied group of patients with moderate and high DAS 28 a statistically significantly lower Wejsflog’s index was observed in comparison to the control group.
Table III
Values of selected stabilometric parameters in patients with moderate and high disease activity (data are given as mean ± SD)
| Parameter | Control group n = 50 | Patients with 3.2 < DAS28 index ≤ 5.1 Moderate disease activity n = 23 | Patients with DAS28 index > 5.1 High disease activity n = 27 |
|---|---|---|---|
| Wejsflog’s index (W): | |||
| Left foot | 2.79 ±0.14 | 2.57 ±0.11* | 2.63 ±0.15* |
| Right foot | 2.81 ±0.18 | 2.59 ±0.14* | 2.68 ±0.21* |
| α angle: | |||
| Left foot | 5.30 ±3.20 | 15.08 ±4.54* | 19.08 ±5.55* |
| Right foot | 5.46 ±3.70 | 15.52 ±3.45* | 18.27 ±4.88* |
| Sztriter-Godunow’s index (KY) : | |||
| Left foot | 0.25 ±0.17 | 0.45 ±0.18* | 0.42 ±0.19* |
| Right foot | 0.27 ±0.16 | 0.50 ±0.16* | 0.39 ±0.17* |
| Clarke’s angle (CL): | |||
| Left foot | 61.50 ±10.46 | 55.82 ±10.25 | 59.78 ±11.66 |
| Right foot | 62.52 ±14.53 | 56.45 ±15.93 | 64.05 ±8.80 |
However, the values of α angle were statistically significantly higher in the RA group and the highest value was noted in RA patients with DAS 28 > 5.1.
The Sztriter-Godunow index was significantly higher in subgroups of RA in comparison to the control group.
Here, we observed a trend of an increase in α angle values and KY index in RA patients with increasing severity of the radiological changes and DAS-28.
No significant differences in the RA group with different disease activities were established with regard to selected stabilometric parameters.
Correlations between body composition parameters and selected plantography examination parameters in rheumatoid arthritis patients
Among the estimated parameters of foot statics, a negative correlation between the value of Wejsflog’s index in the right foot, BMI value, and fat tissue mass was found.
Correlations between foot static parameters and Foot Posture Index and Health Assessment Questionnaire in rheumatoid arthritis patients
A positive correlation was noted between the Clarke’s angle value for the left foot and the HAQ value.
No significant differences between foot static parameters and FPI-6 scale were noted.
Discussion
Many patients with RA report foot symptoms at initial diagnosis and disturbances with postural control during everyday activities [4].
Nowadays, notwithstanding the development of medicine and advanced diagnostic methods, estimation of postural changes in the feet in the course of RA poses numerous difficulties. The generally used radiological examination does not always show the severity of clinical changes [16].
Plantar contourography examination is an objective tool to assess the static function and postural changes in the feet of RA patients [17]. This examination not only facilitates assessment of foot function, but it also gives proper diagnosis and graphic documentation of the results [18, 19].
There are studies describing the application of plantography examinations in detection of foot disturbances in RA patients [17, 20]. Researchers indicate that the results of plantography are precise and comparable [20–23].
In our present experiment, we applied plantar contourography to evaluate the foot static changes in an overweight RA population. To our knowledge this is the first study describing foot static disturbances in this population.
In the RA group, Wejsflog’s index, hallux valgus angle (a), Sztriter-Godunov’s index in both feet, and heel angle (g) in the left foot revealed the most common disturbances in foot statics.
The study by Puszczałowska-Lizis, which presented changes in foot statics in women aged 65–90 years, showed that mean values of Clarke’s angle were 39.5° for the right foot and 38.8° for the left foot. The mean value of the hallux valgus for feet was 9°, and the value of the beta angle was 10° [24].
In our experiments, values of Clarke’s angle in the RA group were 60.75° for the right foot and 58.06° for the left foot. However, the highest values of Clarke’s angle were observed in the subgroup of patients with advanced changes in the radiologic evaluation. The mean values of Clarke’s angle in this subgroup were 65.5° for the right foot and 63.48° for the left.
In the present study, the highest values of hallux valgus angle (a) were observed in the subgroup of patients with advanced radiologic changes – 17.34° for the left and 17.08° for the right foot. In our previous study we revealed disturbances not only in the hallux valgus, but also in Clarke’s angle and the KY index. Changes in these parameters significantly influence foot statics in RA patients [17].
As a continuation of experiments carried out in our clinic we decided to evaluate also RA patients with overweight. In the present examinations in overweight RA patients, we observed longitudinally flat feet in 46.6% of right feet and in 43.3% of left feet. But transverse flat foot was noted in 13% of right and in 10% of left feet. The presence of hallux valgus in the right foot was 100%, while it was 97% in the left foot.
Parcou reported that the risk and frequency of occurrence of static-dynamic foot disturbances are age-dependent. The author indicated that in consequence of involutional changes, changes in coping longitudinal foot arch and α angle were observed [25]. In the present study, there were significant differences between α angle in RA subgroups with different radiological stages. In the group with first and second degree radiological changes, the α angle mean value was 16.35° for the right and 15.68° for the left foot. In the group with third and fourth degree radiological changes, the values were higher – 18.18° for the right and 19.83° for the left foot.
Abundant scientific data have been collected regarding the problem of pathological foot changes. The estimation of dependence between longitudinal coping, transverse and setting of the hallux toe V, and morphological structure and nutrition is a subject of interest [7–12, 14]. For the evaluation of nutritional status the BMI is used, but this parameter does not inform one of the fat tissue mass and non-fat body mass. There are no data concerning the connection between analysis of body composition parameters and foot static disturbances.
Examinations conducted on RA patients confirmed that there are often disturbances in body composition in these patients. It was shown that standard anthropometric estimations (i.e. body mass and BMI) are not sensitive enough to estimate changes in body composition.
Bioelectrical impedance analysis is a non-invasive, reliable and repetitive way to estimate body composition. This method demonstrates the precise estimation of protein, mineral substances, fat tissue, non-fat body mass, and water contained in the body.
Konijn et al. described differences between BMI and BIA (bioelectrical impedance). The authors observed high frequency of adverse body composition, mainly in the form of low muscle mass and increased fat tissue mass in RA patients. Additionally, according to BMI, the data showed that 54% of patients were overweight or obese, and BIA indicated that 74% of RA patients had a high or very high level of fat tissue; 18% had skeletal muscle mass below the norm [26]. Similar results were obtained in our research. A high or very high level of fat tissue was observed in 90% of patients, and 10% of patients had skeletal muscle mass below the norm.
Curyło et al. investigated the dependence between Wejsflog’s index and BMI in 249 healthy people. They confirmed the correlation of BMI with Wejsflog’s index. The results allowed them to estimate the frequency of transverse coping decline [27]. In our study, we found a statistically significant negative correlation between Wejsflog’s index for the right foot and BMI value, as well as fat tissue mass value.
The mass of the body is one of many factors influencing proper function of the feet. Hills et al. observed increased plantar pressure and higher width of the front of the foot in obese people [28]. Lorkowski’s experiment was carried out on obese women with plantar aponeurositis affecting both sides. In all of the women studied, he observed increased plantar pressure and presence of deformations [29].
Trzcińska used Clarke’s angle and Sztriter-Godunov’s index to estimate longitudinal foot arch and Wejsflog’s index and heel angle to estimate transverse foot arch. She concluded that KY index disturbances in longitudinal foot arches were observed more often on the basis of Clarke’s angle [30]. In our experiment, we observed more patients with flat feet on the basis of KY index estimation, and fewer when we used Clarke’s angle criteria.
Applying Wejsflog’s criteria, we noted a higher number of patients with transverse flat foot than when heel angle criteria were used. In the present study, we noted a negative relationship between the HAQ and feet function. In patients with RA, a high HAQ index can cause falls and fractures [6]. In addition to a positive correlation between the Clarke’s angle of the left foot and HAQ index, we found a statistically significant positive correlation between DAS28, VAS, degree of X-ray changes and HAQ index.
Our results indicated the relationship between foot static changes and clinical course of RA in overweight patients. Here, we observed a trend of an increase in α angle values and KY index in RA patients with increasing severity of the radiological changes and DAS28. Plantar contourography and bioelectrical impedance can be useful for diagnostic examinations in overweight RA patients, improving diagnoses and ensuring use of proper therapeutic strategies of destructive changes.