Introduction
Liver cancer is known to be one of the most prevalent malignancies across the globe. According to a recent estimate, out of about 800,000 people diagnosed with liver cancer, more than 700,000 people died [1]. Additionally, lung cancer is responsible for about 5% to 6% of all new cancer cases diagnosed every year and approximately 9% of all cancer-related deaths across the globe [1]. The sharp upsurge in the frequency of liver cancer, lack of standard treatments and the severe side effects associated with the existing drugs have made it compulsory to explore novel and more effective anticancer molecules. In the recent past, there has been escalating interest in the use of herbal drugs or herb-derived natural drugs due to their lower side effects. Among the natural products flavonoids form a large group of compounds commonly found in plants [2]. These molecules have been reported to possess several bioactivities which include antimicrobial, antioxidant and anticancer, among others [3]. The bioactivities of flavonoids are accredited to their ability to interact with a number of cellular enzymes. Moreover, flavonoids act as antioxidants and protect cells from oxidative damage [3–6]. The use of flavonoids as prospective chemopreventive agents has gained lot of interest recently. One such molecule is the naturally occurring flavonoid genistein, which has been shown to exhibit considerable pharmacological potential [7]. Genistein is present in edible plants, and is therefore likely to exhibit insignificant toxicity in humans. Moreover, it has been reported that genistein does not exhibit any significant cytotoxicity in vivo [8]. Against this backdrop, the present study was designed to examine the anticancer activity of genistein against the liver cancer cell line HepG2 and explore the possible underlying mechanism. Our results indicated that genistein exhibits significant anticancer activity against the liver cell line HepG2 through ROS-induced mitochondrial apoptosis and cell cycle arrest.
Material and methods
Chemicals, reagents and cell culture
Several chemicals and reagents were used in the present study. These include (i) genistein, RNase A, triton X-100 and dimethyl and sulfoxide (DMSO) obtained from Sigma-Aldrich Co. (St. Louis, MO, USA), and (ii) the fluorescent probes DCFH-DA, 4′-6-diamidino-2-phenylindole (DAPI), RPMI-1640 medium, L-glutamine and antibiotics obtained from Invitrogen Life Technologies (Carlsbad, CA, USA). The human liver cancer cell line HepG2 was procured from Cancer Research Institute of Beijing, China, and it was maintained in RPMI-1640 medium (Gibco-Invitrogen) supplemented with L-glutamine (2 mM), sodium pyruvate (1 mM), penicillin (100 U/ml), streptomycin (100 mg/ml), and 10% fetal bovine serum.
MTT and colony formation assay
The cytotoxic effect of genistein was determined against the liver cancer cell line HepG2 using MTT assay as described previously [9]. The cytotoxic effect of genistein against HepG2 was expressed as IC50. Cancer HepG2 cells were plated at the density of 2 × 10⁵ cells/well into the 12-well plates and treated with 6.2–100 μM genistein or only with vehicle (DMSO, 0.1% in culture medium). To each well, 20 μl of MTT solution (2.5 mg/ml) was added. Prior to the addition of 500 μl of DMSO, the medium was completely removed. To solubilize MTT formazan crystals, 500 μl DMSO was added. An ELISA plate reader was used for the determination of optical density at 570 (OD570) [9]. For colony formation assay, liver cell line HepG2 cells at the exponential growth phase were harvested and counted with a hemocytometer. Seeding of the cells was done at 200 cells per well in a 24-well plate, incubated for a time period of 48 h to allow the cells to attach and then different doses (0, 12.5, 25 and 50 μM) of genistein were added. After treatment, the cells were again kept for incubation for 6 days, then washing was done with PBS and methanol was used to fix colonies. Afterwards, colonies were stained with crystal violet for about 30 min before being counted under a light microscope.
Estimation of cell cycle distribution of HepG2 cells
The cells were placed in 12-well plates at a density of 2 × 10⁵ cells/well and genistein was administered to the cells at concentrations of 0, 12.5, 25 and 50 μM followed by 24 h of incubation. DMSO was used as a control. For estimation of DNA content, PBS was used to wash the cells and fixed in ethanol at –20°C. This was followed by re-suspension in PBS holding 40 μg/ml PI and, RNase A (0.1 mg/ml) and Triton X-100 (0.1%) for 30 min in a dark room at 37°C. Afterwards, analysis was carried out by flow cytometry as reported previously [9].
Detection and estimation of apoptotic cell populations
HepG2 cells at a density of 2 × 10⁵ cells/well were seeded in 6-well plates and administered 0, 12.5, 25 and 50 μM of genistein for 24 h. The cells were then stained with DAPI for detection of apoptosis, photographs were taken under a fluorescent microscope and annexin V/IP was used for estimation of apoptotic cell populations. Flow cytometry was as previously reported [10].
Determination of reactive oxygen species (ROS)
HepG2 cells were seeded at a density of 2 × 10⁵ cells/well in a 12-well plate and kept for 24 h and treated with 0, 12.5, and 50 μM genistein for 72 h at 37°C in 5% CO2 and 95% air. Thereafter cells from all treatments were collected, washed twice with PBS and re-suspended in 500 μl of DCFH-DA (10 μM) for ROS estimation at 37°C in a dark room for 30 min. The samples were then analyzed instantly using flow cytometry as previously reported in the literature [11].
Wound healing assay
HepG2 cells were seeded at a 5 × 10⁴ cell density on 96-well plates and then kept overnight and allowed to adhere. As the cells reached confluence, a wound was scratched across each well with a wound maker device. Afterwards the cells were washed with PBS to remove the detached cells. The cells were monitored after 5, 10 and 20 h intervals and photographed.
Western blot analysis
The genistein-administered cells were harvested and lysed in a lysis buffer (20 mM HEPES, 350 mM NaCl, 20% glycerol, 1% Nonidet P 40, 1 mM MgCl2, 0.5 mM EDTA, 0.1 mM EGTA, 1 mM DTT, 1 mM PMSF, protease inhibitor cocktail, and phosphatase inhibitor cocktail). The protein concentrations of the lysates were quantified by BCA assay using specific antibodies. β-actin was used as a control. From each sample equal amounts of protein were loaded and separated by electrophoresis on a 12% denaturing SDS gel. Afterwards, the proteins were electroblotted on polyvinylidene difluoride membranes.
Results
Genistein decreased viability and nuclear morphology of HepG2 cells
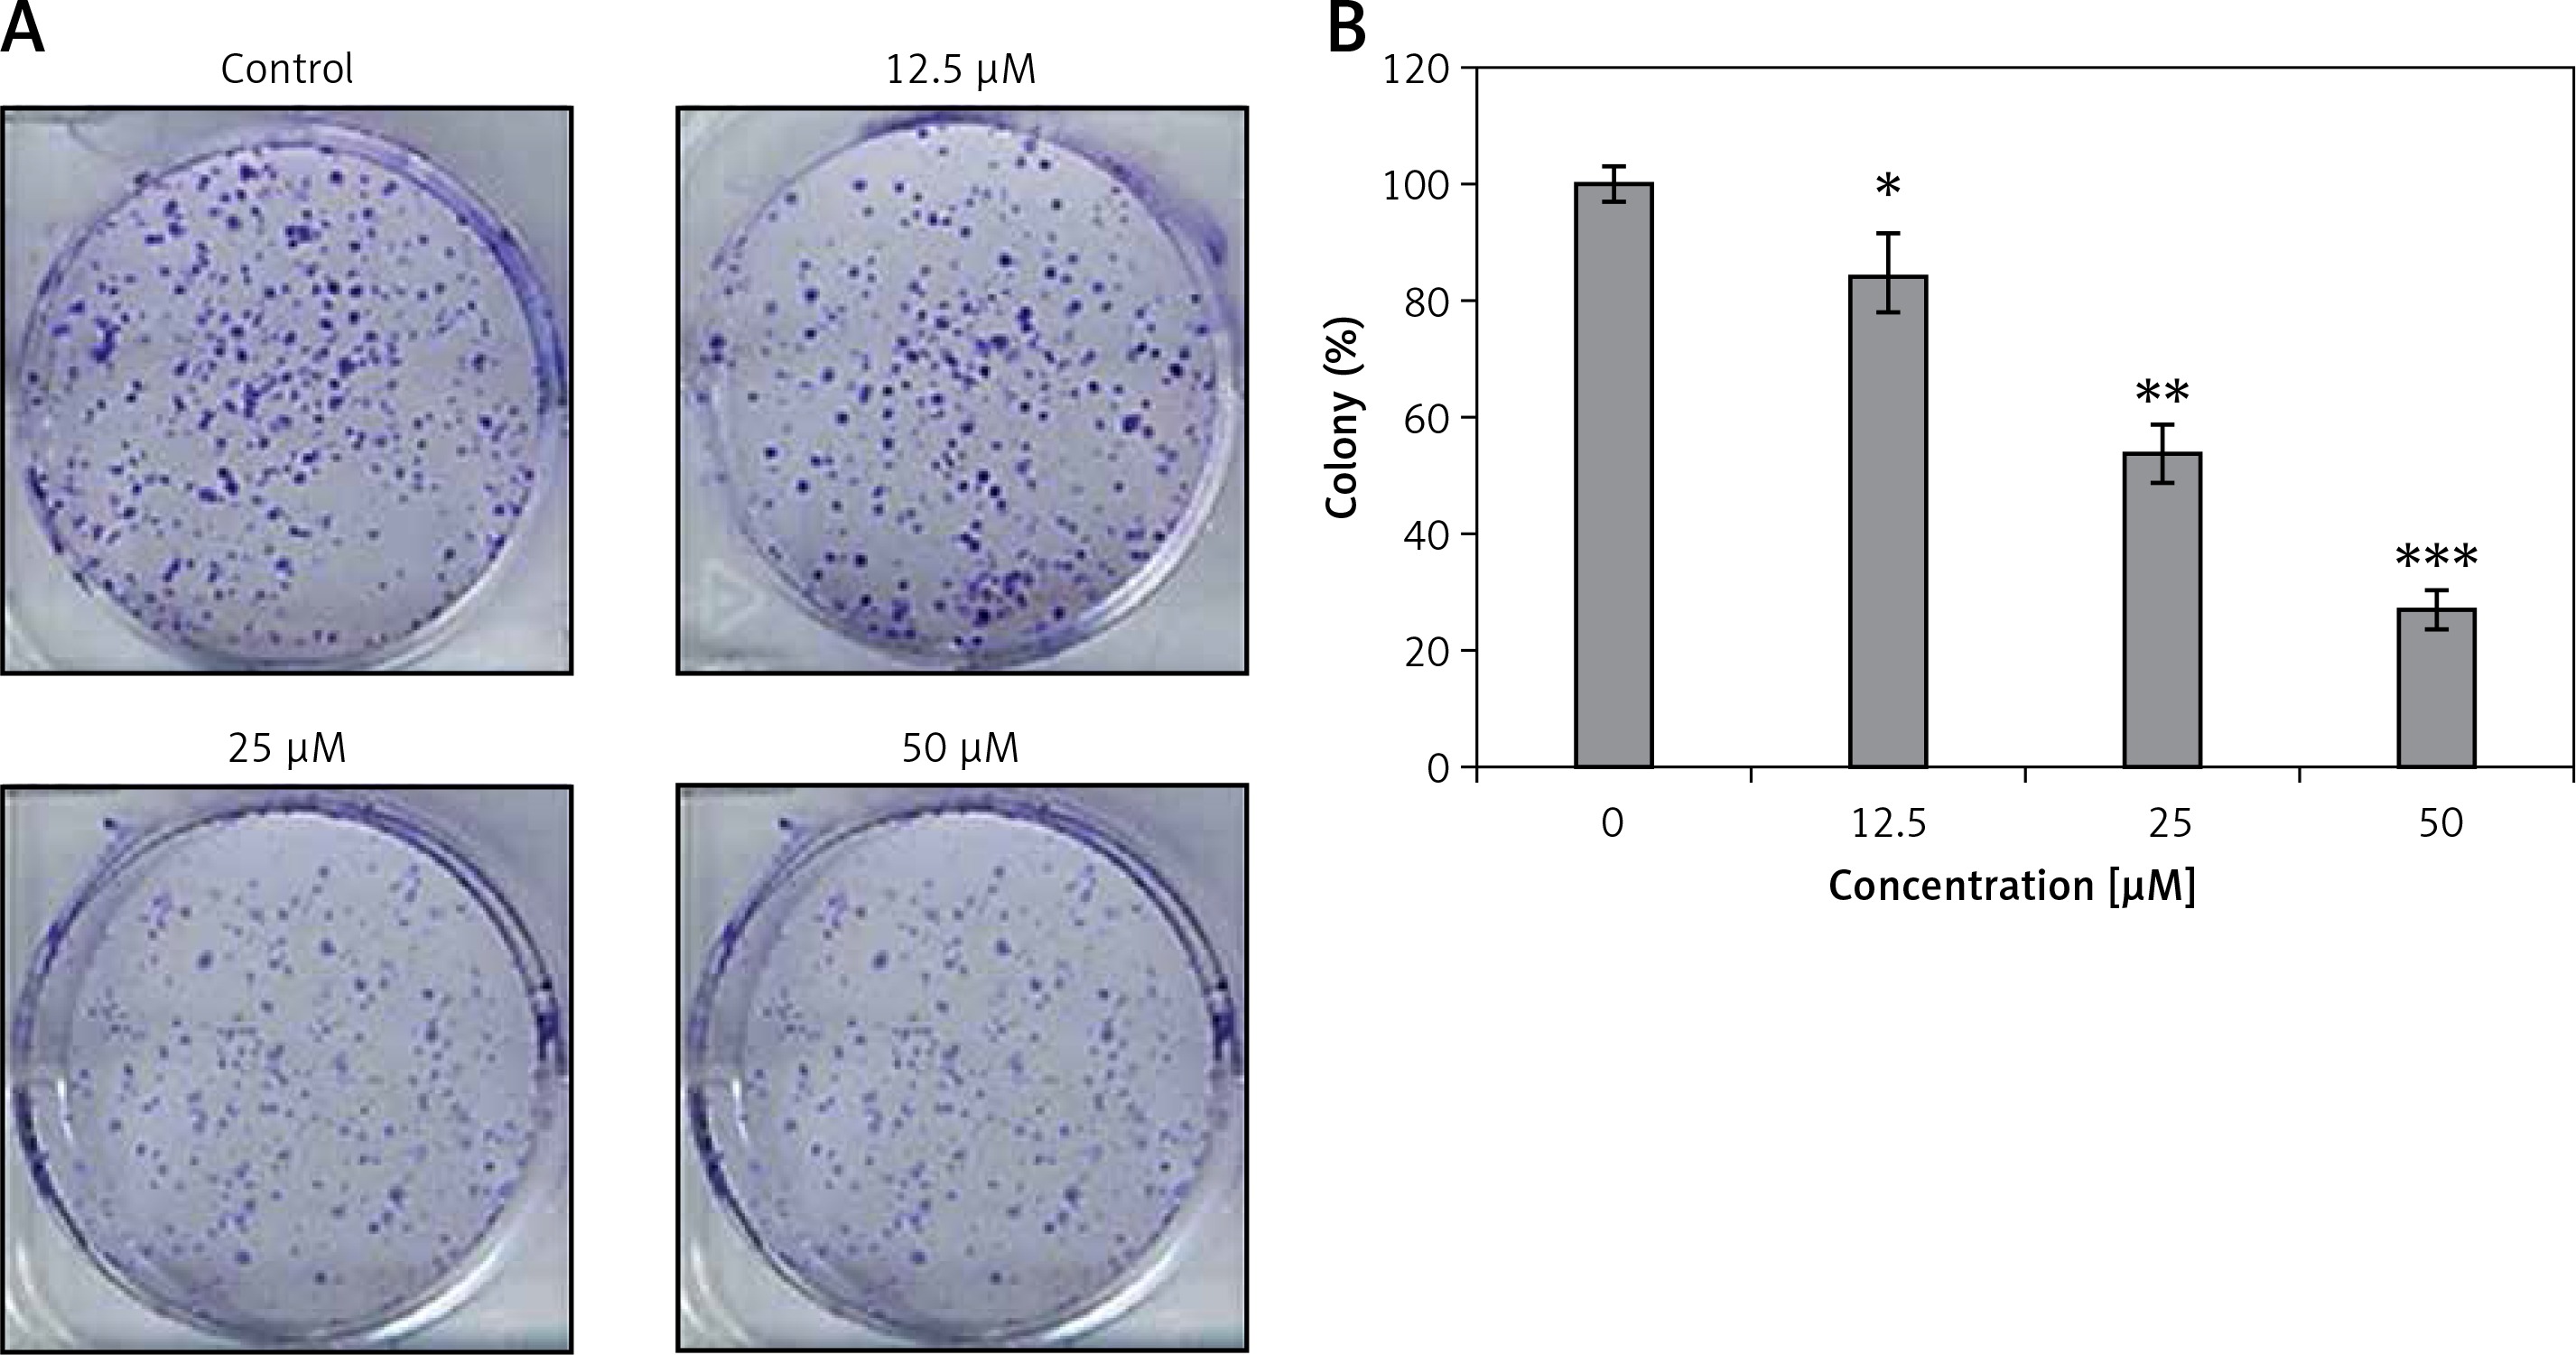
Genistein was evaluated against the HepG2 cell line and was found to exhibit an IC50 of 25 μM. After administration of several doses of genistein, cell viability was determined (Figure 1). It was observed that genistein decreased the percent viability of cells concentration-dependently. Additionally, genistein exhibited the potential to reduce the colony forming potential of HepG2 cells in a concentration-dependent manner (Figure 2).
Figure 1
Assessment of cell viability at indicated doses of genistein at indicated time intervals
Results are the mean of three biological replicates and are expressed as mean ± SD. The values were considered statistically significant at *p < 0.01, **p < 0.001 and ***p < 0.0001.
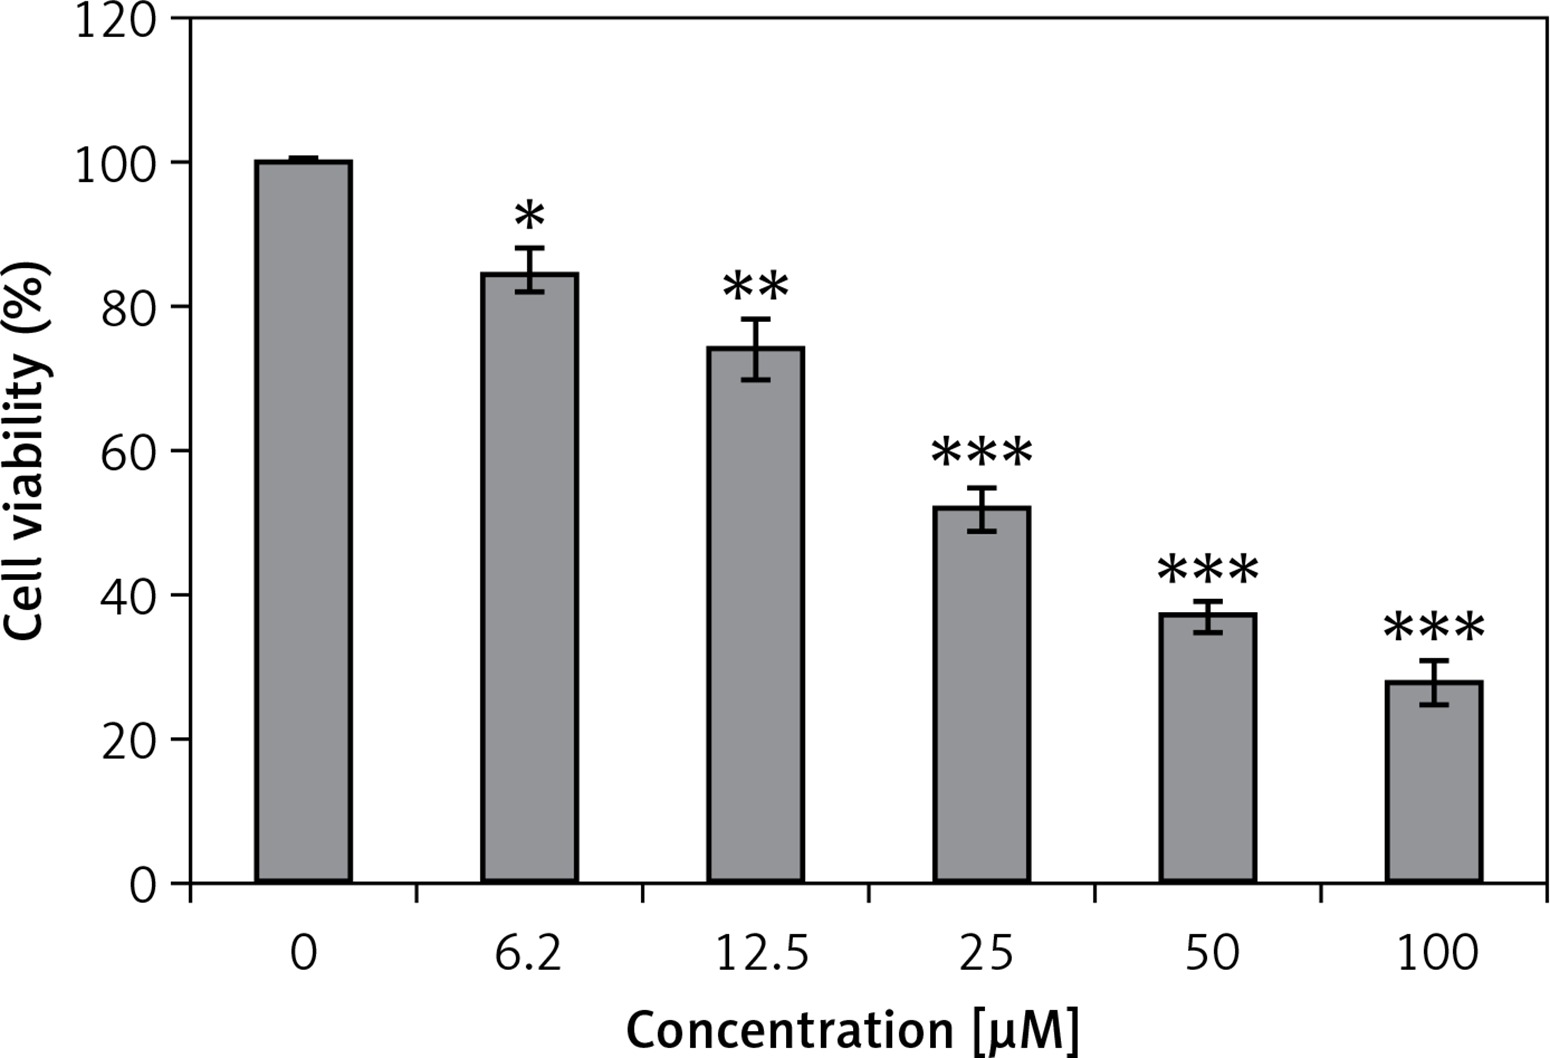
Figure 2
Colony formation assay of HepG2 cells: A – inhibition of colony formation, B – percentage of colony inhibition at indicated doses of genistein
Results are the mean of three biological replicates and are expressed as mean ± SD. The values were considered statistically significant at *p < 0.01, **p < 0.001 and ***p < 0.0001.
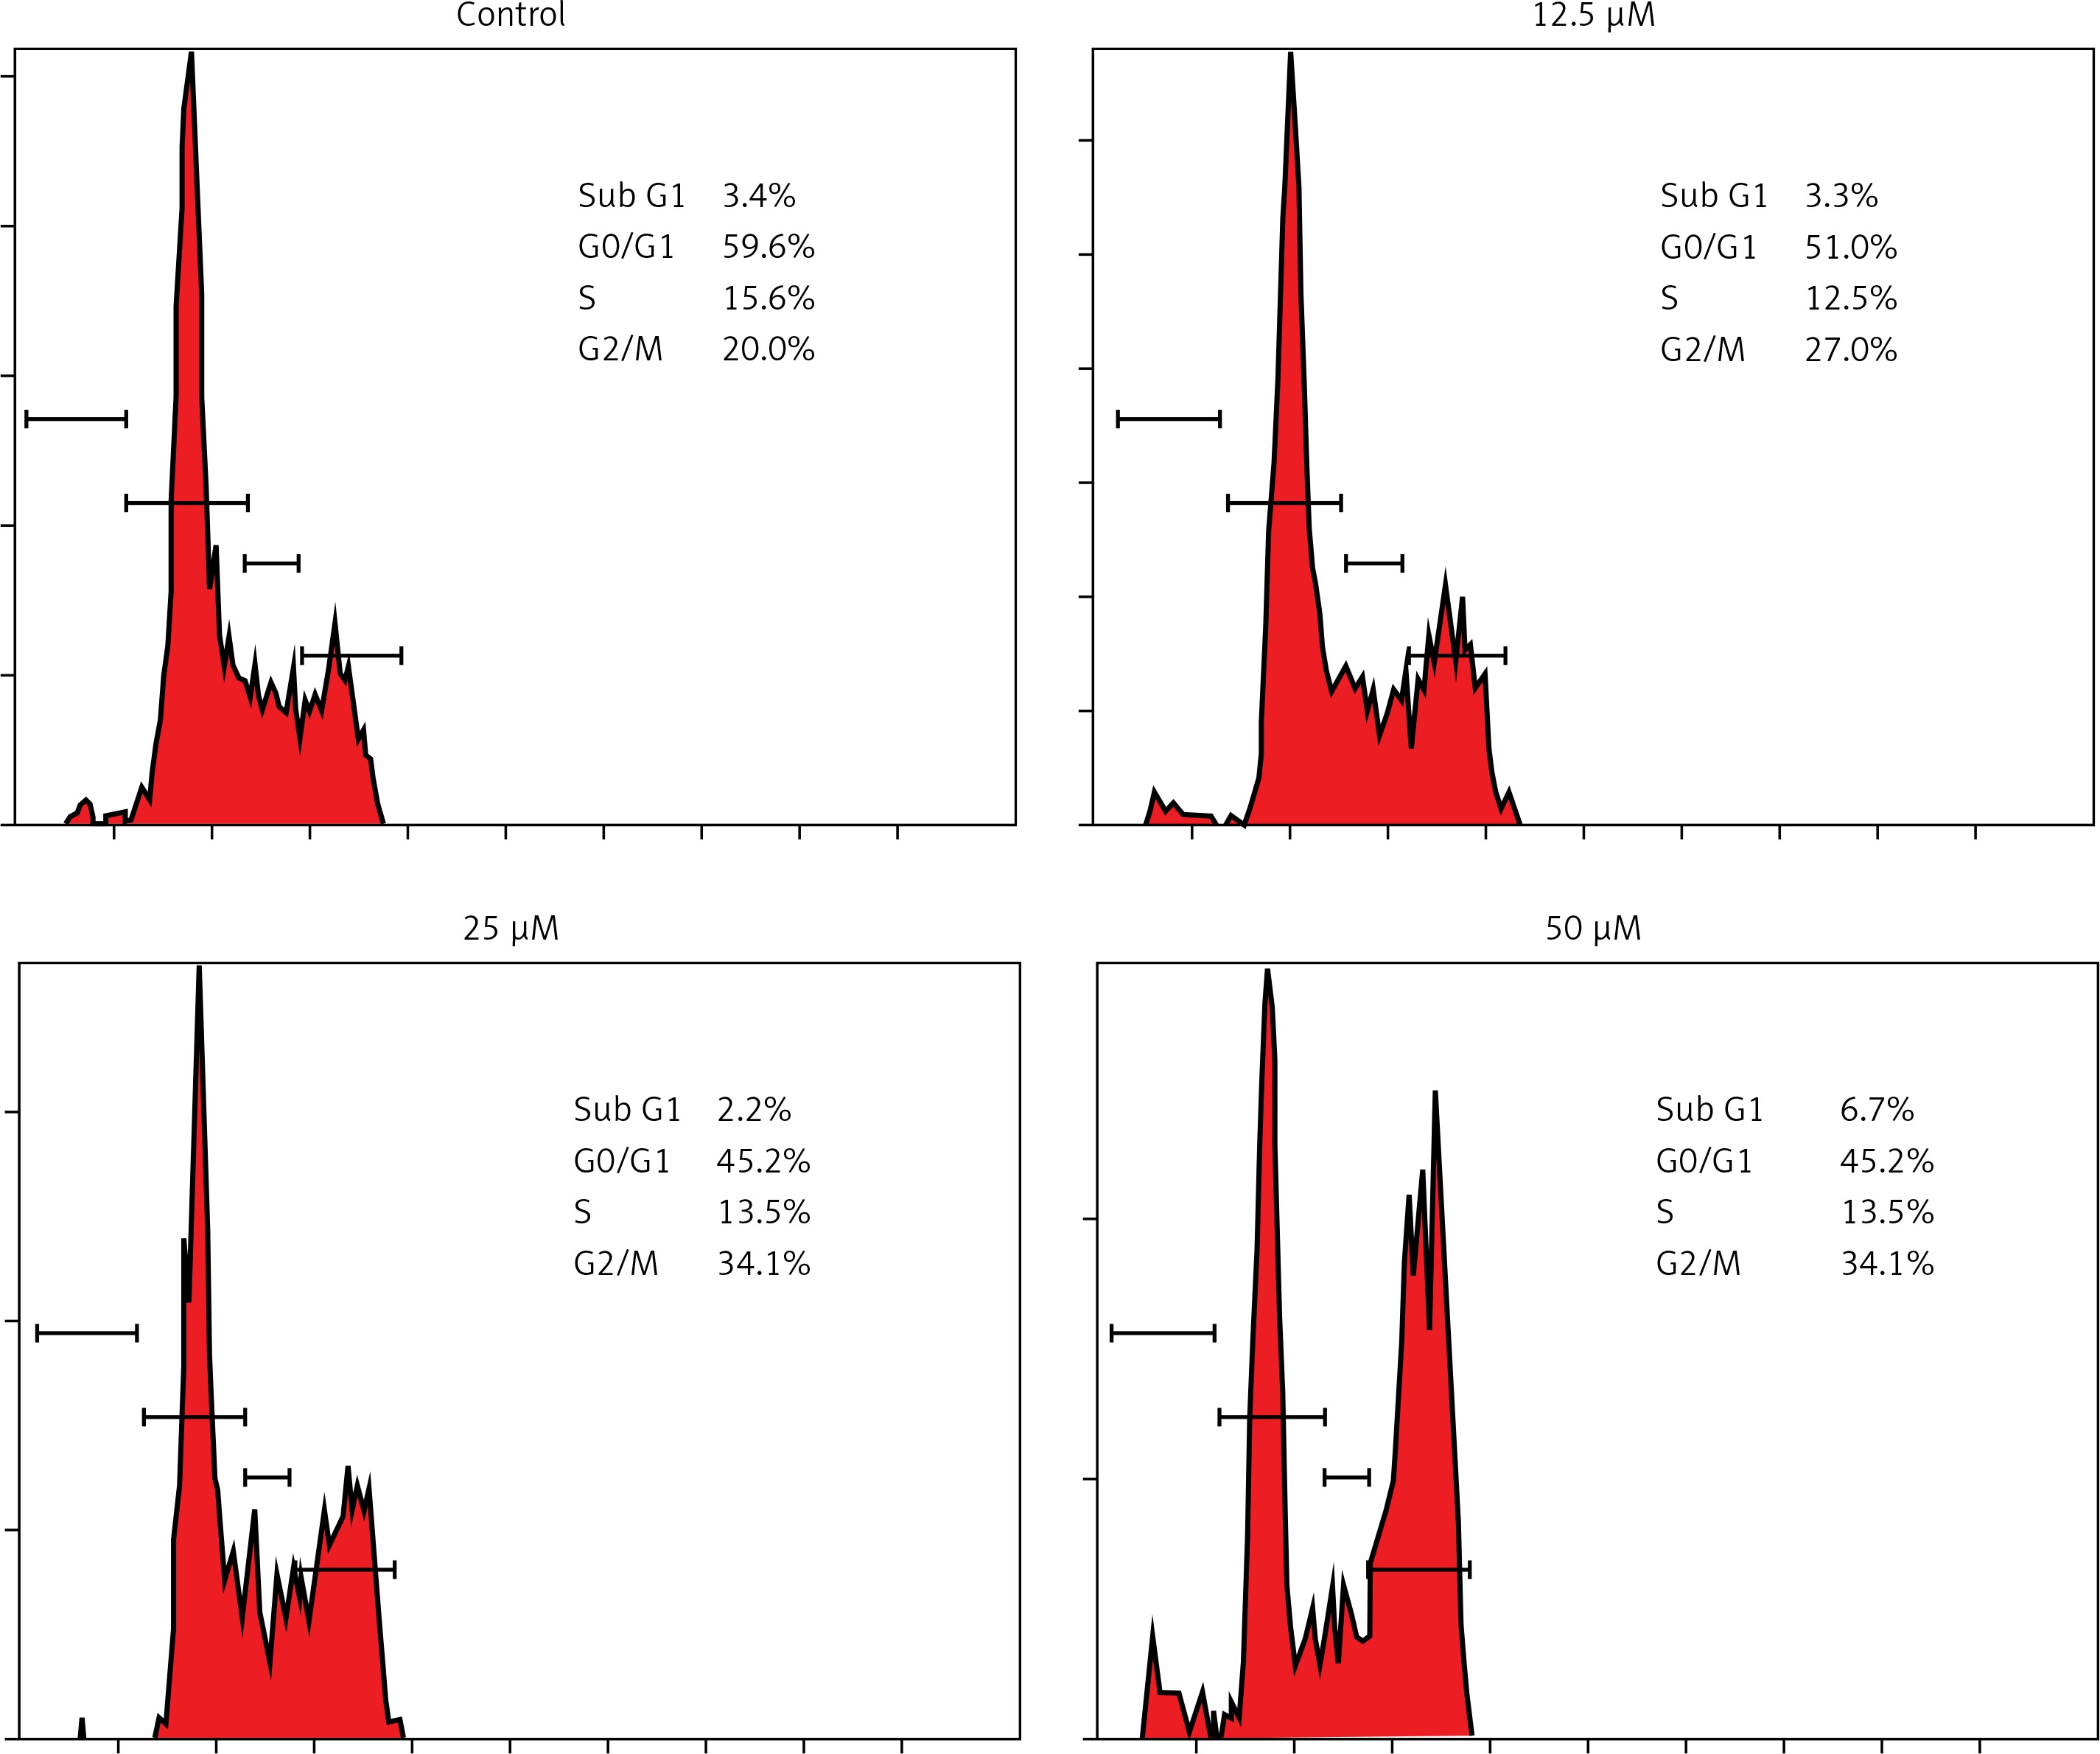
Genistein caused G2/M cell cycle arrest of HepG2 cells
It was observed that the percentage of HepG2 cells was considerably increased in G2 at the concentrations of 12.5 to 50 μM of genistein, causing G2/M cell cycle phase arrest (Figure 3). Additionally, the populations of HepG2 cells in G2 phase were slightly increased at a dose of 12.5 μM, but the G2 cell populations were highly increased at the highest tested concentrations of 50 μM. Thus genistein-induced G2/M increase of HepG2 cancer cells was observed to exhibit a dose-dependent pattern.
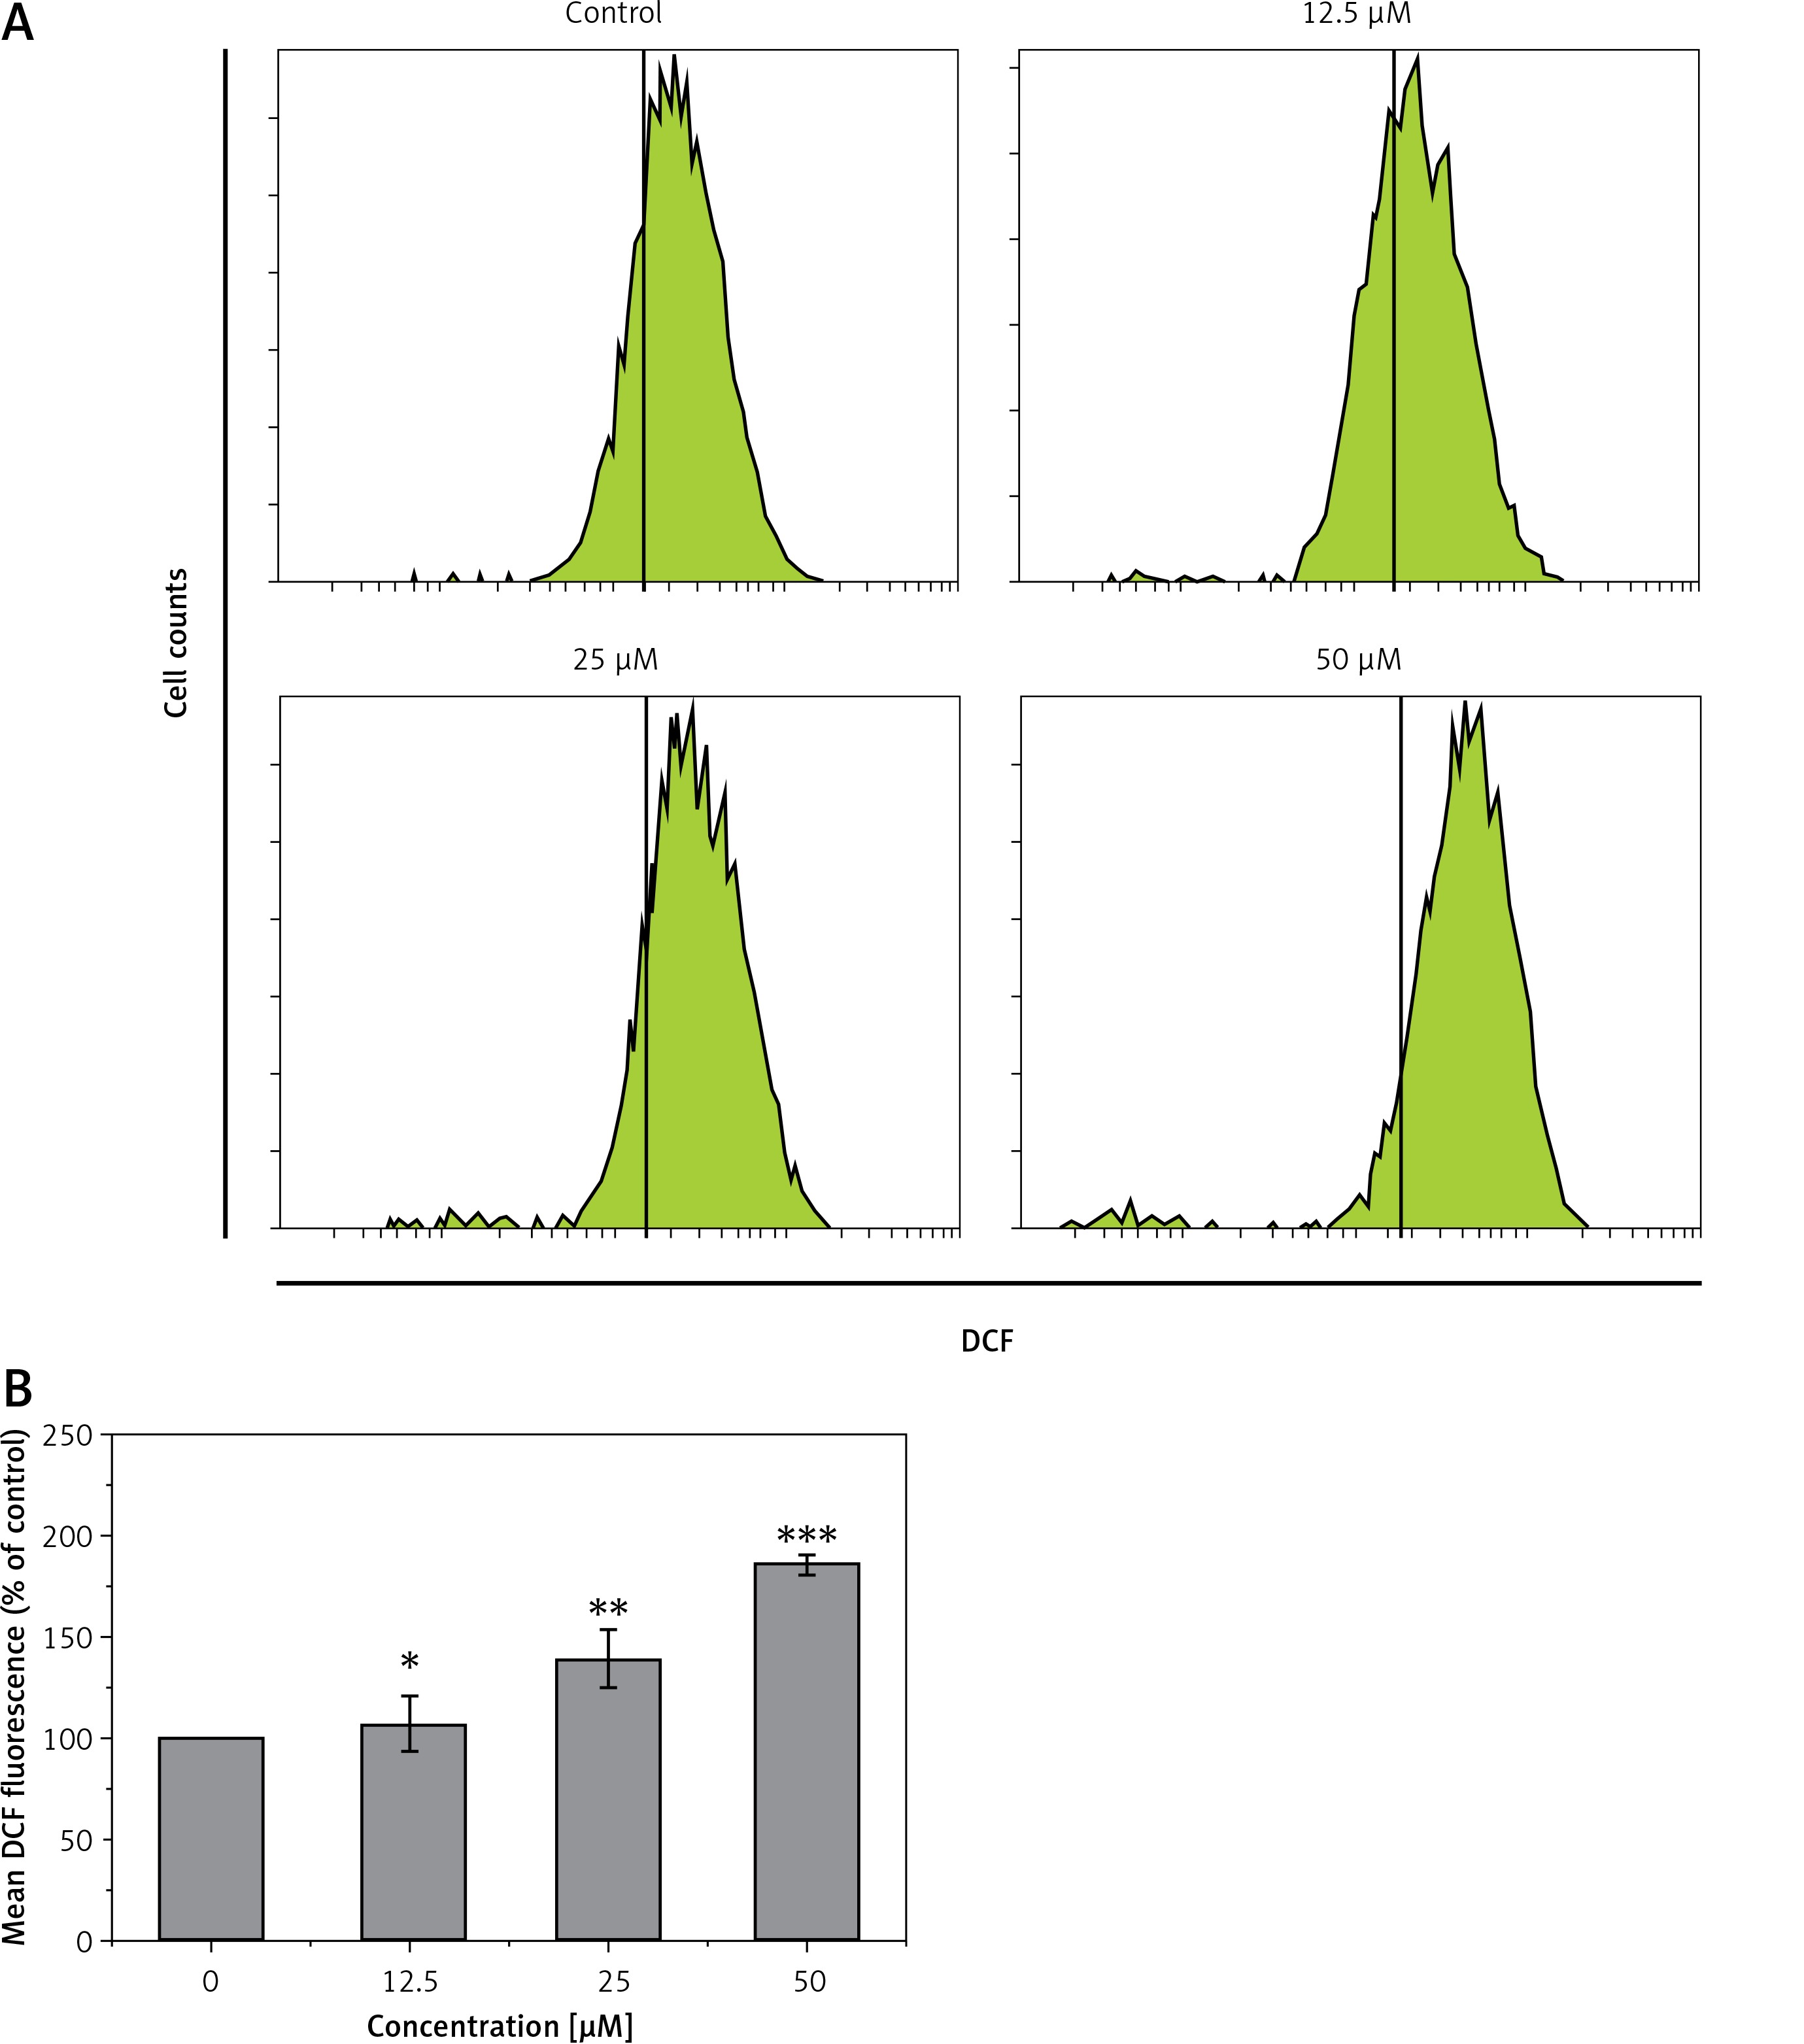
Genistein augmented the accretion of ROS
HepG2 cells were administered with different concentrations of genistein and the levels of ROS, and metalloproteinase (MMP) were evaluated. A considerable upsurge in intracellular ROS and a significant reduction of MMP level were experienced in the genistein-treated HepG2 cells as compared to the control. It was observed that genistein treatment considerably augmented the ROS levels at 12.5, 25, and 50 μM as compared to the control (Figure 4).
Figure 4
Determination of ROS at indicated doses of genistein at indicated time intervals. A – Flow cytometric analysis, B – Quantification
Results are the mean of three biological replicates and are expressed as mean ± SD. The values were considered statistically significant at *p < 0.01, **p < 0.001 and ***p < 0.0001.
Genistein induced apoptosis in HepG2 cells through a mitochondrial pathway
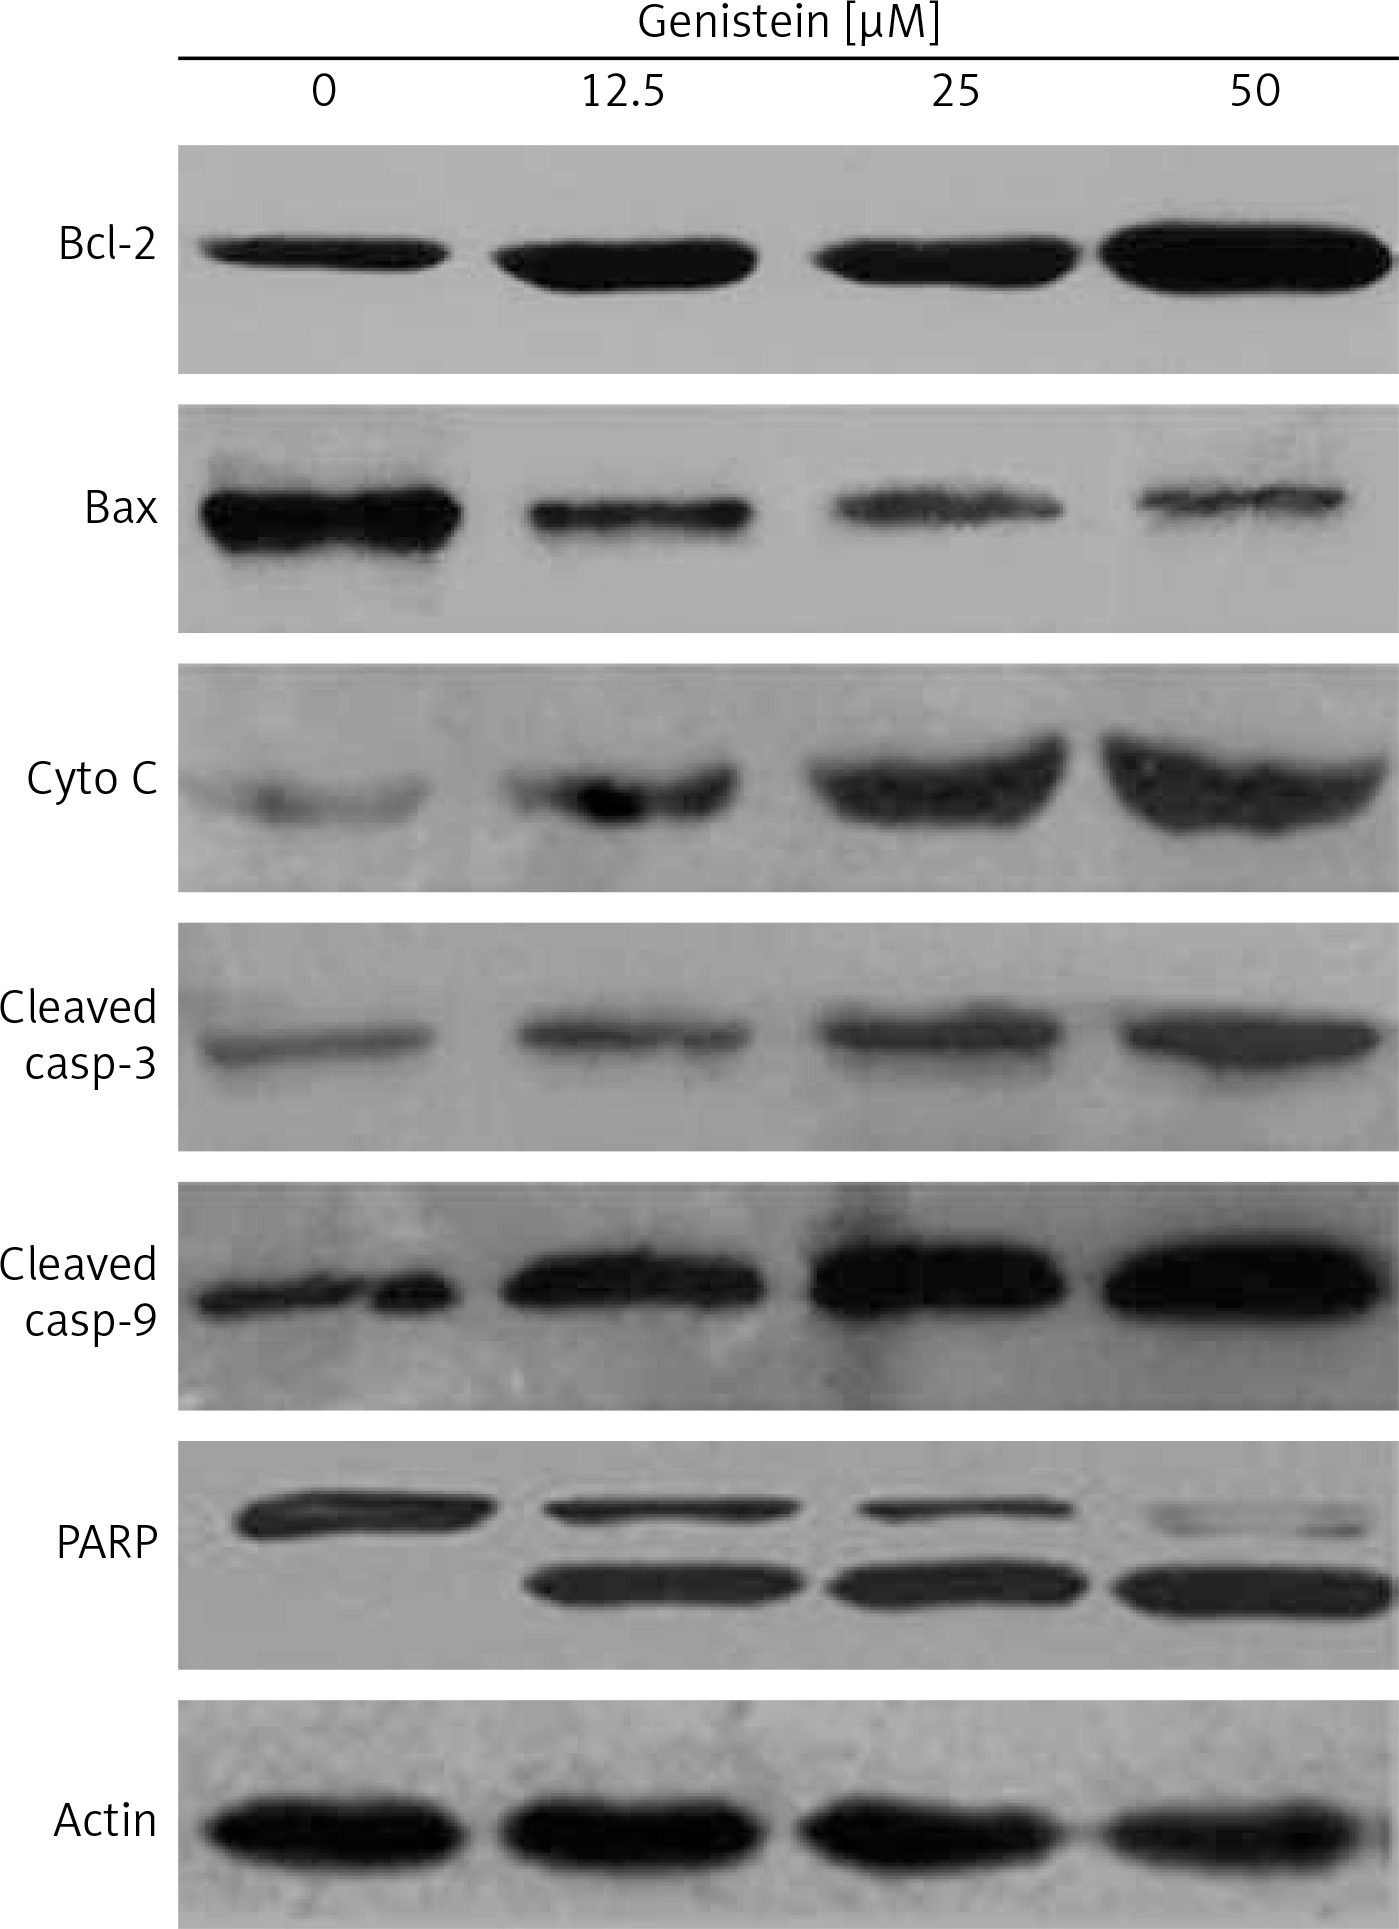
DAPI staining indicated that genistein-administered cells showed condensed and marked fragmented nuclei in a concentration-dependent manner (Figure 5). The apoptotic cell populations increased from 4.2% in the control to 56.4% at 100 μM concentration (Figure 6). Mitochondrial mutilation expedites cytochrome c discharge from mitochondria into the cytoplasm and triggers apoptotic factors (Bcl-2 family proteins), which cause stimulation of the caspase signaling and mitochondria-facilitated apoptosis [12]. Initiation of caspase signaling causes PARP cleavage, which is considered as the main pathway in triggering apoptosis. To assess whether genistein triggers apoptosis via this mechanism in HepG2 cells, we investigated the expression levels of cytochrome c, the pro-apoptotic protein Bax, the anti-apoptotic protein Bcl-2, caspase 3, caspase 9 and PARP through western blot analysis. The results revealed that that genistein upregulated cytosolic cytochrome c, Bax, cleaved caspase 3 and cleaved caspase 9 expression, with associated downregulation of Bcl-2 expression in comparison to the untreated cells kept as a control (Figure 7). Nonetheless, treatment of HepG2 cells with genistein also caused the cleavage of PARP fragment (Figure 7), an endogenous substrate of activated caspase-3, and its cleavage is known to be characteristic of cell apoptosis. Therefore, the results indicate that mitochondria and Bcl-2 family members are associated with genistein-triggered cell apoptosis in HepG2 cells.
Figure 5
Detection of apoptosis by DAPI staining at indicated doses of genistein. Results are representatives of three biological replicates
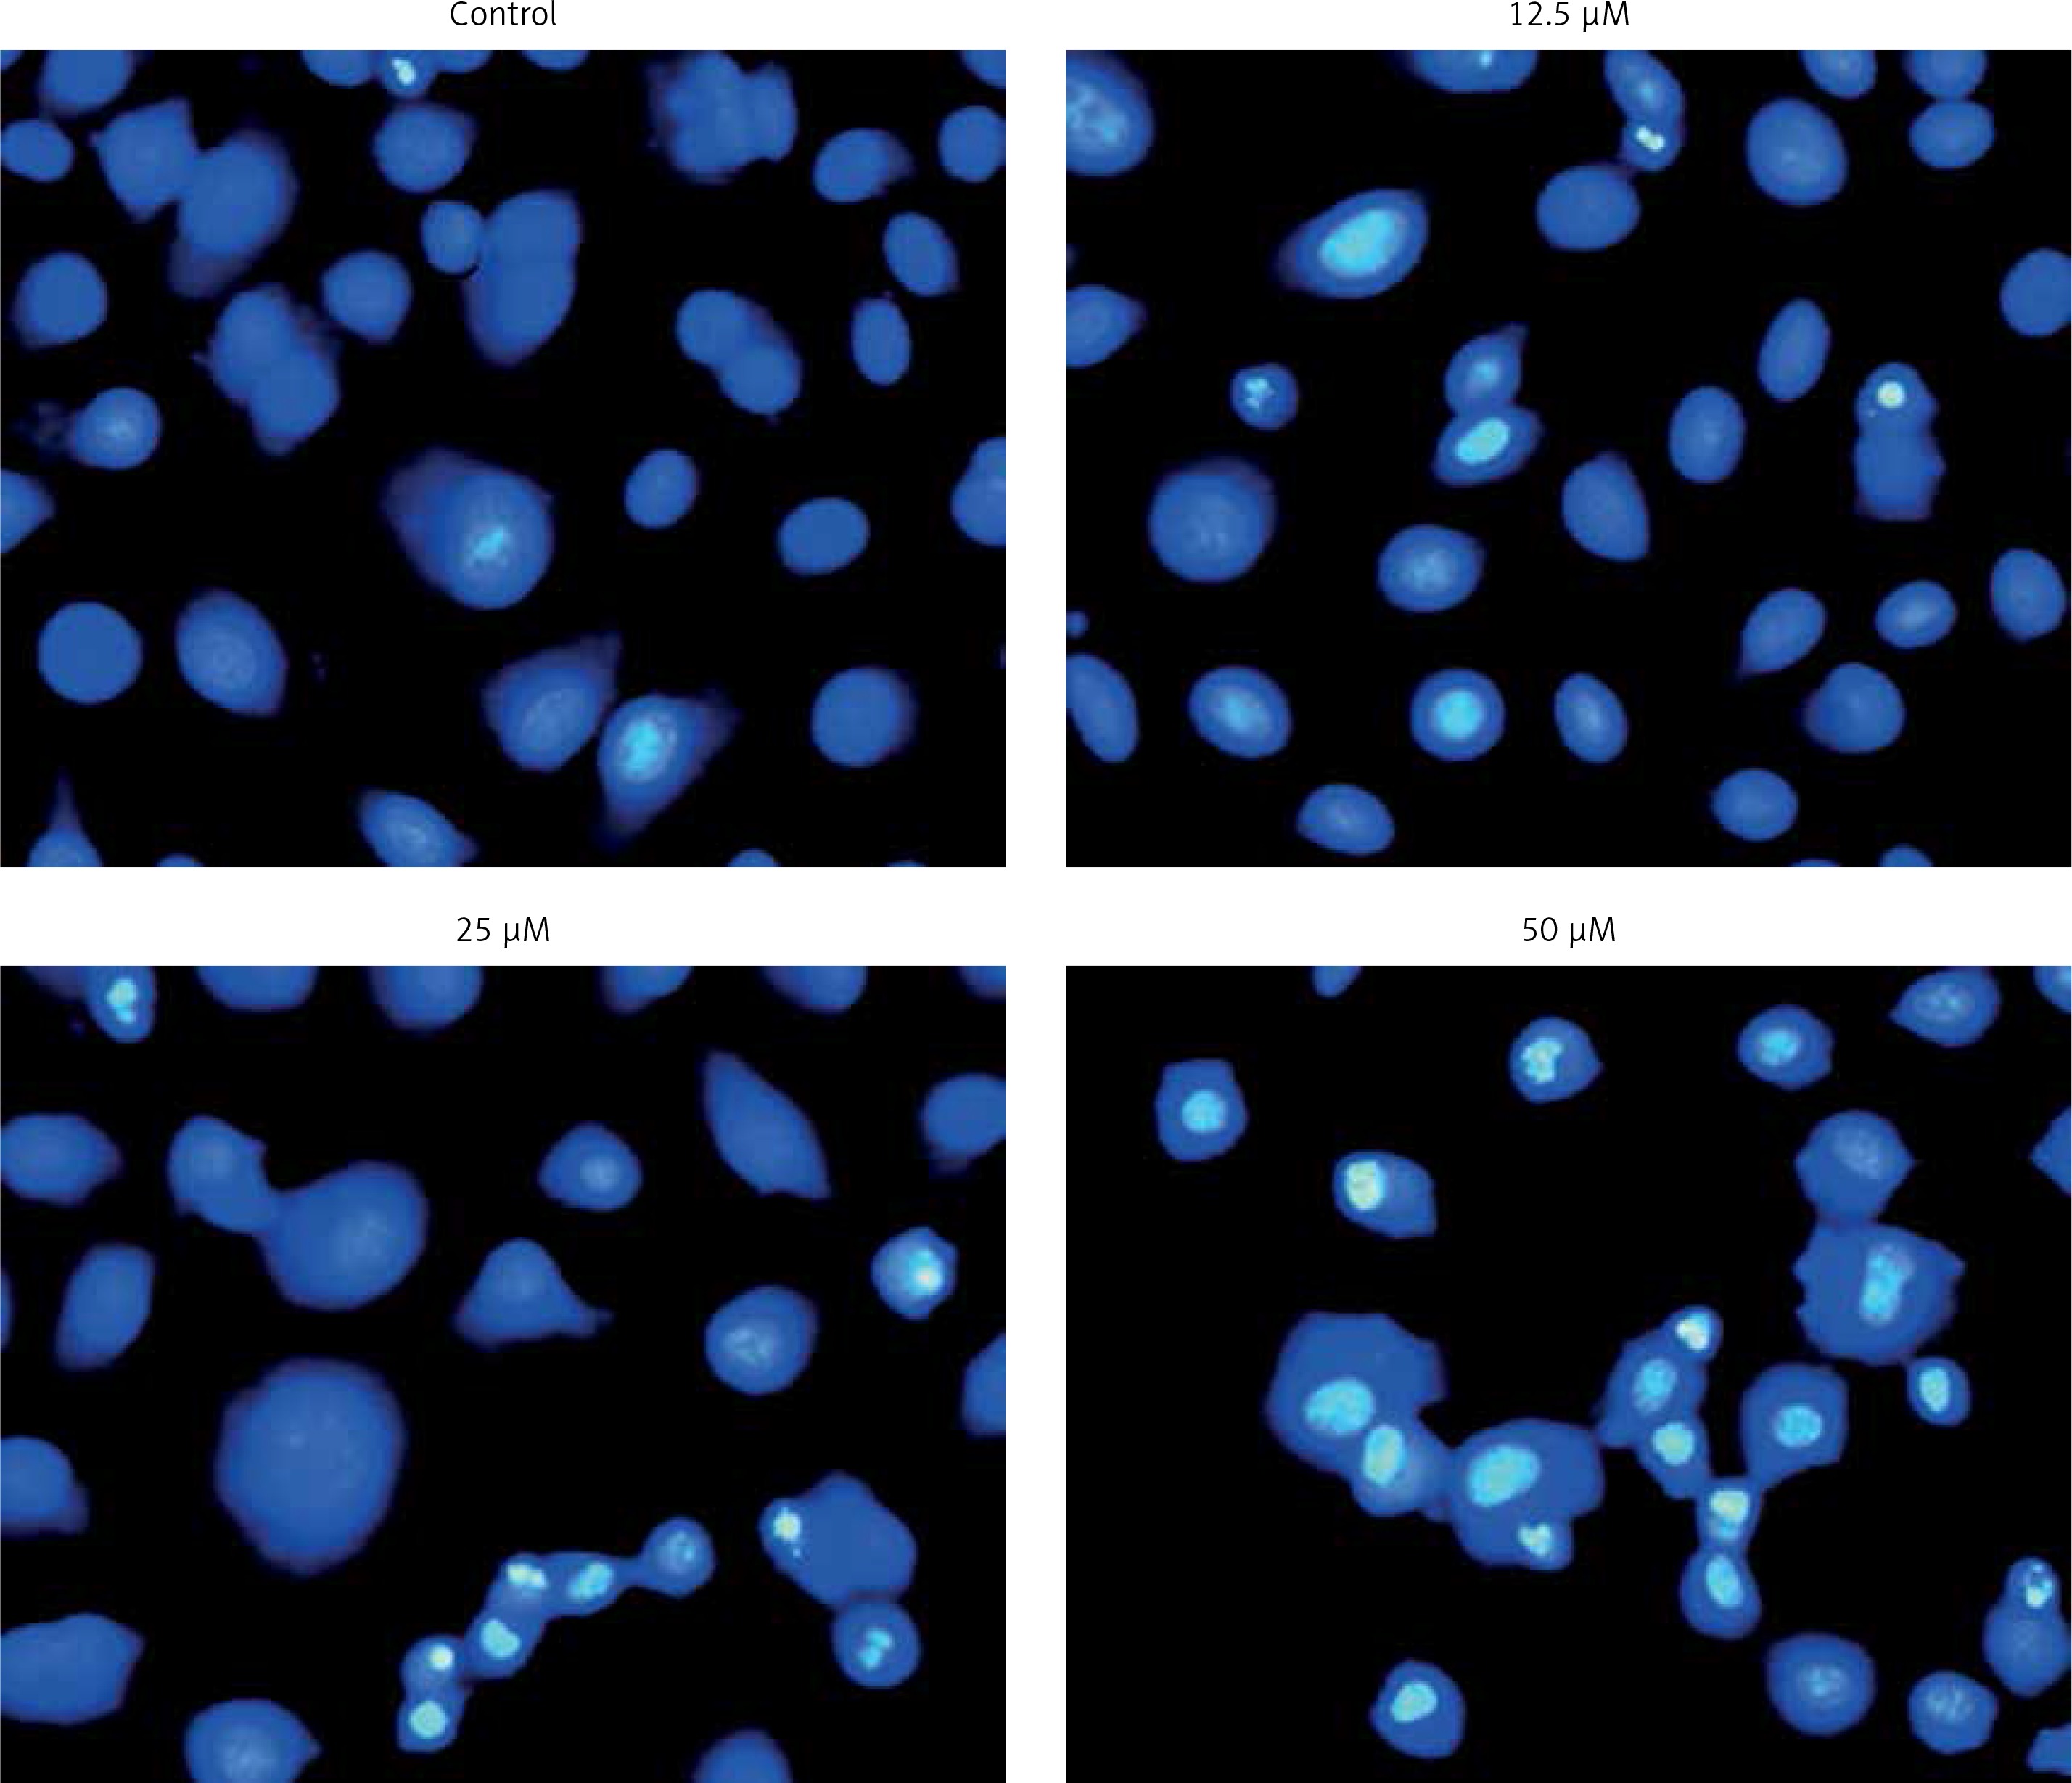
Figure 6
Estimation of apoptotic HepG2 populations at indicated doses by annexin V/IP using flow cytometric analysis. The images are representatives of three biological replicates
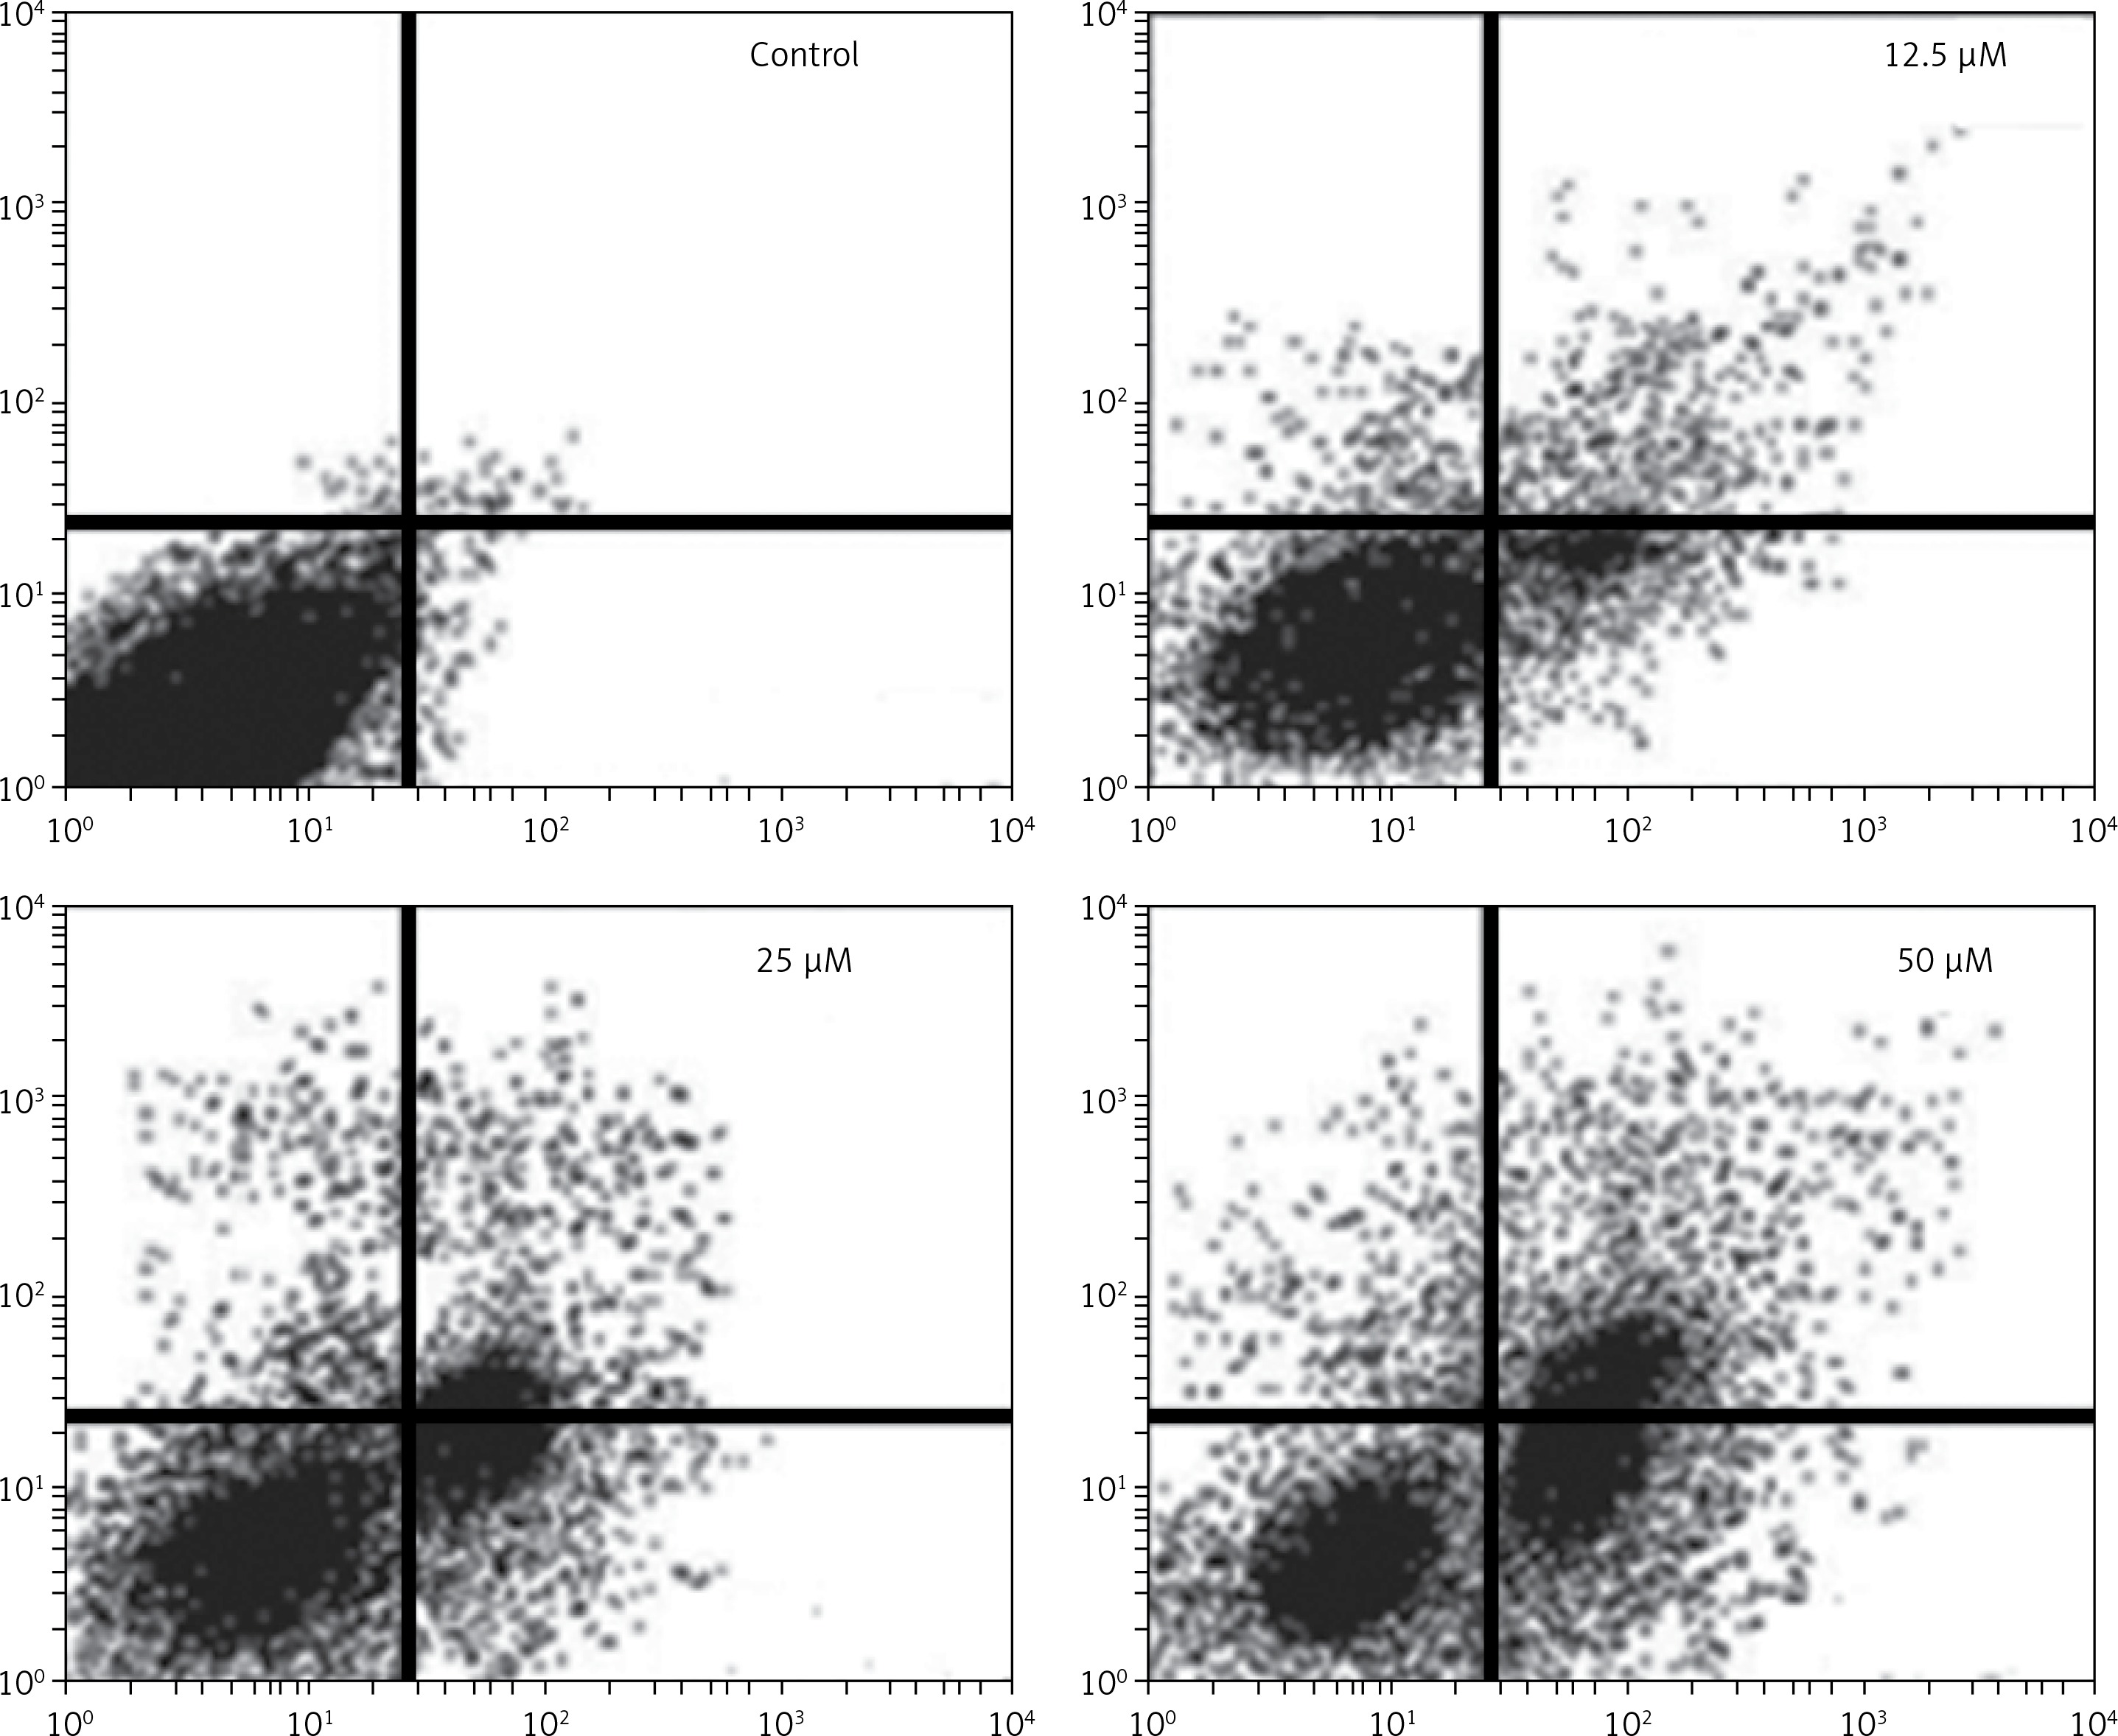
Figure 7
The effect of indicated doses of genistein on the expression of caspase-dependent mitochondrial apoptosis pathway proteins in HepG2 cells. Representative images of cytochrome c, Bax, Bcl-2, PARP, cleaved caspase 9 and cleaved caspase 3 protein expression detected by western blot. β-actin was used as a control. All experiments were carried out in three biological replicates
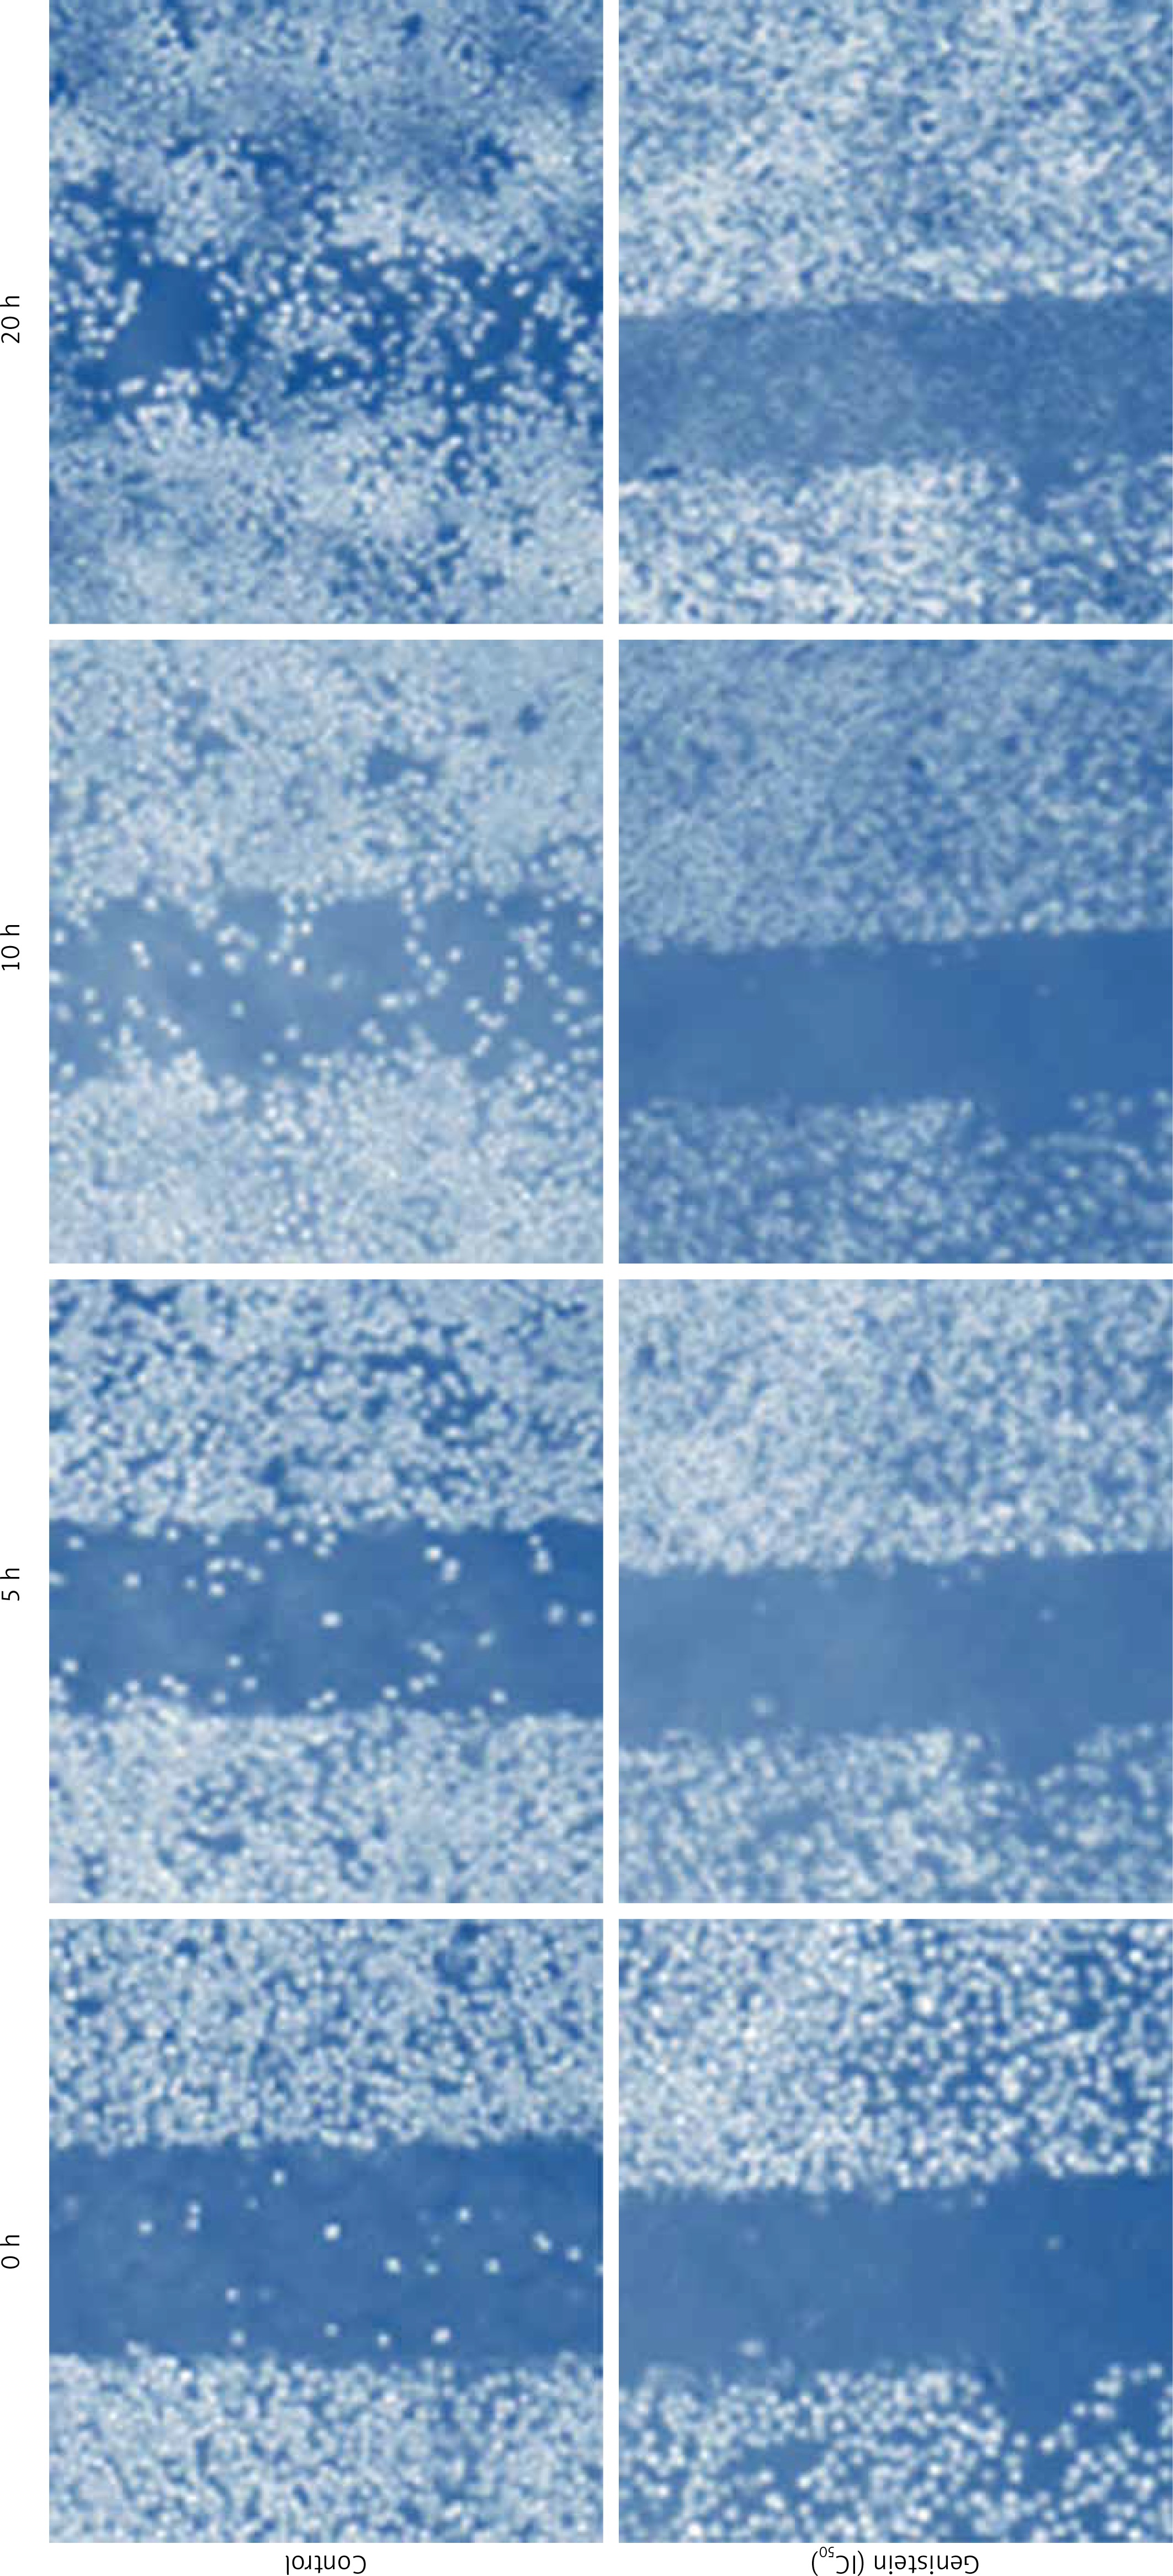
Genistein inhibited migration of HepG2 cells
Further, we examined whether genistein can inhibit the migration of HepG2 cancer cells at the IC50 concentration at different time intervals by the wound healing assay. The results of the wound healing assay showed that genistein reduced the migratory capability of the cells, as evident from the wound healing assay cells. Whereas the control cells showed fairly good capacity to migrate, treatment cells showed reduced potential to migrate, as depicted in Figure 8.
Discussion
Liver cancer is considered as one of the most prevalent malignant tumors across the globe. It accounts for about 5.6% of all new cancer cases diagnosed every year and approximately 9.1% of all cancer-related deaths worldwide [1]. The sharp increase in the incidence of liver cancer, lack of proper cure and the severe side effects associated with the synthetic drugs have made it necessary to search for new and more effective molecules. Since natural flavonoids have minimum toxicity associated with them, they are being considered as potential anticancer agents. Additionally, genistein has been shown to exhibit no cytotoxicity in vivo [8]. In the current study, genistein was evaluated against the liver cancer cell line HepG2 for its potential anticancer activity. The results indicated that the molecule exhibits significant anticancer activity against the HepG2 cell line. The cytotoxic effect of genistein was found to be dose-dependent and IC50 of genistein was found to be 25 μM against the HepG2 cell line. Moreover, genistein also reduced the colony forming tendency of the HepG2 cells. Therefore, these results suggest that genistein is a potential cytotoxic agent. One reason for apoptosis might be the observed capacity of genistein to cause cell cycle arrest, as it induced the G2/M phase increase of HepG2 cancer in a dose-dependent pattern. Cell cycle and apoptosis are known to be the main controlling mechanisms for cell growth and proliferation. Apoptotic cell death is triggered when explicit checkpoints are arrested during the cell cycle [13]. Consistent with this, several anticancer agents lead to cell cycle arrest and have been found to be clinically effective for cancer treatment [14]. Further, drugs with apoptosis-inducing properties may minimize potential drug resistance. Our results indicated that cells treated with genistein induced apoptosis in vitro in a dose-dependent manner, as was evident from DAPI staining. Although apoptosis is triggered via different routes, the mitochondrial pathway is a crucial signaling pathway in the induction of apoptosis. It is well established that Bcl-2 family proteins are frequently main players in the apoptotic pathway of mitochondrial origin. The anti-apoptotic and pro-apoptotic protein members of the Bcl-2 protein family control apoptosis by regulating mitochondrial membrane permeability [14]. Whereas Bcl-2 is a strong antiapoptotic protein, Bax is an inducer of apoptosis. Bax is present in the outer membrane of the mitochondria, facilitating the discharge of cytochrome c and stimulating caspase 9. Caspase-3 is activated by proteolytic cleavage of caspase 9 and is a key apoptotic executive caspase. Stimulation of caspase signaling and concomitant PARP cleavage are considered as the main features of the apoptotic cascade. In the present study involvement of the mitochondrial apoptotic pathway in genistein-induced cell death was first detected as the changes observed in the Bcl-2 and Bax expression levels. We observed that genistein caused cytochrome c release from the mitochondria into the cytoplasm. Protein expression analysis revealed that genistein caused considerable downregulation of Bcl-2 expression and upregulation of Bax protein, therefore ultimately favoring apoptosis. Additionally, genistein elevated caspase 3 and caspase 9 as well as cleaved PARP expression in a concentration-dependent manner. It was also observed that the genistein induced intracellular ROS alterations in HepG2 liver cells in a dose-dependent manner. The results suggest that genistein may trigger apoptosis through ROS accretion. Our results are in agreement with previous studies wherein a number of anti-cancer agents induced apoptosis in cancer cells by generating high levels of intracellular ROS [15–17]. Genistein also inhibited the cell migration of HepG2 cells, as evident from the wound healing assays. Cell migration is the key feature of cancer progression and metastasis [18, 19] and suppression of cell migration may prove essential in inhibition of metastasis in vivo. This may ensure a comparatively longer survival period of patients. Therefore, the potential of genistein for inhibition of migration of HepG2 cancer cells indicates that it may prove to be an efficient molecule in inhibiting the metastasis of cancer and deserves further in vivo evaluation.
In conclusion, we conclude that genistein exhibits significant anticancer activity against the liver HepG2 cancer cell line. The anticancer activity is due to its capacity to induce ROS mitochondrial apoptosis and cell cycle arrest. The present paves the way for in vivo evaluation of the molecule against liver cancer.