Introduction
Diabetes and osteoporosis are common chronic metabolic diseases worldwide [1–4]. Diabetes may be an important reason for osteoporotic fractures. Type 1 diabetes mellitus is known to damage bone microstructure [5]. Additionally, type 2 diabetes mellitus can damage bone microstructure by compromising matrix structure and cell function, which induce increased osteoblast apoptosis, decreased osteoblast differentiation, and increased bone resorption [6]. Clinically, persistent high glucose and glucose fluctuation are two manifestations of patients with hyperglycemia. However, the specific molecular mechanism underlying the effects of hyperglycemia on osteoporosis remains unclear [7].
Autophagy, an important pathway for degrading the damaged organelles and substances in cells, is a highly conserved cytoprotective process in which cytoplasmic contents are sequestered, transported to lysosomes by double-membrane autophagosomes and degraded [8]. It is also an adaptive response to help cells to survive various stresses, such as starvation, oxidative stress, hypoxia or infection, or even fatal stress [9, 10]. Nevertheless, excessive autophagy may result in excessive self-digestion or even death [11]. Autophagy has been reported to play an important role in the normal physiological function of bone cells. For example, Song et al. reported that autophagy activation can induce a survival response to protect bone marrow-derived mesenchymal stem cells from oxidative stress [12]. Meanwhile, autophagy is a double-edged sword. Several studies have demonstrated autophagy deficiency may lead to bone cell dysfunction. For instance, autophagy deficiency could cause declined mineralization capacity in osteoblasts, reduced cellular projections in osteocytes, and retention of organelles in osteocytes [13–15]. Among the markers of autophagy, Beclin1 is an essential protein that signals the onset of autophagy [16]. LC3-II is the only protein marker that is reliably associated with completed autophagosomes, which is typically characterized as an autophagosome marker [17]. In addition to LC3-II, P62 is also used as a protein marker of autophagic degradation [18].
Osteoblasts, the main functional cells for bone formation, play a crucial role in the maintenance of bone homeostasis. Recent studies have shown that high glucose can promote the production of reactive oxygen species (ROS), increase the oxidative stress, and impair the mitochondrial function, which lead to various complications of diabetes [19–21]. Meanwhile, production of ROS could induce apoptosis in various types of cells, such as pancreatic beta cells, endothelial cells, and osteoblasts [22–24]. ROS might affect the functions of osteoblasts, which has been confirmed by our group [25]. Additionally, Li et al. found a close correlation among ROS, autophagy and apoptosis [26]. Accumulation of ROS leads to oxidative damage, which results in mitochondrial dysfunction and cell damage [27, 28]. Meanwhile, apoptosis and autophagy both can be induced by various stress states via ROS generation [29, 30]. Although apoptosis and autophagy are two distinct processes that present clearly different biochemical and morphological features, there is a close relationship and regulatory network between them [31]. However, no previous study has investigated the role of autophagy in the hyperglycemia-induced apoptosis in osteoblasts.
Herein, we investigated the effects of high glucose (continuous high glucose and glucose fluctuation) on autophagy and apoptosis of MC3T3-E1 osteoblasts. The underlying mechanisms were further analyzed and discussed.
Material and methods
Cell culture and treatment
MC3T3-E1 osteoblasts were obtained from the Chinese Center for Type Culture Collection (Shanghai, China). Cells were cultured in α-Minimum Essential Medium (α-MEM, HyClone, USA) supplemented with 10% fetal bovine serum (PAN Biotech, Aidenbach, Germany), 1% sodium pyruvate (Solarbio, Beijing, China) and 1% penicillin/streptomycin (Beyotime, Shanghai, China) in a humidified incubator with 5% CO2 at 37°C. Cells were treated with different concentrations of D-glucose (Sigma, St. Louis, MO, USA): 5.5 mM for the control group (Ctr group), 25 mM for the high glucose group (HG group) and 5.5/25 mM for the glucose fluctuation group (GF group). N-acetylcysteine (NAC, 2 mM, Beyotime, Shanghai, China) and chloroquine (CQ, 10 μM, Sigma, St Louis, MO, USA) were used as an antioxidant and autophagy inhibitor, respectively. The medium, containing different concentrations of D-glucose and NAC/CQ, in each group was changed every eight hours. All the treatment in this study lasted for 48 h.
Cell Counting Kit-8 assay (CCK-8)
The CCK-8 kit (Dojindo, Kumamoto, Japan) is a highly sensitive, non-radioactive colorimetric method for determining the number of living cells in a cell proliferation experiment. The amount of formazan produced, which can be detected by a microplate reader, is directly proportional to the number of living cells. Briefly, MC3T3-E1 cells were seeded in 96-well plates at a density of 5 × 10³ per well, and each sample was repeated six times. After incubation for 48 h, 10 μl of CCK-8 solution was added to each well and incubated for another 1–4 h. Then, the optical density (OD) at 450 nm was measured by the microplate reader.
Flow cytometry
Apoptosis was measured with an Annexin V-FITC/PI Apoptosis Detection Kit (Tianjin Sungene Biotech, China). Cells were collected and suspended with 400 μl 1 × binding buffer. Then, 5 μl of Annexin V-FITC was added to the cell suspension and incubated at 2–8°C for 15 min. After that, 10 μl of PI was added and incubated for 5 min at 2–8°C in the dark. Finally, cells were analyzed by flow cytometry (BD FACS Vantage SE). Annexin V-positive/PI-positive cells were considered as late apoptotic or necrotic cells.
Measurement of ROS and MitoSOX
Intracellular and mitochondrial ROS were detected by the 2’, 7’-dichlorofluorescein diacetate (DCFH-DA) fluorescent probe (Beyotime, China) and MitoSOX Red (Invitrogen, USA), a mitochondrial superoxide indicator, respectively. Cells were plated at a density of 104/well in a 12-well plate. After incubation for 24 h, cells were respectively treated with different concentrations of glucose with or without NAC for another 48 h.
According to the instructions for the DCFH-DA fluorescent probe, cells were first washed with basal medium and then incubated with a diluted DCFH-DA probe solution (1 : 1000). During 30 min incubation, the plate was gently shaken every 5–10 min three times. Later, the cells were washed with basal medium again and the green fluorescence intensity was observed by inverted fluorescence microscope (ZEISS, Germany).
For analysis of the mitochondrial ROS, cells were seeded on a glass coverslip in 12-well plates and treated with different concentrations of glucose. After washing with PBS, cells were loaded with 0.5–1.0 ml of MitoSOX (5 μM) solution for 10 min at 37°C and then washed with buffer three times. MitoTracker was used to localize the mitochondria and its fluorescence intensity was observed by fluorescence microscope (ZEISS, Germany).
JC-1 staining analysis
To detect the mitochondrial transmembrane potential (ΔΨm) of MC3T3-E1 osteoblasts in each group, JC-1 staining was performed. Cells were seeded on the slides in a 12-well plate. After 48 h of treatment, the culture medium was discarded, and the cells were washed with PBS. Then, 1 ml of fresh medium and 1 ml of JC-1 staining working solution were added to each well, and the plate was incubated at 37°C for 20 min. Later, the plate was washed twice with pre-chilled JC-1 staining buffer (1×) and 2 ml of fresh medium was added to each well. The fluorescence microscope (ZEISS, Germany) was used to observe the red and green fluorescence. Carbonyl cyanide 3-chlorophenylhydrazone (CCCP) was used as a positive control.
Western blot
Osteoblasts were lysed in RIPA lysis buffer with protease inhibitors (Beyotime, Shanghai, China). Proteins were collected after centrifugation. The protein concentrations were determined by BCA Protein Assay Kit (Beyotime, China). The protein samples were subjected to SDS-PAGE (8–12%), and then transferred onto PVDF membranes (Millipore, Germany). After blocking with 5% skimmed milk (Bio-Rad, USA) for at least 1 h, the membranes were incubated with primary antibodies overnight at 4°C, including rabbit anti-LC3 antibody (1 : 1000, Novus), rabbit anti-Bnip3 antibody (1 : 2000, Abcam), rabbit anti-P62 antibody (1 : 1000, Abcam), rabbit anti-Beclin1antibody (1 : 1000, Abcam), mouse anti-caspase 3 antibody (1 : 500, Santa Cruz), rabbit anti-cleaved caspase 3 antibody (1 : 1000, CST), rabbit anti-Bcl-2 antibody (1 : 1000, CST), rabbit anti-Bax antibody (1 : 1000, CST) and mouse anti-β-actin antibody (1 : 8000, Tianjin Sungene Biotech). Depending on the origin of the primary antibodies, the secondary antibody (1 : 7000 – 1 : 10000) was added and incubated for 1 h at room temperature. The intensities of bands were quantified with Fusion software (VILBER LOURMAT, Germany). All the results were normalized to β-actin.
Immunofluorescence assay
MC3T3-E1 osteoblasts were seeded on pre-coated glass coverslips and treated with different glucose concentrations. Then the coverslips were washed with PBS, fixed in 4% paraformaldehyde for 30 min, permeabilized with 0.25% Triton for 15 min, and blocked with 5% bovine serum albumin for 1 h at room temperature. The cells were incubated with primary antibodies against LC3 (1 : 200) and P62 (1 : 200) overnight at 4°C, followed by incubation with the matching biotinylated secondary antibody for 1 h in the dark at room temperature. Then, nucleus was stained with 4,6-diamidino-2-phenylindole (DAPI) for 5 min, and the fluorescence intensity was observed under the fluorescence microscope.
Transmission electron microscopy (TEM) analysis
Cells (at least 106/group) were collected and fixed with glutaraldehyde. The samples were observed and photographed using TEM (H-7500, Hitachi Company, Japan). Autophagic vacuoles were counted from four randomly selected fields, and the autophagic vacuoles per field were presented as mean ± SEM.
Statistical analysis
Data were analyzed using GraphPad Prism Version7.0a software (GraphPad Software, San Diego, CA, USA). Multiple group analysis was performed by one-way ANOVA or two-way ANOVA. Independent experiments were performed three times. The data were expressed as mean ± SEM. The value of p < 0.05 was considered statistically significant.
Results
High glucose and glucose fluctuation decrease proliferation and induce apoptosis in osteoblasts
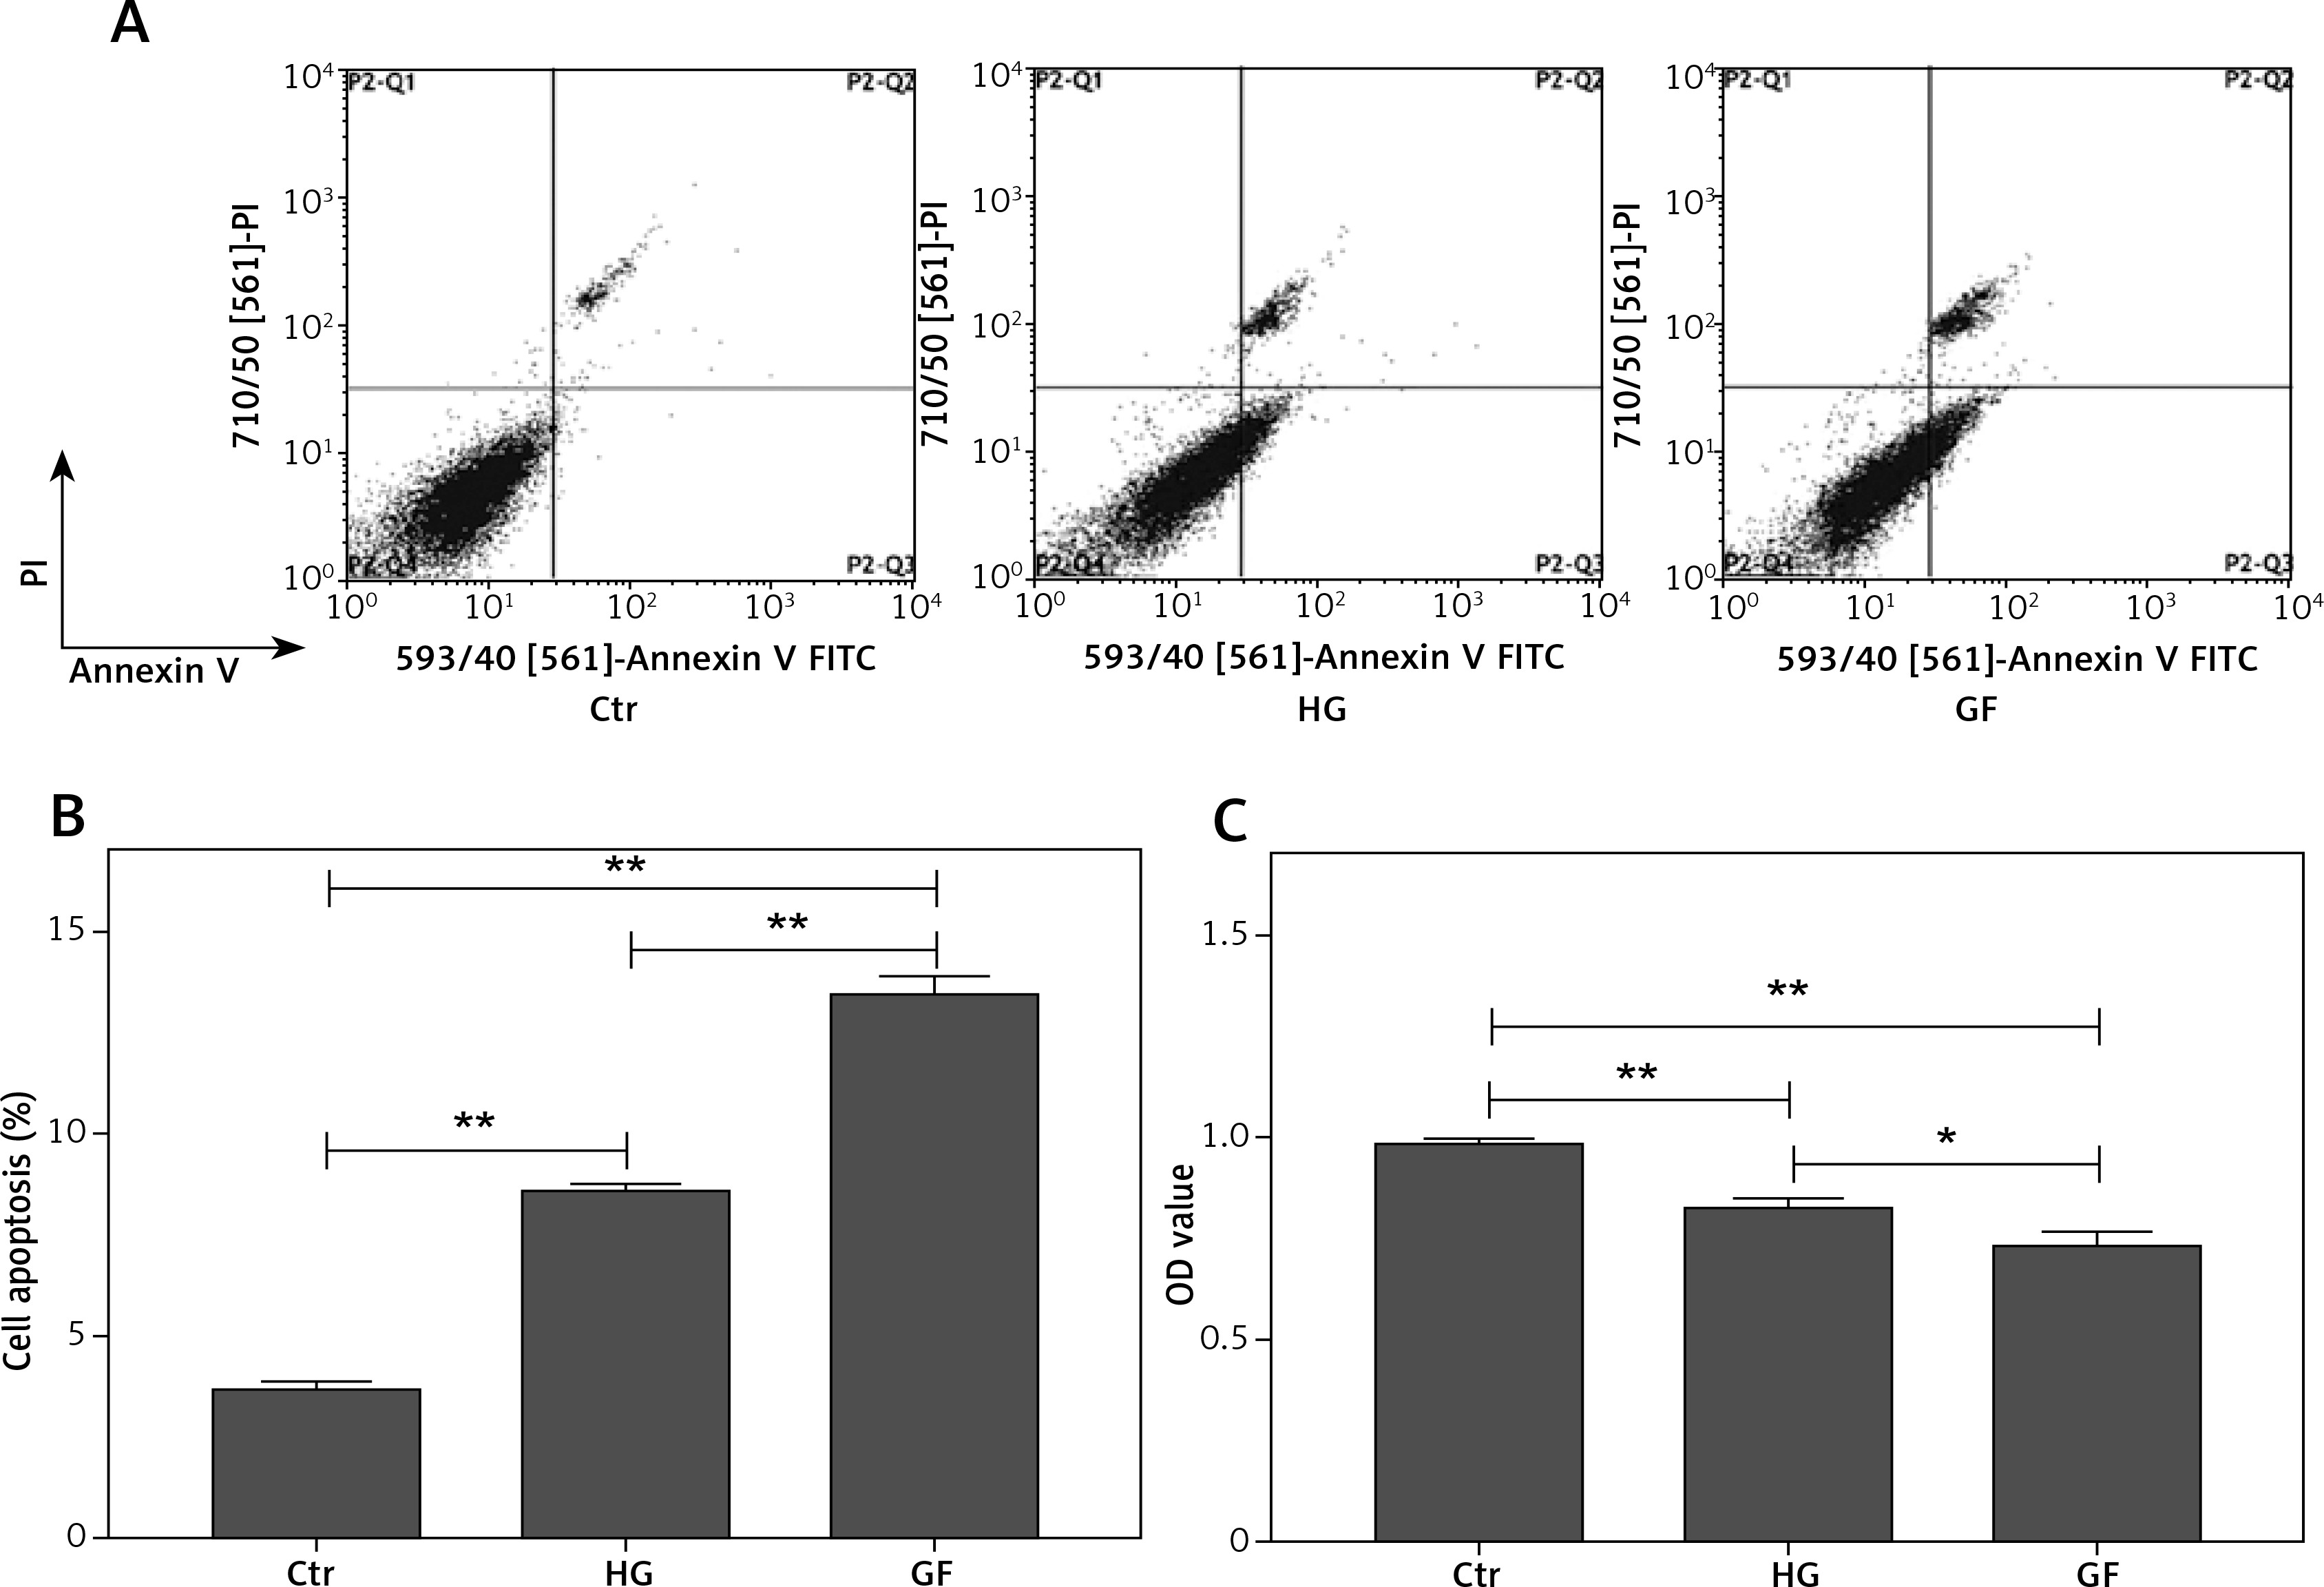
To test the effects of high glucose and glucose fluctuation on the apoptosis and proliferation of osteoblasts, flow cytometry and CCK-8 assay, respectively, were performed. The late apoptotic rates of the HG group and the GF group were 2.3- and 3.7-fold those of the control group, respectively (p < 0.01, Figures 1 A and B) and the proliferation rates of the HG group and the GF group were significantly lower, especially the GF group (p < 0.01, Figure 1 C). Compared with the HG group, the GF group had a significantly higher apoptosis rate (p < 0.01, Figure 1 B) but a significantly lower OD value, which indicates a lower cell proliferation rate (p < 0.05, Figure 1 C). These results indicate that high glucose and glucose fluctuation could inhibit proliferation and induce apoptosis in the osteoblasts.
Figure 1
Effects of high glucose and glucose fluctuation on apoptosis and proliferation of osteoblasts. A – Cell apoptosis rate was analyzed by flow cytometry after Annexin V/PI staining. B – The late apoptotic rate was quantified and shown. C – CCK-8 assay was used to detect cell proliferation. OD value = optical density value. One-way ANOVA was used to analyze the data. Independent experiments were performed three times. Data are expressed as the mean ± SEM; *p < 0.05, **p < 0.01
High glucose and glucose fluctuation induce oxidative stress and mitochondrial damage in osteoblasts
To assess the effect of high glucose and glucose fluctuation on the ROS production in the osteoblasts, the ROS-sensitive fluorescent probe DCFH-DA and MitoSOX were used. There was an increase of fluorescence intensity in the HG and GF groups, especially in the latter (Figure 2 A). Thus, high glucose and glucose fluctuation might promote the intracellular and mitochondrial ROS production.
Figure 2
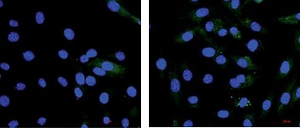
Effects of high glucose and glucose fluctuation on ROS and ΔΨm of osteoblasts. A – Fluorescence images of ROS detected by DCFH-DA probe (green), and immunofluorescence images of mitochondrial ROS detected by MitoSOX. In the lower panel, fluorescence of green and red was MitoTracker and MitoSOX in each group (200×; scale bar = 100mm). B – ΔΨm was analyzed by JC-1 staining. Representative images are shown (200×; scale bar = 100 mm). CCCP: Carbonyl cyanide 3-chlorophenylhydrazone
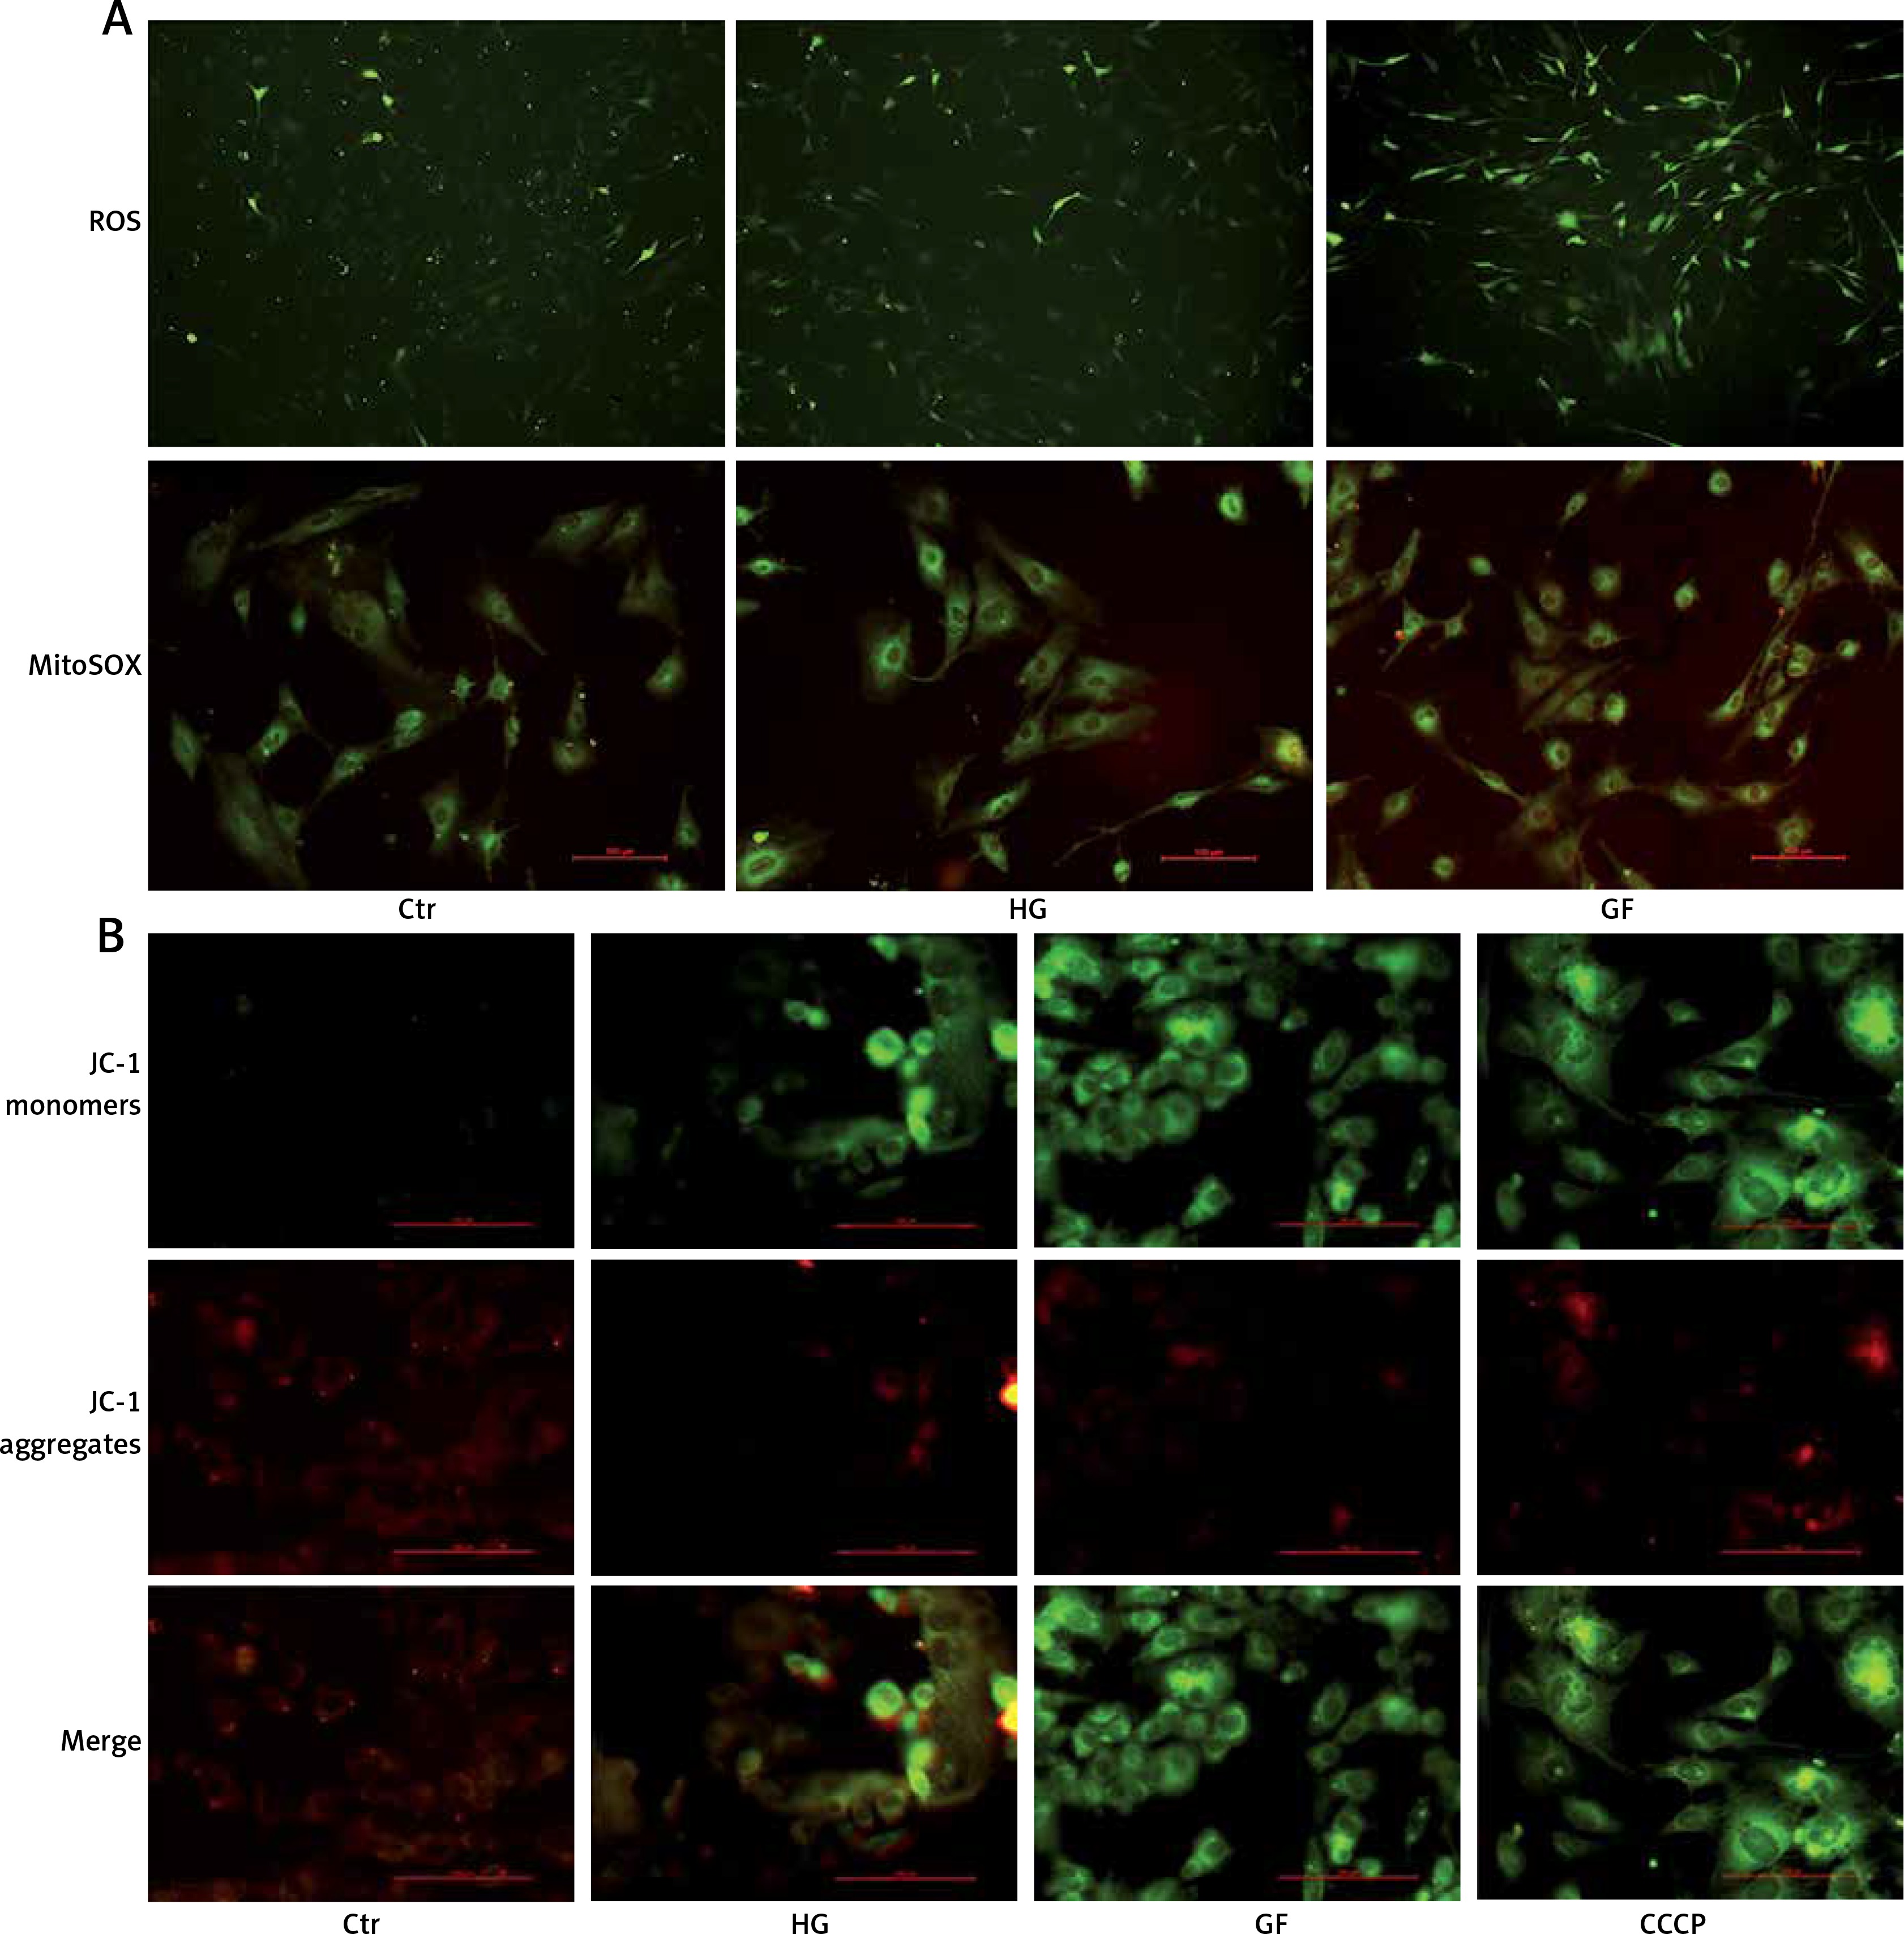
As reported by Pérez et al., intracellular mitochondrial damage was usually accompanied by a decrease of ΔΨm [32], which could be monitored by the fluorescent probe JC-1. In the control group, there were a lot of JC-1 aggregates shown as red fluorescence, and a small number of JC-1 monomers shown as green fluorescence, whereas there were more JC-1 monomers and fewer JC-1 aggregates in the HG and GF groups, which were similar to the CCCP group (positive control) (Figure 2 B). The green fluorescence intensity in the GF group was dramatically lower than in the control group and the HG group, indicating that high glucose and glucose fluctuation could cause ΔΨm reduction and mitochondrial damage in the osteoblasts.
High glucose and glucose fluctuation induce autophagy in osteoblasts
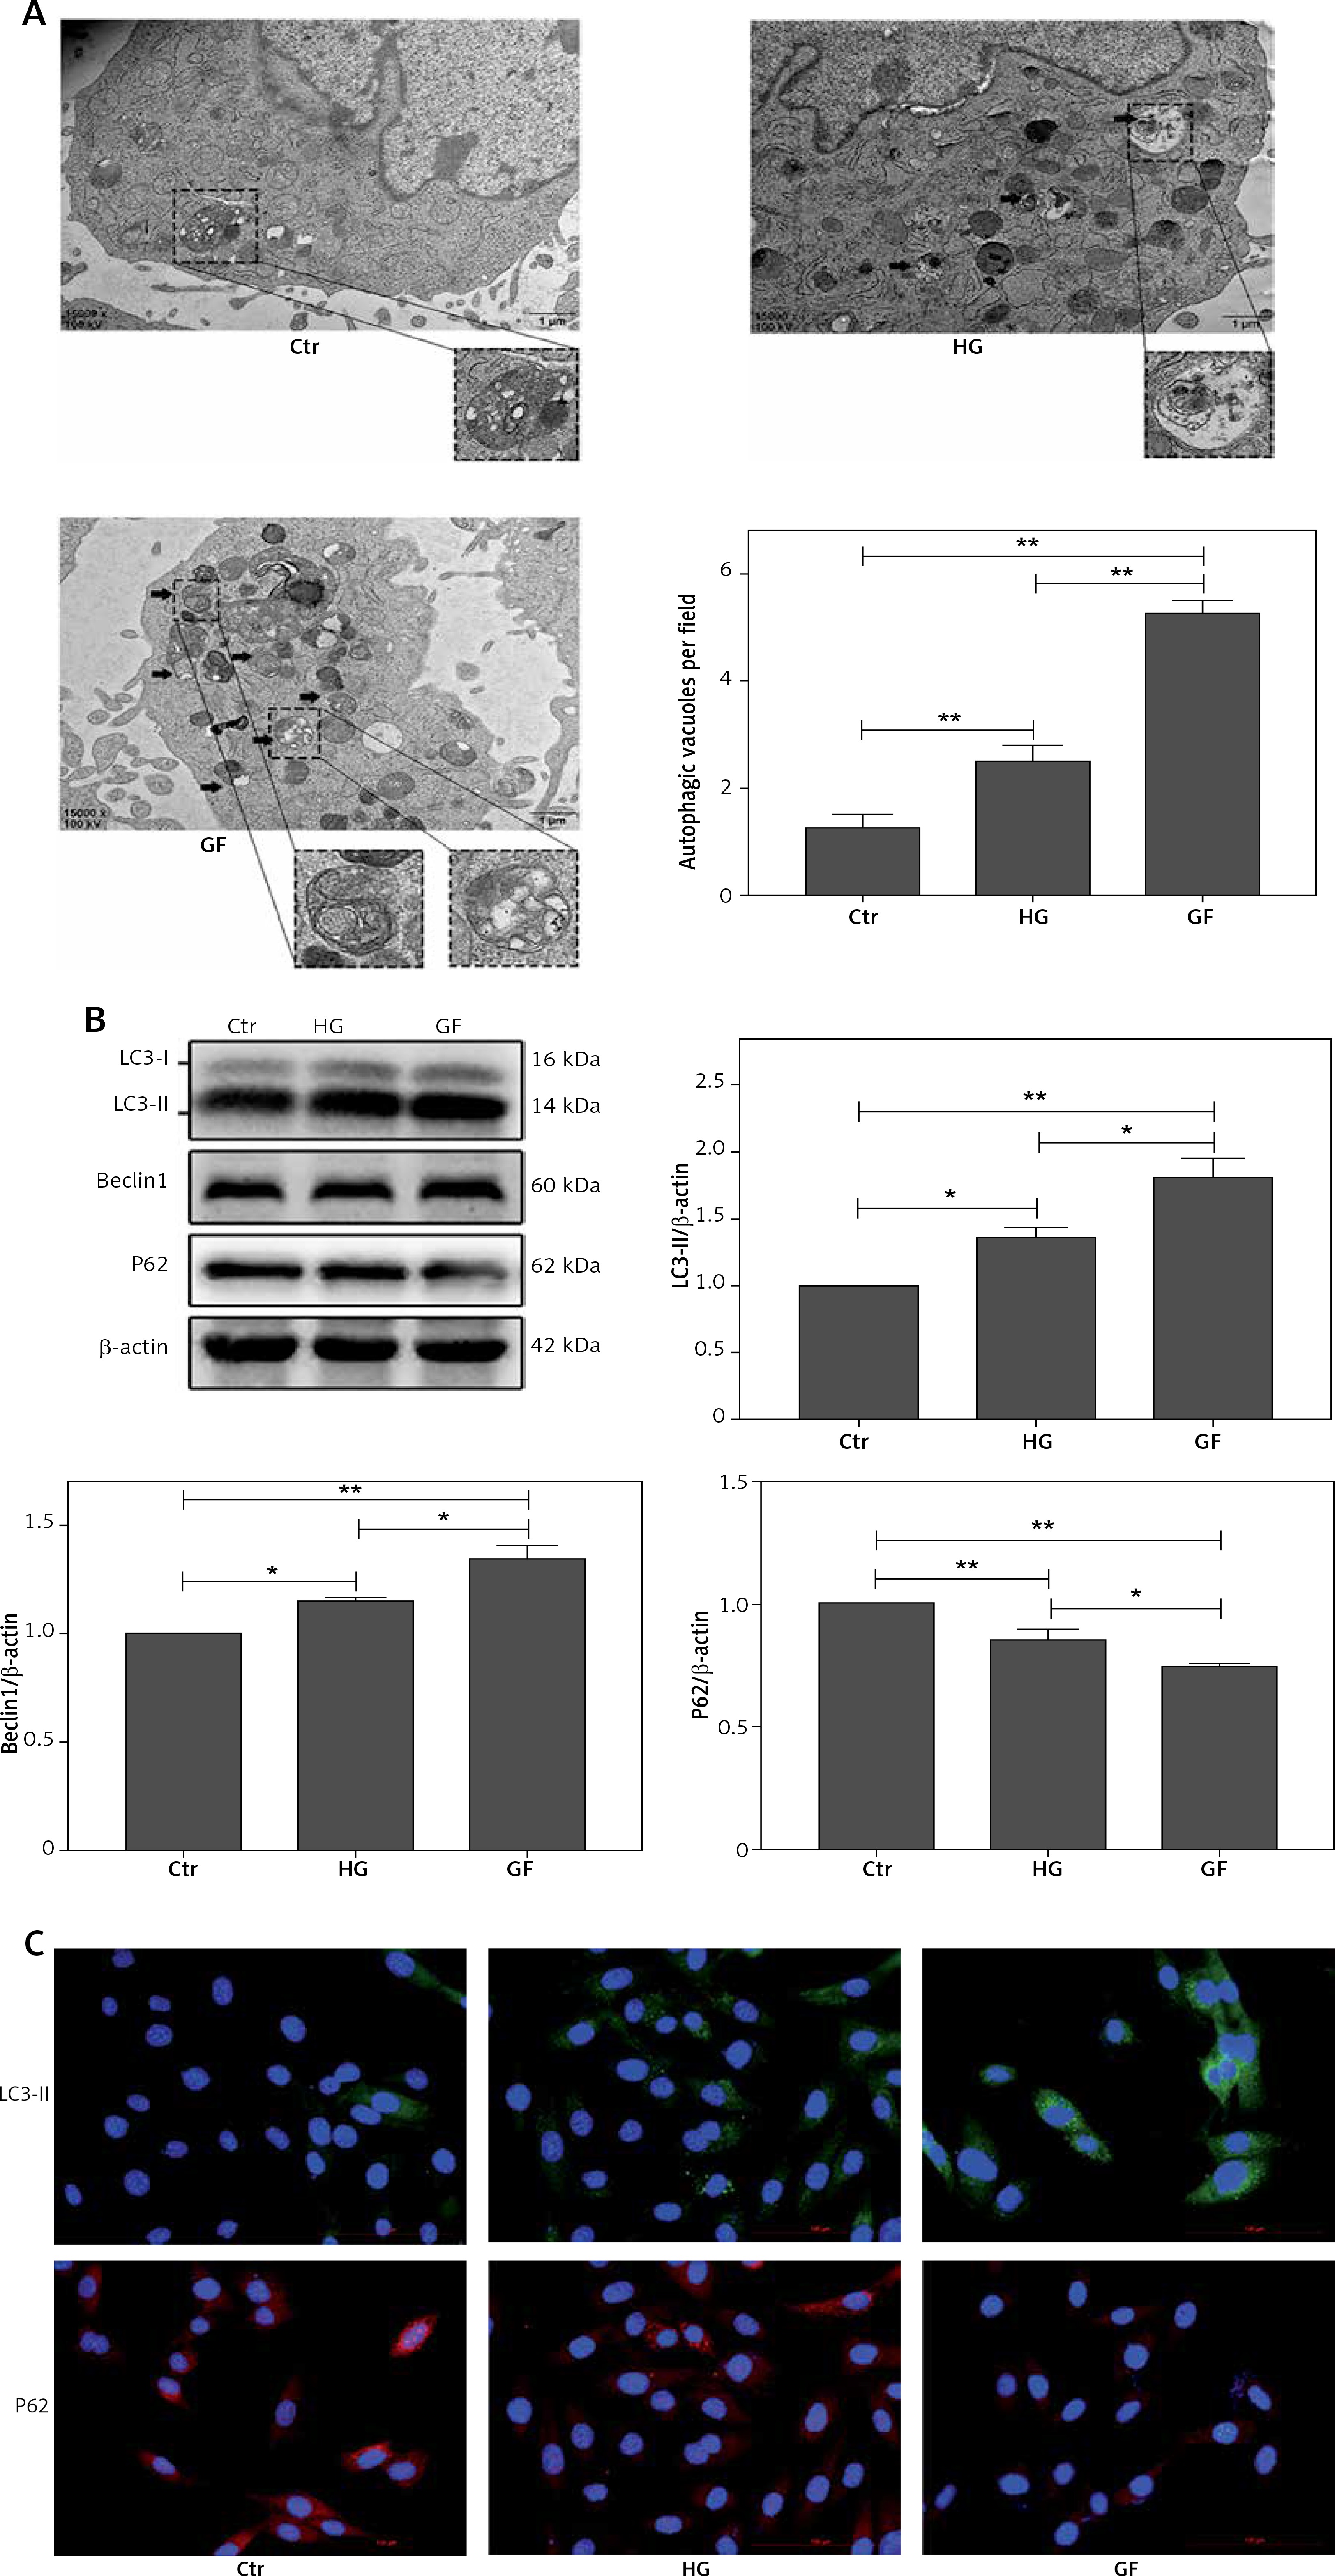
To investigate whether the high glucose and glucose fluctuation may induce autophagy in the osteoblasts, we performed TEM, western blot, and immunofluorescence, respectively. Autophagosomes are autophagy vesicles with an acidic double-membrane structure [33]. The TEM results showed more autophagosomes in the GF group than in the HG group and the control group (Figure 3 A). The protein expression of LC3-II and Beclin1 were increased in the osteoblasts, while the expression of p62 expression was apparently decreased, as determined by Western blot. Compared with high glucose treatment, the glucose fluctuation treatment could significantly increase the protein level of LC3-II and Beclin1, and decreased p62 expression (Figure 3 B). Immunofluorescence showed that LC3-II expression was increased, while p62 expression was decreased in HG and GF groups (Figure 3 C). These findings reveal that high glucose and glucose fluctuation, especially glucose fluctuation, may induce autophagy in the osteoblasts.
Figure 3
Effect of high glucose and glucose fluctuation on autophagy in the osteoblasts. A – Representative transmission electron micrographs of the osteoblasts and data of autophagic vacuoles per field are shown (15000×, scale bar = 1 mm). B – Western blot was used to analyze the expression of autophagy related proteins. Representative Western blot and quantitative analysis of the protein level of LC3, Beclin1 and p62 in the osteoblasts after different treatments are shown. One-way ANOVA was used to analyze the data. Independent experiments were performed three times. Data are expressed as the mean ± SEM; *p < 0.05, **p < 0.01. C – Immunofluorescence assay (200×, scale bare = 100 mm) was used to show the expression of LC3-II and p62. Fluorescence of blue, green and red was DAPI, LC3-II and p62, respectively
Role of oxidative stress on autophagy in osteoblasts
N-acetylcysteine, an antioxidant reagent, is reported to decrease the production of ROS in the osteoblasts [25]. To determine ROS level after NAC treatment, a DCFH-DA probe was used. As shown in Figure 4 A, the fluorescence intensity of ROS in the HG + NAC and GF + NAC groups was apparently lower than that in the HG and GF groups.
Figure 4
Effects of NAC on ROS production and autophagy-related proteins. A – Representative images of ROS detected by DCFH-DA probe (200×). B – Representative Western blot and C – quantitative analysis of LC3-II, Beclin1, p62, Bnip3, p-Akt/Akt and p-mTOR/mTOR induced by high glucose and glucose fluctuation w/wo the presence of NAC. Two-way ANOVA was used to analyze the data. Independent experiments were performed three times. Data are expressed as the mean ± SEM; *p < 0.05, **p < 0.01
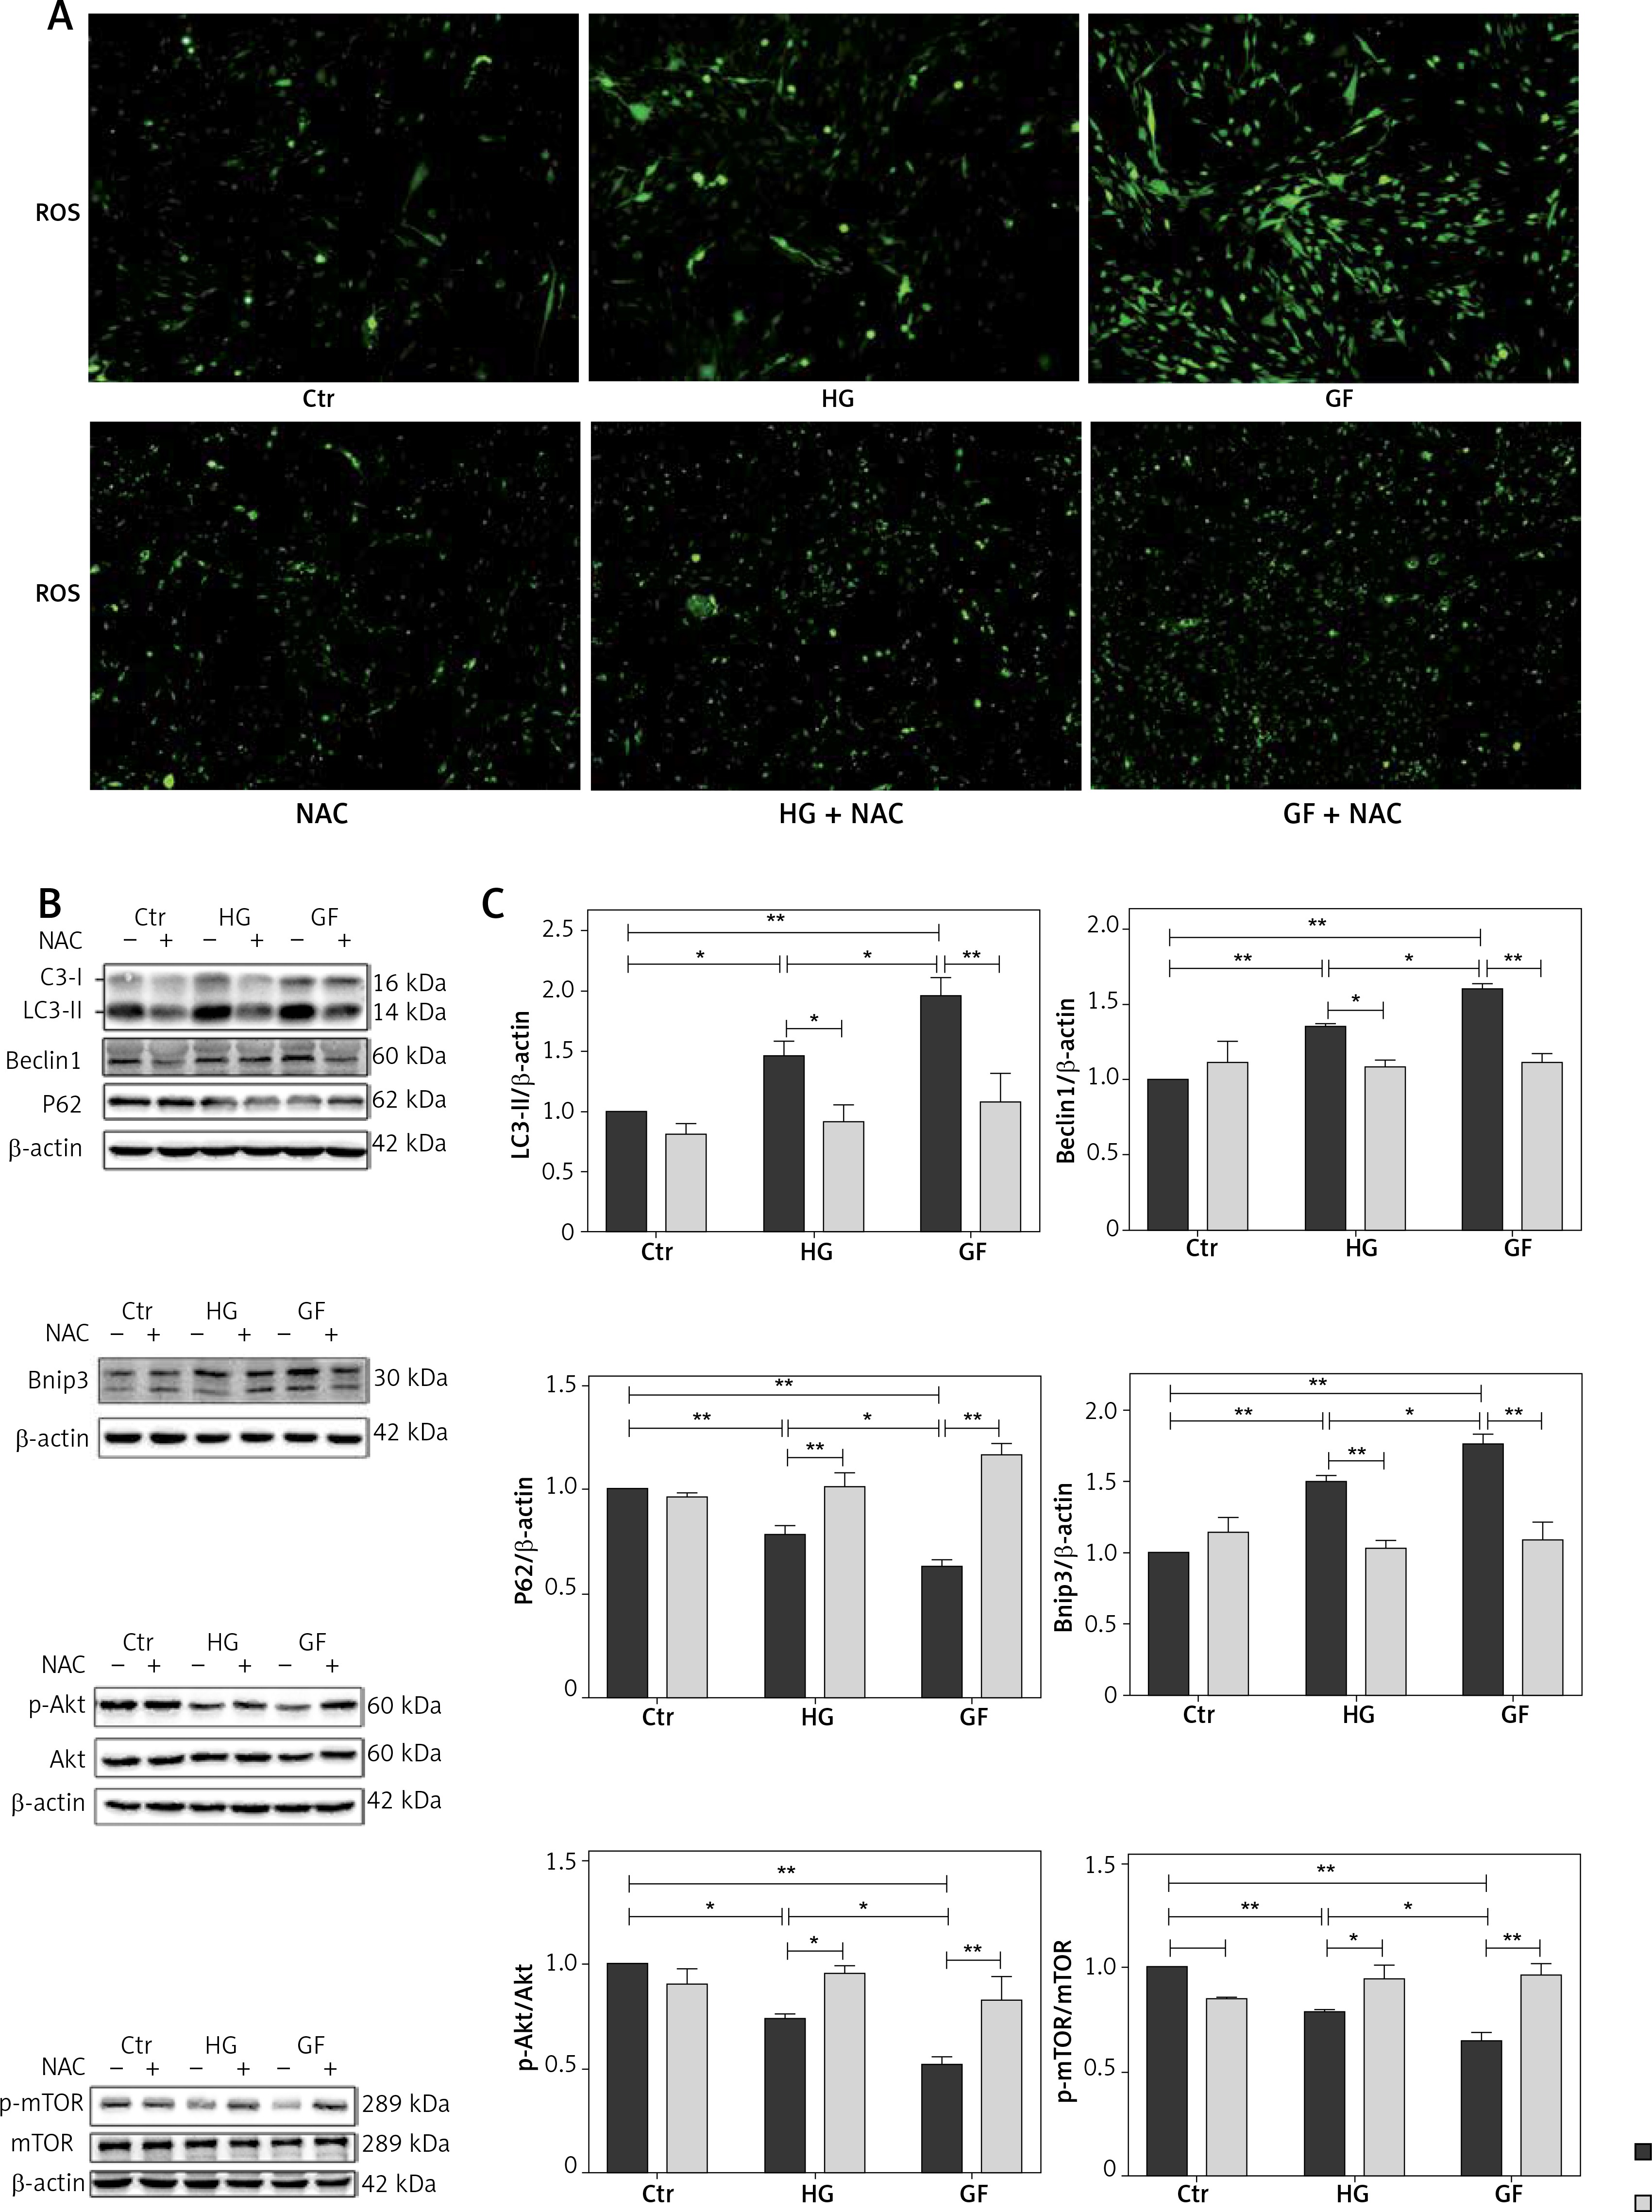
To test the role of oxidative stress on autophagy in the osteoblasts, cells were firstly incubated with NAC and then protein levels were detected by Western blot. Compared with the respective HG and GF group, NAC reduced the expression of LC3-II, Beclin1 and Bnip3 and increased p62 expression in the HG + NAC group and GF + NAC group (Figures 4 B and C). In addition, the expression of p-Akt and p-mTOR in both HG and GF groups, especially in the GF group, was lower than in the control group, while NAC abolished this effect (Figures 4 B and C). These results suggest that the autophagy induced by high glucose and glucose fluctuation is inhibited after the decrease of oxidative stress by NAC.
Effects of oxidative stress and autophagy on apoptosis in osteoblasts
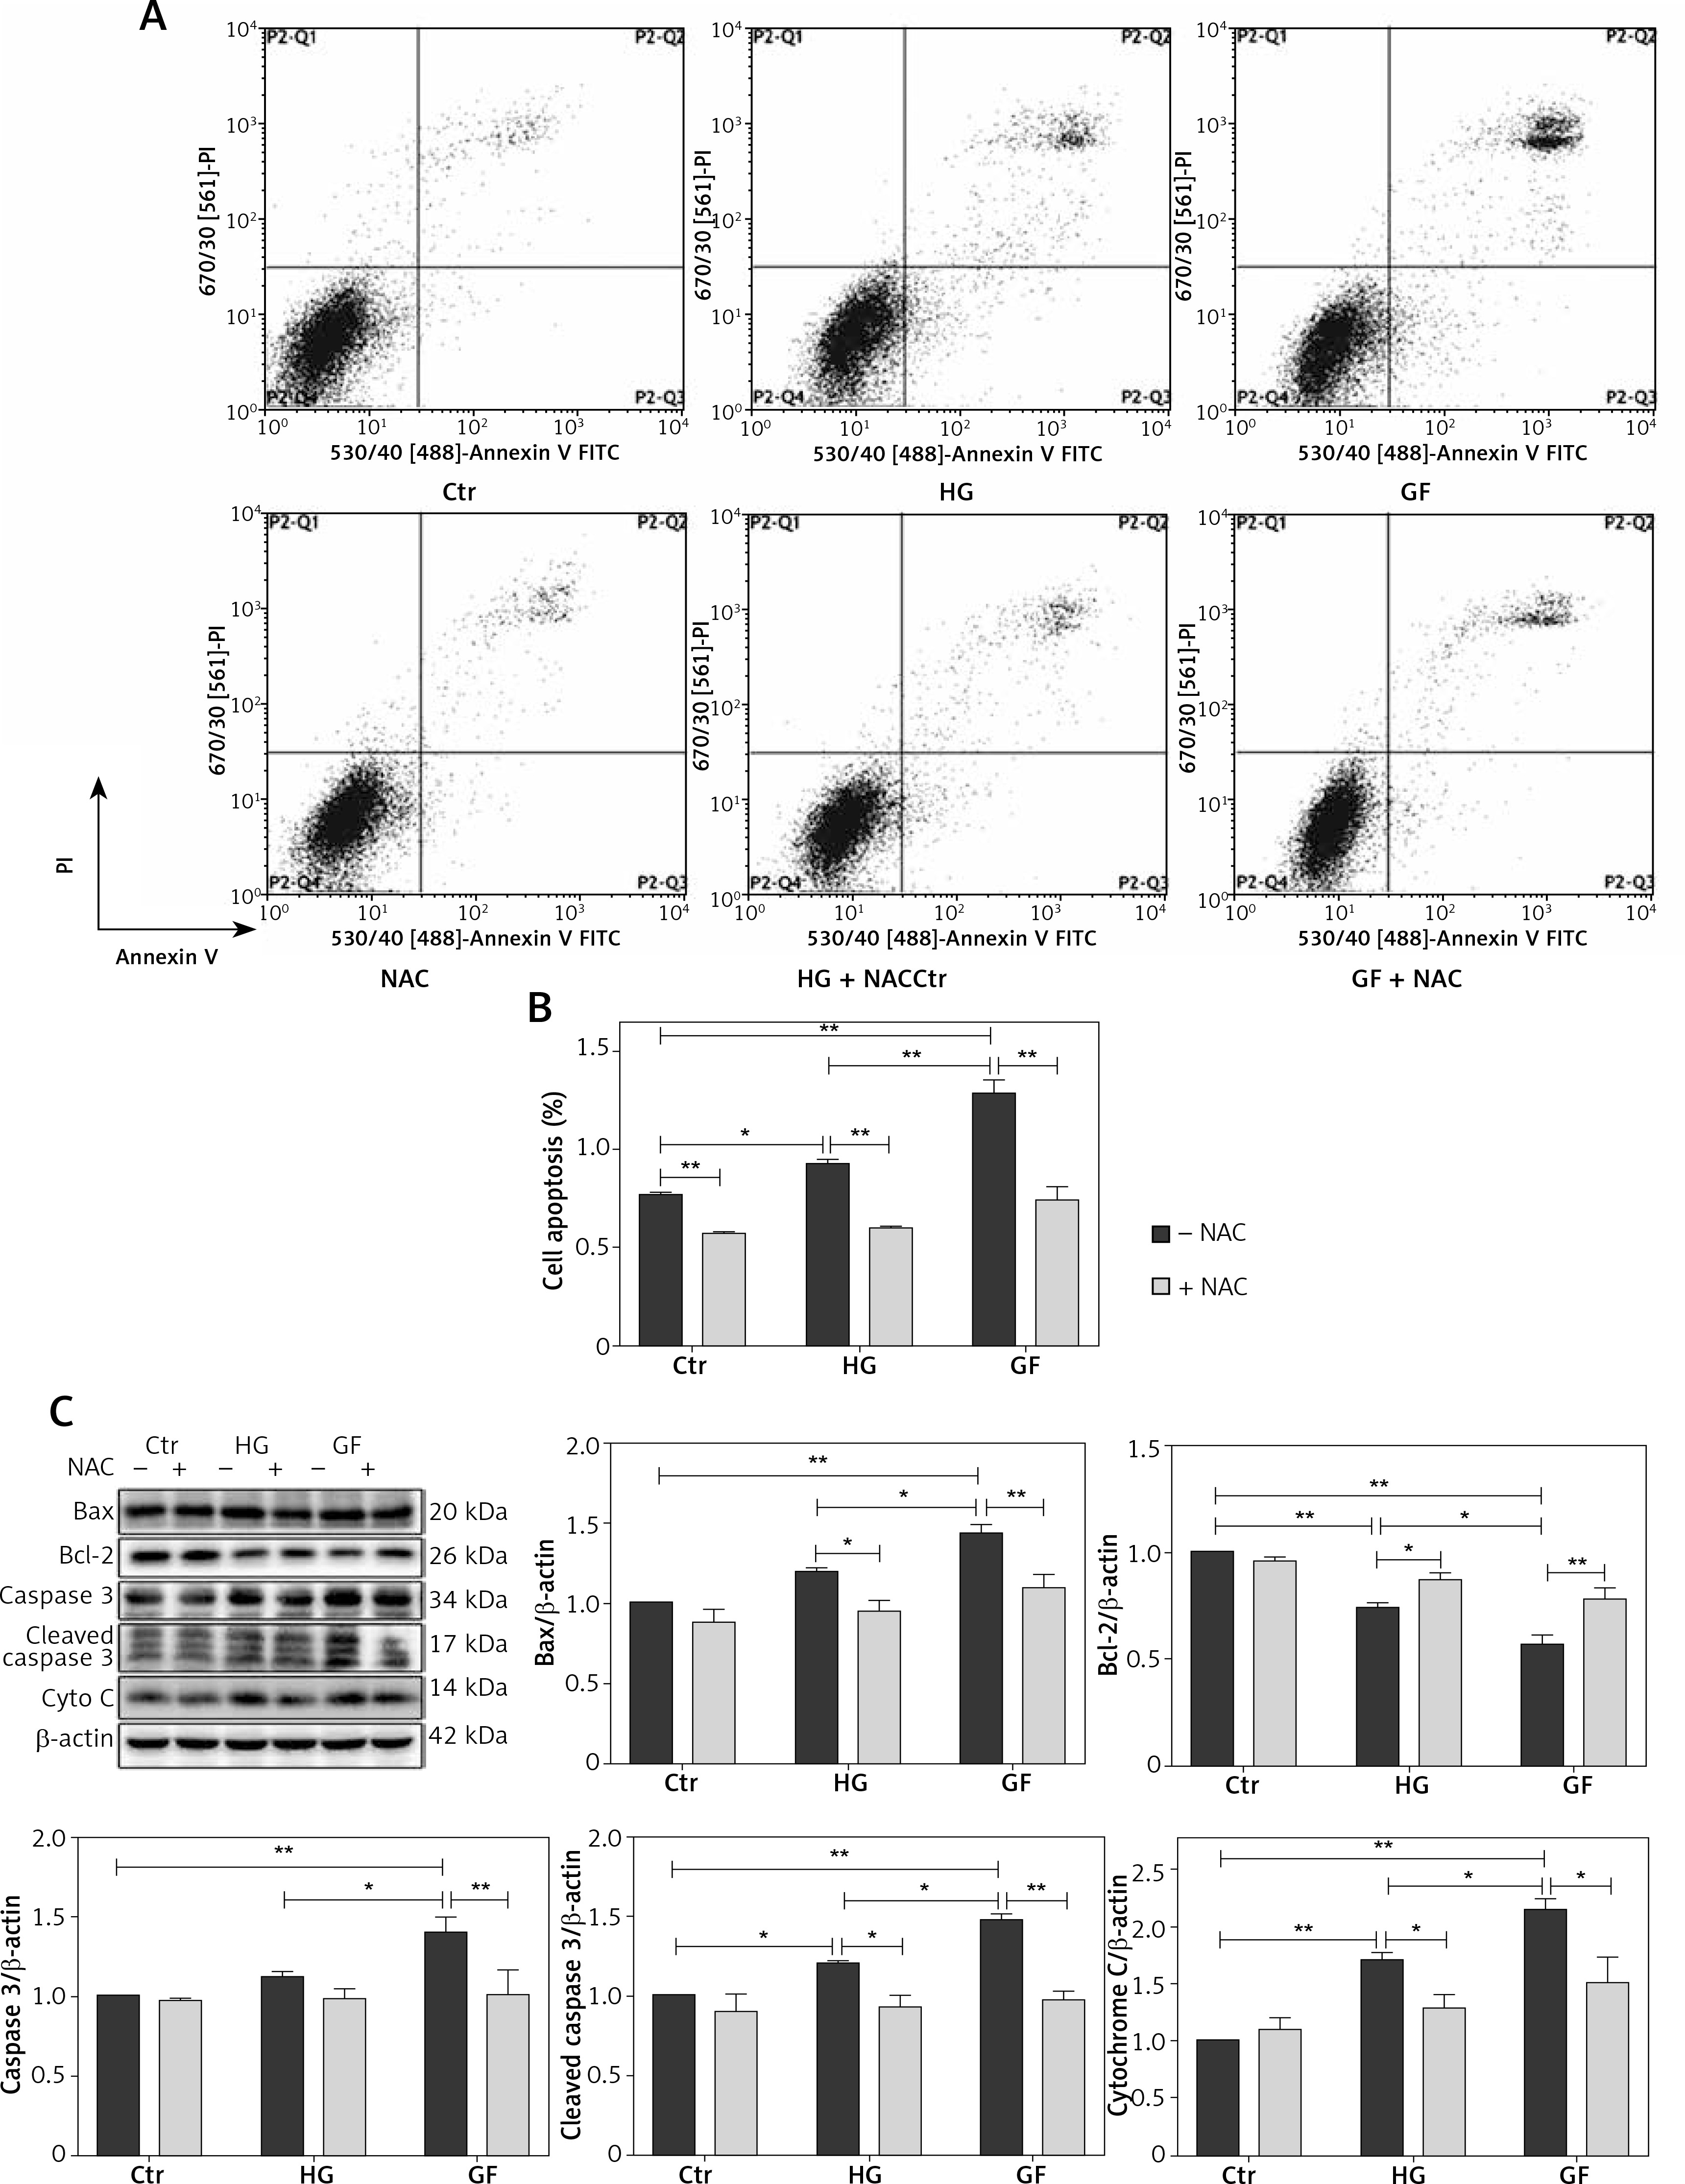
We previously demonstrated that high glucose and glucose fluctuation could induce apoptosis, oxidative stress and autophagy, while NAC could attenuate oxidative stress and inhibit autophagy. To further determine the effects of oxidative stress and autophagy on the apoptosis of osteoblasts, we used flow cytometry to test the apoptosis of osteoblasts treated with high glucose or glucose fluctuation in the presence or absence of NAC and CQ. Compared with the HG and GF groups, NAC significantly decreased their apoptotic rates (Figures 5 A and B, p < 0.01). Meanwhile, Bcl-2 protein expression was lower in the HG and GF groups in comparison to the control group, while Bax, caspase 3, cleaved caspase 3 and cytochrome C expression levels were significantly increased (Figure 5 C). Compared with the HG group, the protein level of Bcl-2 was much lower in the GF group, while the levels of Bax, caspase 3, cleaved caspase 3 and cytochrome C expression were much higher. However, NAC attenuated these effects (Figure 5 C).
Figure 5
The role of oxidative stress in apoptosis of osteoblasts. A – Flow cytometry was used to test the apoptotic rates of osteoblasts after different treatments. B – Quantification of apoptotic rates induced by high glucose and glucose fluctuation w/wo the presence of NAC. C – Western blot analysis of apoptosis-related proteins induced by high glucose and glucose fluctuation w/wo the presence of NAC. Quantitative analysis of Bax, Bcl-2, caspase 3, cleaved caspase 3 and cytochrome c protein levels in the absence or presence of NAC. Two-way ANOVA was used to analyze the data. Independent experiments were performed three times. The data are expressed as the mean ± SEM; *p < 0.05, **p < 0.01
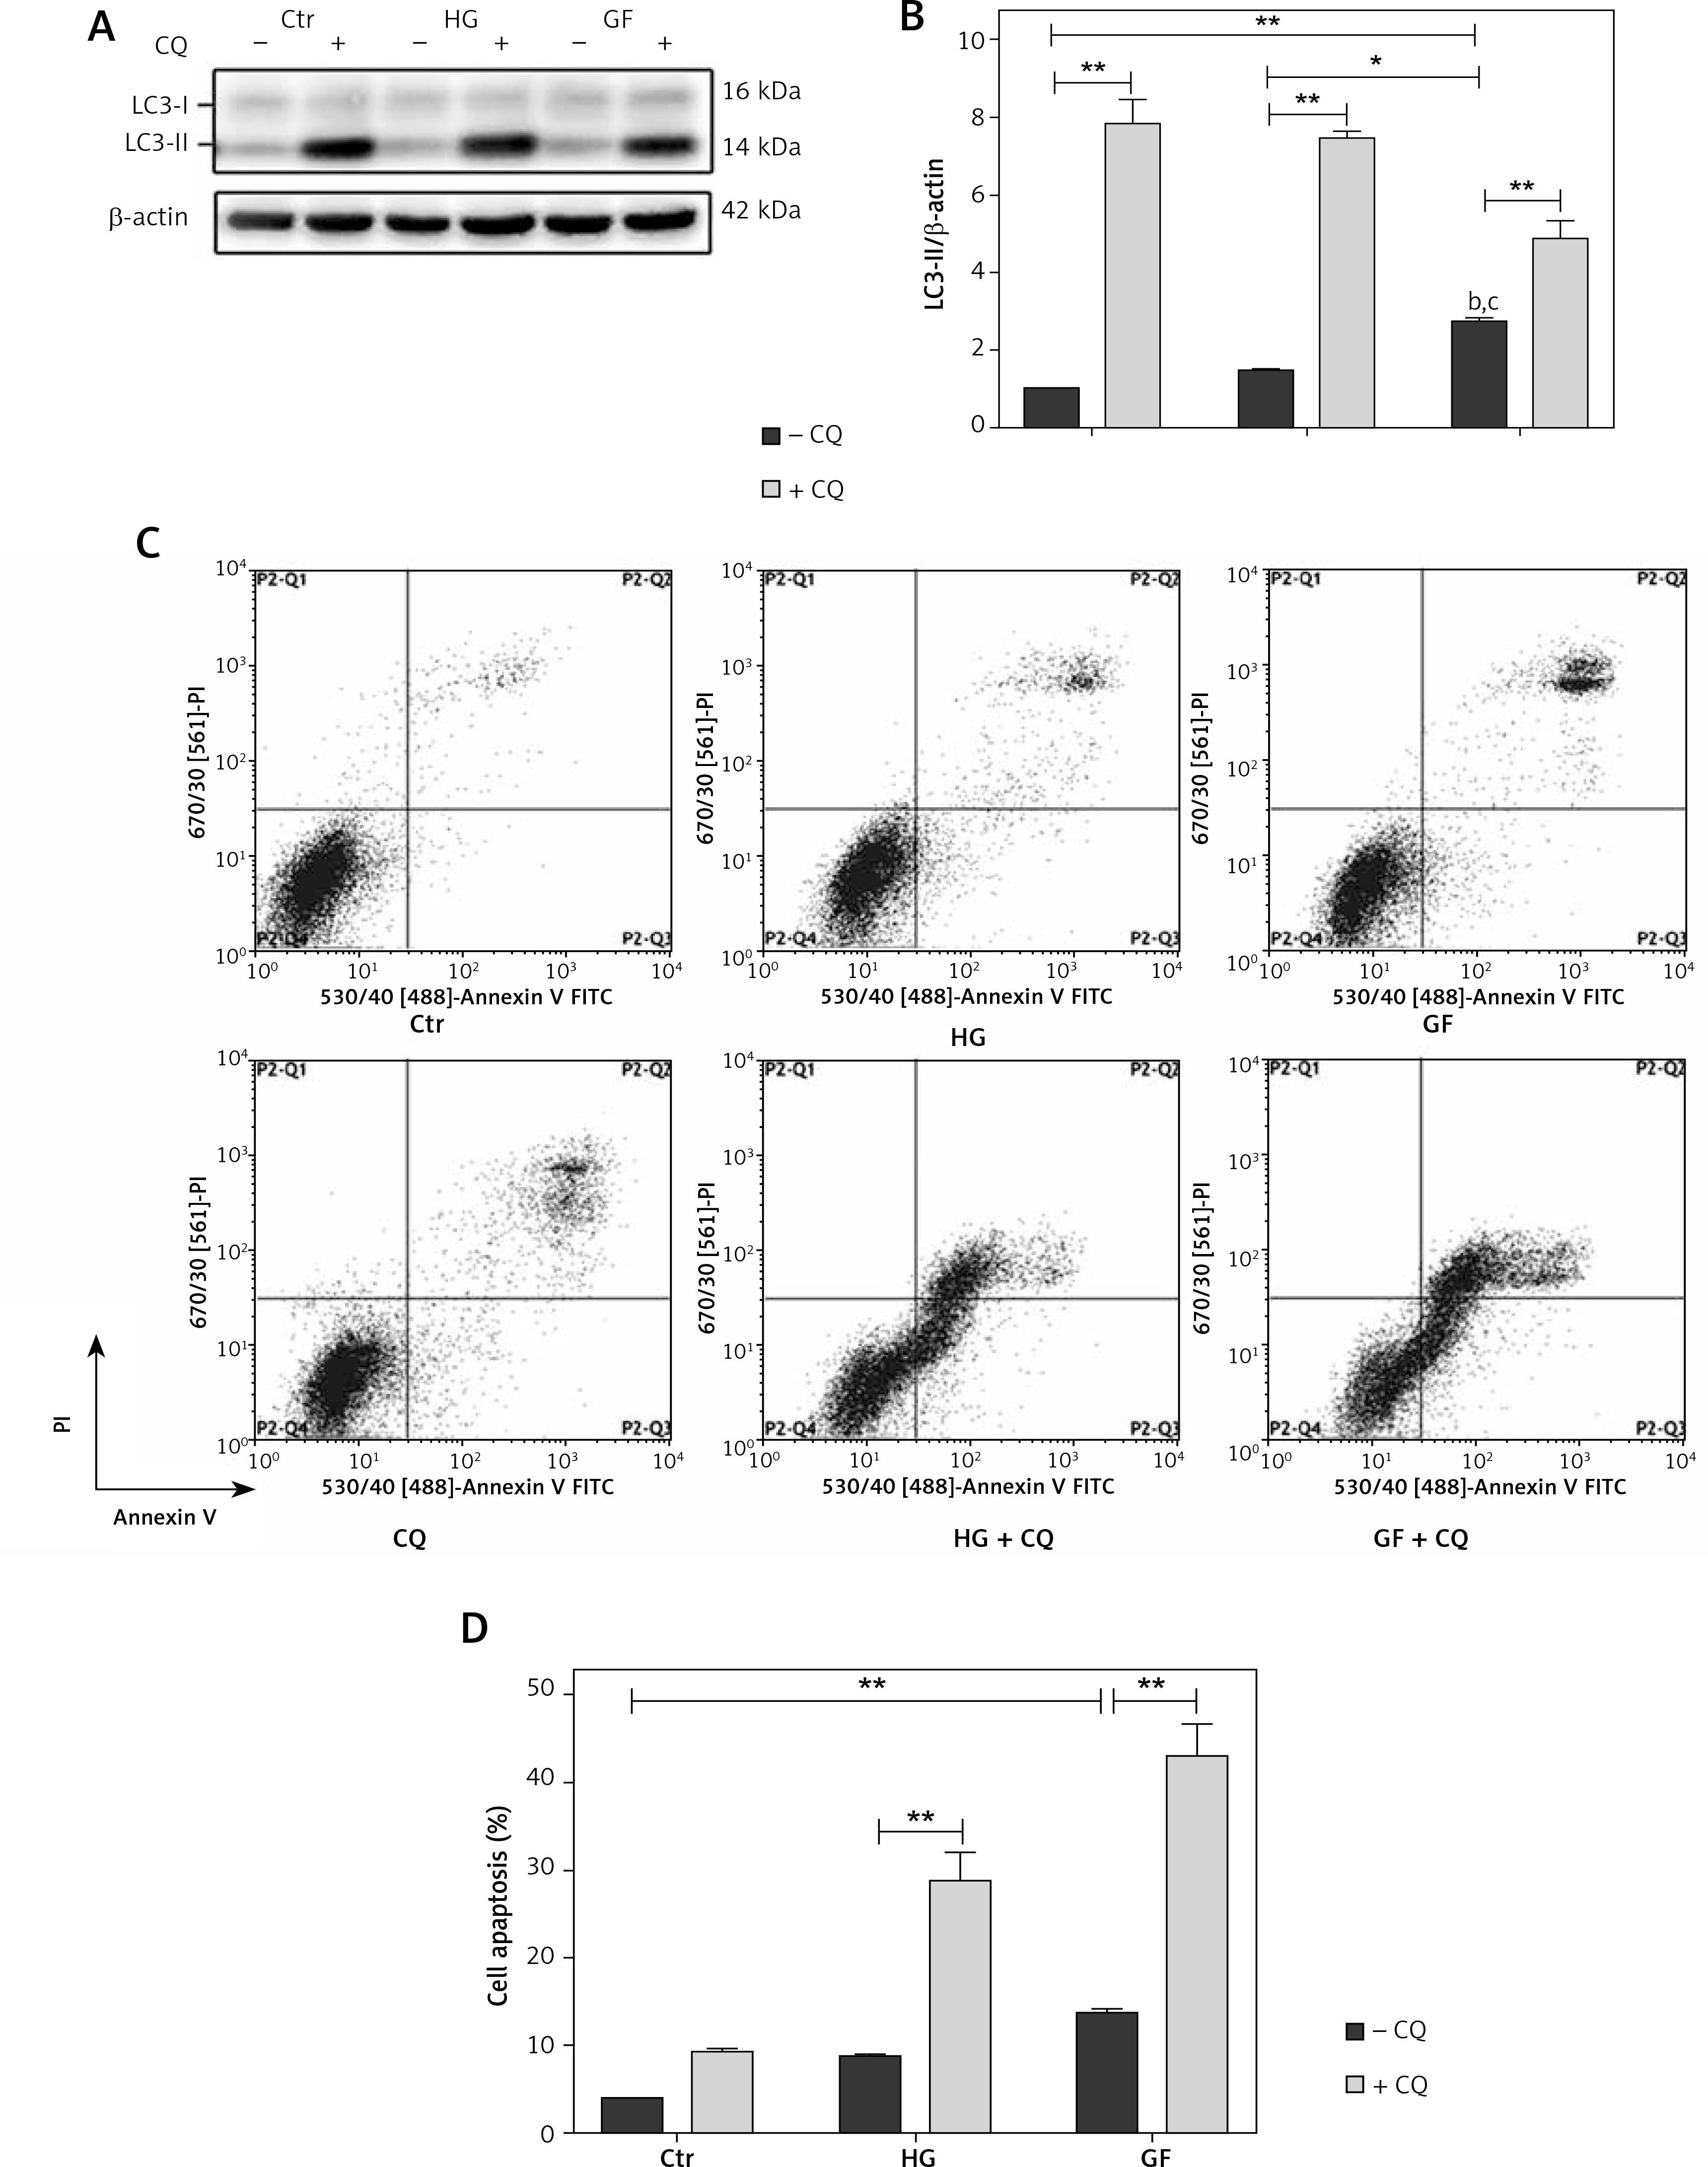
After treatment with CQ (an autophagy inhibitor), LC3-II expression was significantly increased (Figures 6 A and B), indicating that autophagy induced by high glucose or glucose fluctuation treatments was inhibited. Also, the apoptotic rates were significantly higher in CQ treatment groups (HG + CQ and GF + CQ) than in the absence of CQ (Figures 6 C and D).
Figure 6
The role of autophagy in apoptosis of osteoblasts under different treatments. A – Western blot analysis of LC3-II protein expression induced by high glucose and glucose fluctuation w/wo the presence of CQ. B – Quantitative analysis of LC3-II protein levels in the absence or presence of CQ. C – Flow cytometry was used to evaluate the apoptosis of osteoblasts under different treatments. D – Quantification of apoptotic rates of osteoblasts with high glucose and glucose fluctuation treatment w/wo the presence of CQ. Two-way ANOVA was used to analyze the data. Independent experiments were performed three times. The data are expressed as the mean ± SEM; *p < 0.05; **p < 0.01
The above results indicated that inhibition of oxidative stress could decrease apoptosis, while inhibition of autophagy could increase apoptosis in osteoblasts.
Discussion
Diabetes and osteoporosis are two common chronic metabolic diseases. Previous studies have shown that diabetes could increase the risk of osteoporotic fracture [34, 35]. The osteoblasts and osteoclasts are known to play extremely important roles in the reconstruction of bone. The maintenance of bone homeostasis depends on the stable function of osteoblasts and osteoclasts [36]. High glucose leads to abnormal bone metabolism, osteoblast dysfunction and bone formation decrease [37]. However, the molecular mechanism of abnormal bone metabolism in diabetes has not been well studied.
Recent studies have shown that glucose fluctuation plays an important role in various chronic complications induced by diabetes [38–44]. In patients with type 1 and type 2 diabetes mellitus, glucose fluctuation has been reported to be closely related to oxidative stress [38, 45]. Moreover, in comparison to high glucose, there was a stronger correlation between glucose fluctuation and oxidative stress [39]. It was observed that high glucose induced the upregulation of an oxidative stress marker as well as an inflammation marker, which may further trigger apoptosis [41]. In vitro, oxidative stress has been reported to inhibit the differentiation of osteoblasts and induce the apoptosis of osteoblasts [46]. Meanwhile, the increase of intracellular oxidative stress was closely related to the occurrence and development of dysfunction of osteoblasts and osteoporosis [30, 47–49]. ROS is the product of normal metabolism and is important for cell signaling and homeostasis. However, excessive ROS can lead to cell damage [50]. Meanwhile, mitochondria are another source of ROS production. Here, we treated MC3T3-E1 osteoblasts with high glucose (25.0 mmol/l) and glucose fluctuation (5.5/25.0 mmol/l). Our results showed that high glucose and glucose fluctuation treatments might increase the intracellular and mitochondrial ROS production in osteoblasts, especially after glucose fluctuation treatment (Figure 2 A), which is in accordance with a previous study [40]. Also, glucose fluctuation caused a decrease of ΔΨm and an increase of cytochrome C protein expression (Figures 2 B and 5 C), indicating the damage of intracellular mitochondria. In addition, our results revealed an effect of proliferation inhibition and apoptosis initiation on osteoblasts after high glucose and glucose fluctuation treatment (Figure 1). Also, this effect was more pronounced in the GF group. Above all, the high glucose and glucose fluctuation could induce oxidative stress and damage of osteoblasts.
Autophagy is a basic and crucial physiological activity for cells to adapt to the changing microenvironment [11]. It plays a major role in determining cell fate and is involved in growth and development, cellular homeostasis, and physiological or pathological processes [51]. Hocking et al. found that the dysregulation of autophagy was associated with the pathogenesis of bone or cartilage diseases, such as osteoporosis, Paget bone disease and osteoarthritis [33]. We found that high glucose and glucose fluctuation resulted in significant up-regulation of expression of autophagy-associated proteins LC3-II and Beclin1 as well as the expression of the mitochondrial autophagy-associated protein Bnip3, and down-regulation of p62 (Figure 3 B), which can bind with LC3 and promote degradation of polyubiquitinated protein aggregates, in MC3T3-E1 osteoblasts, especially in the GF group. Also, LC3-II was significantly increased after treatment with CQ (Figure 6 A). CQ, as an autophagy inhibitor, can increase accumulation of LC3-II by raising the lysosomal pH or inhibiting lysosome-mediated proteolysis, by which the autophagosome-lysosome fusion step of autophagy would be interrupted [17]. Furthermore, LC3-II, as a receptor of the phagocytic membrane, plays an important role in the formation of autophagy [52], while Beclin1 is mainly involved in the initiation of autophagy. As a result, Beclin1 expression was not changed after adding CQ to block autophagosomal degradation (data not shown). TEM analyses also revealed that glucose fluctuation increased the number of autophagosomes (Figure 3 A). These results suggest that autophagy might be activated under the treatment of high glucose and glucose fluctuation, especially the latter.
An increased ROS level has been reported to affect the stability of cell function and was closely related to autophagy and apoptosis [26]. In the present study, glucose fluctuation led to a change of apoptosis-related protein expression, such as decreased Bcl-2 expression as well as increased Bax, caspase 3 and cleaved caspase 3 expression (Figure 5 C). With the treatment of antioxidant NAC, ROS production was reduced (Figure 4 A). Moreover, the increase of apoptosis and changes of protein expression induced by glucose fluctuation were reversed by NAC in MC3T3-E1 osteoblasts (Figure 5 C). Our study showed that NAC not only blocked the ROS production in the MC3T3-E1 osteoblasts, but also inhibited the apoptosis as well as their related protein expression. Then, NAC also suppressed the autophagy-related protein expression induced by glucose fluctuation (Figure 4 B), which indicated that autophagy was closely related to the ROS level in the osteoblasts. This might be related to the intracellular calcium overload induced by ROS [25, 53], which needs further verification. Taken together, these results reveal that ROS may play a role in the apoptosis and autophagy induced by high glucose and glucose fluctuation.
Autophagy plays an important role in the maintenance of cellular homeostasis. Here, we found that after treatment with CQ, an autophagy inhibitor, the apoptotic rates of osteoblasts were increased (Figure 6 C), which indicates that autophagy induced by high glucose and glucose fluctuation might protect MC3T3-E1 osteoblasts from apoptosis. In addition, there are various pathways that could influence autophagy, and we found that both p-Akt/Akt and p-mTOR/mTOR were decreased in the GF group. In a previous study, Ying el al. found that glucose fluctuation increased mesangial cell apoptosis and that was related to the Akt pathway [44]. Also, other studies show that oxidative stress and autophagy are related to the Akt pathway [54, 55]. Byun et al. showed that Bnip3 affected autophagy by regulating the Akt-mTOR-p70S6K pathway [56]. However, our present study was not profound enough. Specially, more accurate methods are needed to detect the production of ROS and the intensity of fluorescence images should be further quantified. Therefore, further studies are needed.
In conclusion, we found that high glucose and glucose fluctuation caused proliferation inhibition and induced apoptosis and autophagy in the MC3T3-E1 osteoblasts, and this effect was more profound under glucose fluctuation. The induction of autophagy and apoptosis was probably related to ROS production, which might be caused by damaged mitochondria. Additionally, further studies should be performed to investigate which organelles or molecules are involved in autophagy and how they regulate MC3T3-E1 osteoblasts under different glucose concentrations (high glucose and glucose fluctuation).