


Intraoperative fluid management aims to maintain central euvolemia while avoiding salt and water excess. Excessive intravenous fluid administration leads to gut edema, bacterial translocation, prolonged ileus, and impaired gastrointestinal (GI) function and tolerance for enteral nutrition [1]. Several factors, such as preoperative fasting, hypertonic bowel preparations, anesthesia, and positive pressure ventilation, predispose surgical patients to a functional intravascular volume deficit [2]. How-ever, optimal fluid management is difficult to achieve using standard parameters (e.g., heart rate, blood pressure, central venous pressure, or urine output) [3]. So, intraoperative fluid management should be guided by goal-directed therapy (GDT) rather than predetermined calculations [1].
Pulse pressure variation (PPV) has an advantage over most of the dynamic measures of fluid responsiveness in not being affected by airway and pleural pressures [4]. Lactated Ringer’s (LR) is a commonly used crystalloid solution for resuscitation and fluid replacement. However, it is a slightly hypotonic solution that can cause hyponatremia and tissue edema [5, 6]. Hypertonic saline (HS) offers many beneficial hemodynamic properties, such as rapid expansion of intravascular volume, reduction of endothelial and tissue edema, and increased myocardial contractility [7, 8]. Intragastric HS administration in patients who have undergone upper GI surgery proved prompt postoperative GI function recovery and reduced overall postoperative complications [9]. There is still a need for less expensive monitoring devices to guide GDT during anesthesia.
We aimed to investigate the efficacy of intra-operative HS administration for goal-directed therapy in reducing postoperative complications following GI surgery. So, we conducted this study to evaluate the value of using HS for GDT with the aid of the web-based smartphone app Capstesia as a monitor for PPV.
METHODS
This randomized, controlled, single-blinded study was conducted on patients of ASA I and II physical status scheduled for elective GI operations. Patients were randomly allocated, by closed envelop technique, into two equal groups of 20 patients each. The first group received HS, and the second group received LR solution. After approval by the departmental Research Ethics Committee, we obtained informed consent from all patients before the commencement of the study. We included all consecutive ASA I and II patients, of both sexes who were in the age group of 18–60 years and scheduled for elective GI surgery. Emergency cases, patients who completed more than eight hours of preoperative fasting or received bowel preparation, laparoscopic cases, or pregnant females were excluded from the study. Patients who had any contraindication to arterial cannulation were also excluded from the study.
Upon patient arrival at the operating room (OR), a peripheral intravenous (i.v.) cannula was inserted, and midazolam (0.07 mg kg-1) given intravenously. A radial arterial cannula (20 gauge) was fixed in place under local anesthesia. ECG, pulse oximetry, and noninvasive blood pressure monitoring equipment were attached to all patients. Then, invasive blood pressure monitoring started. General anesthesia (GA) was induced by using induction doses of propofol (2 mg kg-1), fentanyl (1.5 µg kg-1), and atracurium besylate (0.5 mg kg-1). Then GA was maintained with a mixture of isoflurane at a dose of 0.5–1.5% in 100% oxygen. Boluses of atracurium (0.1 mg kg-1) were given every 30 minutes for the maintenance of neuromuscular blockade. For intraoperative pain control, patients received i.v. morphine (0.15 mg kg-1) and another dose of i.v. fentanyl at 1 µg kg-1 was administered immediately before skin incision.
Volume controlled lung ventilation started with a tidal volume of 6–8 mL kg-1 without PEEP, and the respiratory rate was adjusted to maintain PaCO2 of 35 to 40 mm Hg. Post-induction hypotension (> 20% of pre-induction reading) was treated by decreasing the inhalational anesthetic concentration. After the conduction of GA, a 7 F triple lumen central venous catheter (CVC) was inserted in the right internal jugular vein under ultrasound guidance. Then, one port of the CVC was connected to a pressure transducer and the pressure trace displayed continuously in both groups. All of the monitoring transducers were positioned and zeroed at the midaxillary level. An indwelling urinary bladder catheter was inserted. The core body temperature was maintained over 36°C with a fluid warmer throughout the surgery.
For the calculation of PPV, we used the Capstesia app (Galenic App, Vitoria-Gasteiz, Spain) installed on an LG G3 smartphone (LG Electronics, Suwon, South Korea), having a camera of 13 megapixels resolution. The arterial waveform speed was set at a speed of 12.5 mm s-1 before photo capture. An arterial waveform photograph was obtained directly from the patient monitor using the Capstesia smartphone app following the manufacturer’s recommendations for capturing the entire monitor screen. Values of systolic blood pressure, diastolic blood pressure and heart rate were entered to calculate the PPV. Then the image was sent through the Internet to the server and the resultant PPV and cardiac index (CI) were obtained from the app. After skin closure, inhalational anesthetic was discontinued, neuromuscular blockade reversed, and the patient trachea was extubated. Then, the patient was transferred to the post-anesthesia care unit (PACU). For postoperative pain control, iv paracetamol 15 mg kg-1 four times a day was given to all patients. Morphine (0.05 mg kg-1) was administered intravenously when needed for moderate to severe post-operative pain.
Fluid management was started after the insertion of the CVC and obtaining the baseline readings. Both groups received a baseline infusion of lactated Ringer’s solution at a rate of 2 mL kg-1 h-1 started after the CVC insertion until discontinuation of anesthesia. Then boluses of either LR (Ringer’s lactate, 500 mL, Otsuka Pharmaceuticals, Egypt) or HS (hypertonic saline 3% intravenous, Otsuka Pharmaceuticals, Egypt) were administered, guided by an algorithm dependent on Capstesia’ estimations of PPV as follows (Figure 1):
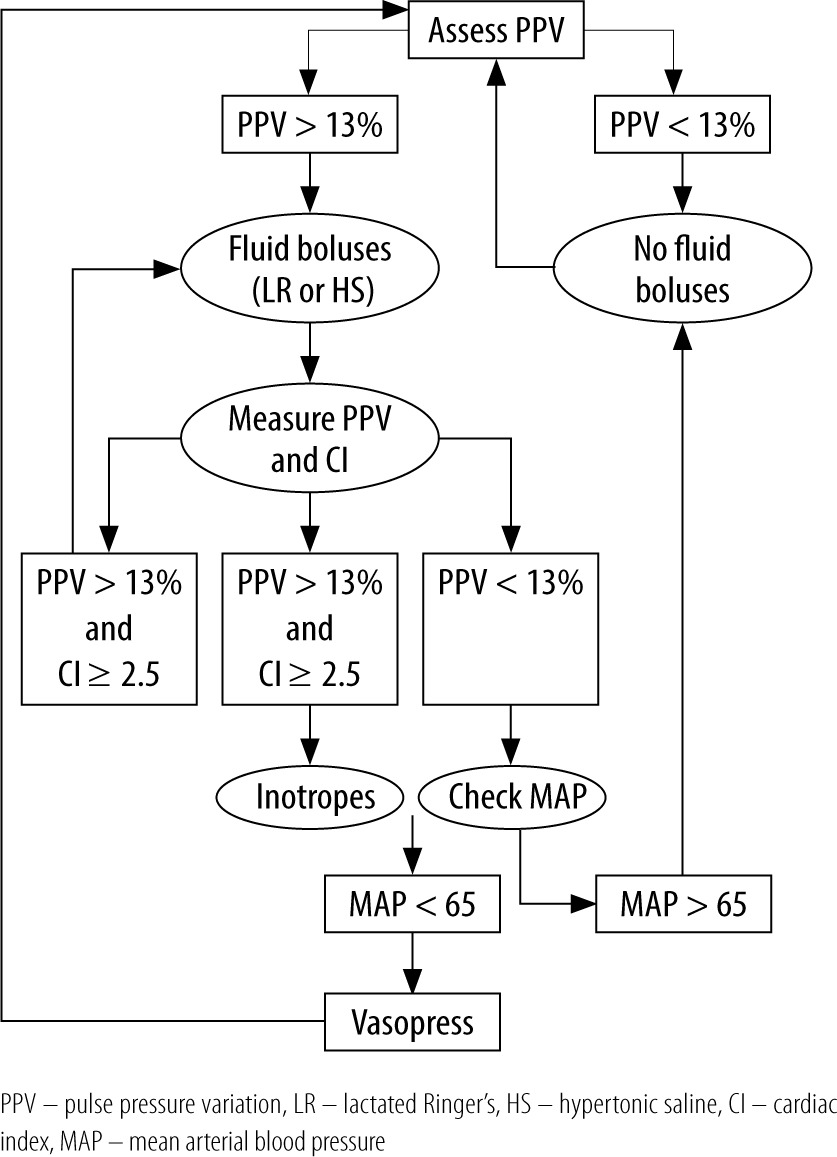
LR-GDT group: Baseline readings of PPV, CI, and mean arterial pressure (MAP) were taken after CVC insertion and then: when PPV > 13% (= fluid responder): a bolus of 250 mL of LR solution was given over 15 min and then other readings of PPV, CI, and MAP taken. After that, we proceeded to either (a), (b), (c), or (d):
when PPV was still > 13% and CI ≥ 2.5 L min-1 m-2:another bolus of 250 mL of LR solution was given over 15 min;
when PPV > 13% but CI < 2.5 L min-1 m-2: we started inotropes infusion (dopamine with a target to reach 2.5 L min-1 m-2);
PPV < 13% and MAP < 65 mm Hg: we started vasopressor infusion (noradrenaline at a dose of 0.1–0.25 µg kg-1 min-1);
PPV < 13% but MAP > 65 mm Hg: we stopped fluid boluses. All measurements of PPV, CI and MAP were repeated every 15 min throughout the study period.
HS-GDT group: Baseline readings of PPV, CI, and MAP were taken after CVC insertion and then: when PPV >13% (= fluid responder): a bolus of 100 mL of HS 3% solution was given over 15 min and then other readings of PPV, CI, and MAP taken. After that we proceeded to either (a), (b), (c), or (d):
when PPV was still > 13% and CI ≥ 2.5 L min-1 m-2: another bolus of 100 mL of HS 3% solution was given over 15 min;
when PPV > 13% but CI < 2.5 L min-1 m-2: we started inotropes infusion (dopamine with a target to reach 2.5 L min-1 m-2);
PPV < 13% and MAP < 65 mm Hg: we started vasopressor (noradrenaline at a dose of 0.1–0.25 µg kg-1 min-1) infusion;
PPV < 13% but MAP > 65 mm Hg: we stopped fluid boluses. All measurements of PPV, CI and MAP were repeated every 15 min throughout the study period. HS 3% was infused only through the central venous line.
Demographic and categorical data and Physio-logical and Operative Severity Score for the Enumeration of Mortality and Morbidity (POSSUM) were collected. PPV, CO, and CI were measured by Capstesia and recorded every 15 min from insertion of the CVC until discontinuation of anesthesia. The total volume of intraoperative crystalloid solutions in milliliters, number of fluid boluses received in each group, fluid balance, and total volume of intraoperative urine output after discontinuation of anesthesia were also documented. We measured serum creatinine preoperatively as a baseline and at 24, 48 and 72 hours postoperatively. Serum sodium was measured in both groups at the following intervals: preoperatively as a baseline (T1), 1 hour after starting the fluid regimen (T2), 2 hours after the starting the fluid regimen (T3) and 12 hours postoperatively (T4). Serum lactate was obtained from arterial blood gases (ABG) at the following intervals: 5 min after insertion of CVC (T1), 1 hour after starting the fluid regimen (T2), 2 hours after the starting the fluid regimen (T3) and 12 hours postoperatively (T4). We reported the time to first bowel movement (gas and feces) after the operation. All patients in both groups were followed up postoperatively to detect the incidence and type of possible postoperative complications until discharge with a maximum of 28 days postoperatively. Mortalities in both groups and length of hospital stay up to 28 days postoperatively were documented.
We planned to collect data on clinically relevant outcomes such as the total amount of administered intraoperative crystalloid fluids used in these patients (primary outcome), along with other parameters (secondary outcomes) such as the prompt recovery of postoperative GI function, the incidence of postoperative complications and possible complications related to HS infusion. For sample size calculation, we used the G3 power program, considering a power of 0.8 and a P-value of 0.05 to be statistically significant. The mean and standard deviation of the fluid administered were derived from a similar study [10] and used to calculate our sample size. The total calculated sample size was 36 patients (18 in each group). To compensate for drop-outs, we included 40 patients (20 in each group).
Statistical analysis
The analysis was performed using the program SPSS version 25. Categorical data were analyzed using the χ2 test or Fisher’s exact test. Differences between the means or medians of the two groups compared using the t-test and the Mann-Whitney U test, respectively. Data within each group were analyzed using analysis of variance for repeated measurements. When appropriate, post hoc analyses were performed with the Tukey test. Exact confidence intervals were computed for the overall rate of complications. A probability value (P-value) less than 0.05 was considered statistically significant [11, 12].
RESULTS
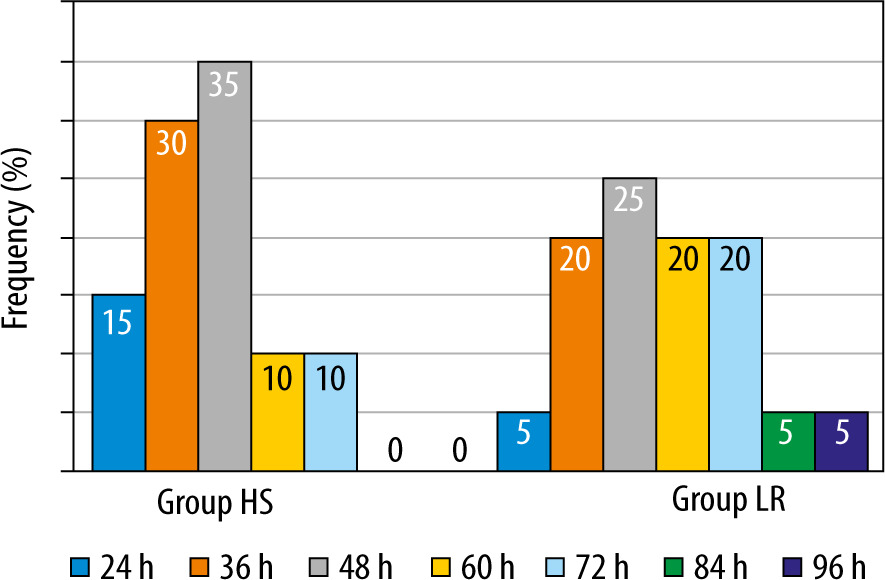
Patients characteristics and demographic data were comparable between the groups (Table 1). Also, the POSSUM score and MAP measurement showed no significant difference between the groups (Table 2). Our results demonstrated that mean readings of both PPV and CO were comparable in both groups with no statistically significant difference. However, CI readings were higher in the HS group compared to the LR group. They showed a statistically significant difference at 15 min, 45 min,and 135 min (P < 0.05), but no statistically significant difference between the two groups at the other time points. In the HS group, patients received less crystalloids (1262.50 ± 318.25 mL) compared to those received by patients in the LR group (2667.50 ± 670.29 mL), and this difference was statistically significant (P < 0.001). The number of given red blood cells and plasma units was comparable in both groups. Although patients in both groups differ in the number of fluid boluses administered, there was no statistically significant difference between the groups. In the HS group, 20% of patients had zero fluid balance, and 80% had positive fluid balance, while in the LR group 100% of patients had positive fluid balance, but these results did not show a statistically significant difference. The amount of urine output (UOP) was comparable between the groups, with no statistically significant difference (Table 3 and Figures 2–4). Fifteen patients (75%) in the HS group had raised serum Na at T3 but normalized toward T4 (transient hypernatremia), in contrast to the LR group patients, who did not develop hypernatremia. This made a statistically significant difference between the groups regarding serum Na measurements at T1, T2, T3, and T4 (Figure 5). Serum creatinine and lactate measurements were comparable between the groups (Figure 6). Postoperative resumption of bowel movements was recorded when the patient noticed the passage of either gases, feces, or both. In the HS group, 15% of patients resumed postoperative bowel movements at 24 hours postoperatively compared to 5% of patients in the LR group. Thirty-five percent and thirty percent of patients in the HS group resumed bowel movements at 48 and 36 hours, respectively, compared to twenty-five percent and twenty percent in the LR group (Figure 7). However, the mean time of the 1st bowel movement in hours was 44.40 (± 14.09) in the HS group compared to 55.80 (± 18.38) in the LR group, but surprisingly, this difference was only of borderline significance (P = 0.052). The mean length of hospital stay was comparable in both groups, i.e. 7.25 (± 4.06) and 6.85 (± 1.53) days in the HS group and the LR group, respectively. This difference was not statistically significant.
TABLE 1
Patients’ characteristics and demographic data
TABLE 2
Duration of surgery and POSSUM morbidity
| Parameter | HS group | LR group | P-value |
|---|---|---|---|
| Duration (min) | 181.5 (± 44.84) | 177 (± 39.72) | 0.030* |
| POSSUM morbidity | 60.44 (± 18.19) | 58.66 (± 18.44) | 0.799 |
| POSSUM mortality | 15.70 (± 7.76) | 15.43 (± 7.55) | 0.989 |
TABLE 3
Amount and type of given fluids, number of fluid boluses and amount of UOP
FIGURE 2
Total amount of intraoperative crystalloids. Data presented as means and error bars represented standard deviation
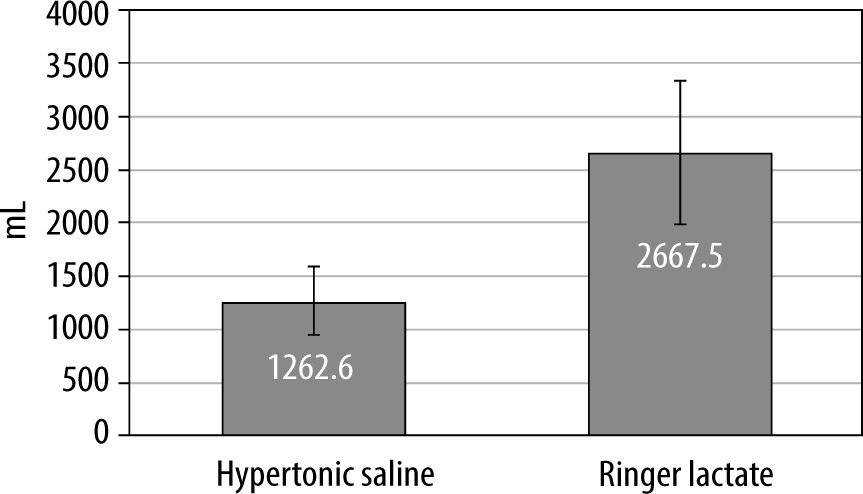
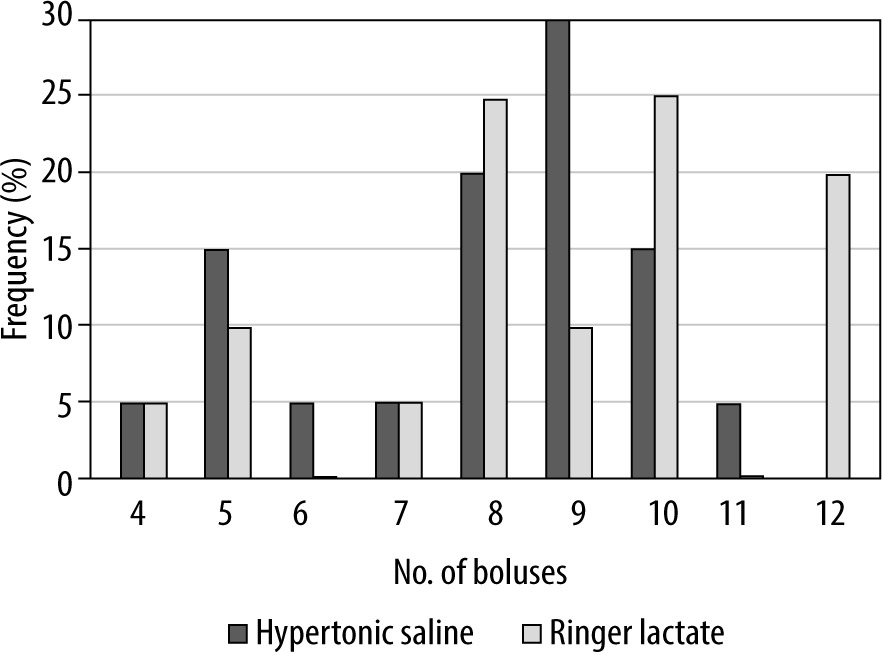
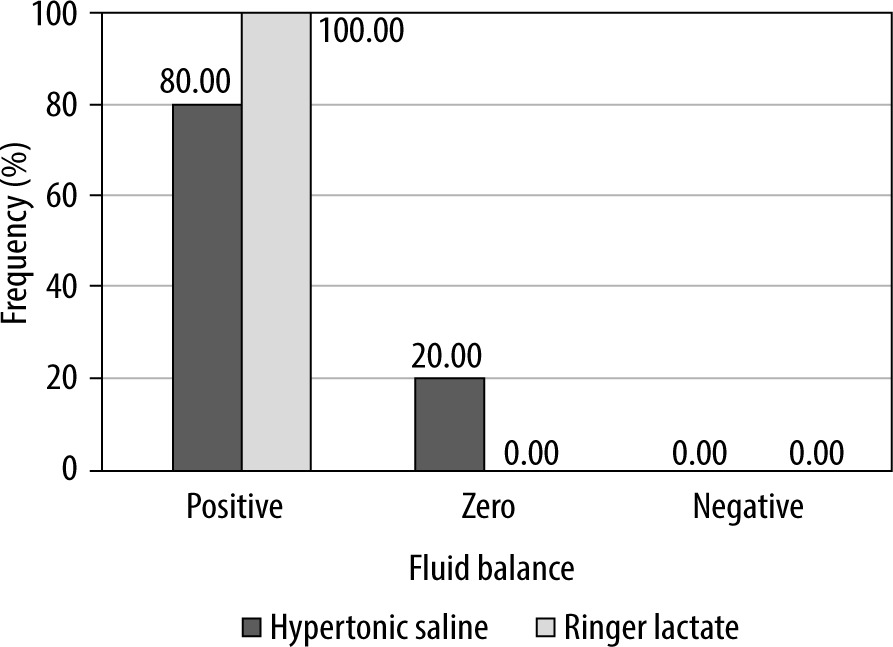
FIGURE 5
Serum sodium concentration at different time intervals. Na – sodium, mEq L-1 – milliequivalents per liter, T1 – preoperative baseline reading, T2 – 1 h after starting fluid regimen, T3 – 2 h after starting the fluid regimen, T4 – 12 h postope ratively
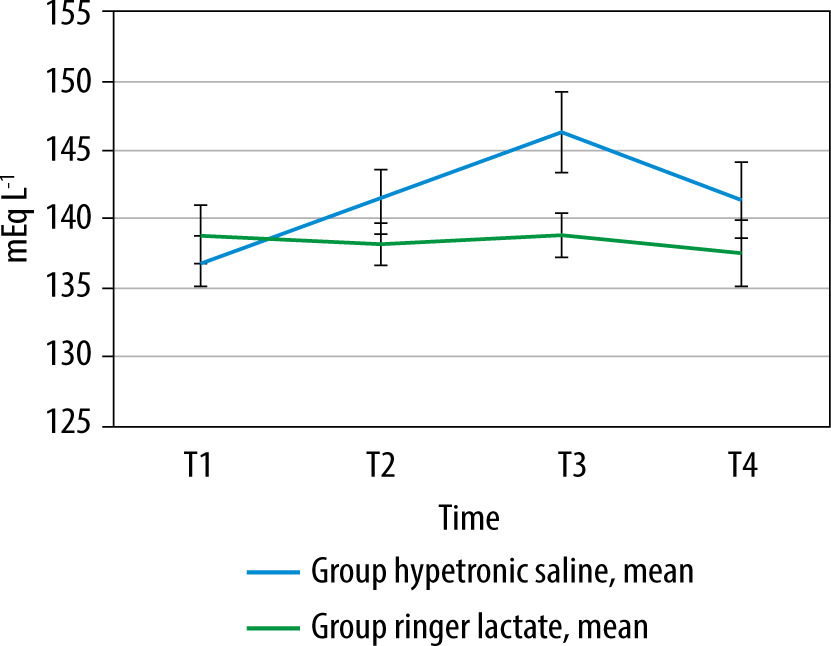

FIGURE 7
Frequency of 1st bowel movement in both groups. Data presented as count and frequency. HS group – hypertonic saline group, LR group – lactated ringer group, h – hours
The reported postoperative complications are illustrated in Figure 8. It showed that the incidence of postoperative complications was lower in the HS group. Only one patient (5%) in the HS group developed six types of postoperative complications (30%) compared to seven patient (35%) in the LR group, who developed four types (20%) of postoperative complications (Figure 8). Patients who were reoperated upon in the LR group were diagnosed with intestinal leakage which required another operation. No deaths were reported at all in either group. There was no statistically significant correlation between either POSSUM morbidity or POSSUM mortality and postoperative complications (P < 0.05) (Table 4). However, there was a significant correlation between POSSUM morbidity (P = 0.006) and POSSUM mortality (P = 0.002) and the total amount of given fluids.

TABLE 4
Correlation between mean POSSUM score and complications
DISCUSSION
This study is a randomized trial on the use of hypertonic saline in GI surgery. To the best of our knowledge, no previous study has investigated the use of HS for GDT. A systematic review by Sun et al. [13] showed that perioperative GDT was asso-ciated with a significant reduction in short-term mortality, long-term mortality, and overall complication rates and facilitated GI function recovery in patients undergoing major abdominal surgery. The total amount of crystalloids administered intraoperatively in the present study showed that patients in the HS group intraoperatively required less volume than the LR group (P < 0.05). The osmotic pressure and volume of the bolus of HS may play a role in this discrepancy in the amount.
Although a smaller volume of fluids was given in the HS group, 80% of them had positive fluid balance. This positive fluid balance could be explained by an error in data collection that appeared as an inaccurate calculation of fluid balance in which the UOP was the only calculated “output”. It is worth noting that the maximal number of fluid boluses given to HS patients was eleven, and this means that the maximum volume of HS perceived by these patients was 1100 mL. Despite this volume, the highest Na level reading was 150 mmol L–1, and this “transient” hypernatremia had no clinical effects. Our results showed a positive correlation between the total amount of given fluids and the POSSUM score. This positive correlation means that increasing the amount of infused fluids consequently increases the POSSUM score, and accordingly, the risk prediction of morbidity and mortality increases. Hong et al. [9] found that intra-gastric administration of 3% HS for patients who underwent upper GI surgery improved the intestinal edema and reduced the incidence of anastomotic leakage and post-operative ileus.
Although the CO results in our study were comparable between groups, the CI results showed statistical significance at certain time points; this difference could be explained by the divergence in body surface area values between patients, as CI is normally calculated by dividing the CO by the body surface area values. The current study revealed that the incidence of other postoperative complications was lower in the HS group. These results could be comparable to the results of the study by Hong et al. [9], as they found that patients with HS experienced a lower overall rate of postoperative complications (P = 0.063), including a non-significantly lower rate of infectious complications (pneumonia, wound, abdominal, and systemic infection). Our study showed that patients in the HS group regained bowel movement slightly faster than the LR group. These results failed to reach statistical significance, although they were approaching it (P = 0.052). Hong et al. [9] found that intragastric administration of HS was associated with prompt postoperative gastrointestinal function recovery, including first flatus (P = 0.048) and feeding within three postoperative days (P = 0.036). Radhakrishnan et al. [14] found that HS can improve intestinal transit and preserve tissue stiffness and residual stress in the setting of established intestinal edema. Also, Sun et al. [15] found that initial resuscitation with hypertonic saline significantly decreased the intestinal injury and improved intestinal histopathology caused by a severe burn. We defined hypernatremia in our study as serum Na > 145 mEq L–1; however, this “mild transient” hypernatremia had no clinical significance. No adverse events were identified that occurred as a direct result of the administration of hypertonic saline. However, Hong et al. [9], in their study, noted that there were no differences in the serum electrolyte abnormalities between their two studied groups. A Cochrane review titled “Hypertonic saline for peri-operative fluid management” was published in 2012 and included 15 studies with 614 participants. The results showed that no serious adverse events were reported. While all patients were in a positive fluid balance postoperatively, the excess was significantly less in HS patients. Patients treated with HS received significantly less fluid than isotonic saline-treated patients without differences in diuresis between the groups. The maximum serum sodium and the serum sodium at the end of the study were significantly higher in HS patients; the level remained within normal limits (136 to 146 mEq L-1). They concluded that HS reduces the volume of intravenous fluid required to maintain patients undergoing surgery but transiently increases serum sodium [16]. The mean length of hospital stay in our study was comparable in both groups with no statistically significant difference. However, it is to be noted that the decision of patient’s discharge in our institute is difficult to control and is governed by many factors such as surgeon preference and the distance of patient’s residence. Analogous to these results are those reported by Hong et al. [9], where they found that the mean length of hospital stays in patients with HS treatment were similar to patients without HS treatment. The rate of postoperative complications was higher in the LR group, and this could be attributed to the larger volumes infused in this group. Hypotonicity of LR may be another factor. Li et al. [17] studied the adverse effects of intraoperative administration of 6% hydroxyethyl starch versus LR on patients scheduled for major abdominal cancer procedures, 83% of which were performed laparoscopically. They found that the administration of more than 2 L of LR increased the paralytic ileus duration by 0.7 days and food intolerance duration by two days. In contrast, Bhagat et al. [6] evaluated the effect of the intraoperative use of NS, LR, and its combination on the outcome of neurosurgical patients. They suggested that all the three fluid protocols were similar in their overall clinical outcomes. In a review article Yates et al. [18] described the controversies over perioperative fluid management in colorectal surgery. They reported a randomized study conducted on 202 patients who received goal-directed balanced crystalloid versus goal-directed balanced starch solution. They found that larger volumes were required in the crystalloid group (3175 (2000–3700) vs. 1875 mL (1500–3000), P < 0.001) with a higher 24-hour fluid balance (+4226 (3251–5779) vs. +3610 mL (2443–4519), P < 0.001); however, the incidence of postoperative complications, return of GI function, and length of hospital stay were comparable for both groups.
Our study had several limitations. The study was limited to GI surgery, and patients were of ASA I and II with a good general condition or controlled systemic disease. This study evaluated only two volumes of fluid and focused only on intraoperative management. Late complications could have been missed because we followed patients only until hospital discharge. The days to first defecation and first flatus were extracted from patient records. This might not be entirely accurate as there are many differences in practice within both the surgery and the ICU divisions, leading to different care practices between study patients. Handling and using Capstesia software was easy and practical, but we encountered some technical difficulties. Many times, the images were not instantly uploaded to the server, and we overcame this by repeated trials or even reloading the program and capturing another image. Also, sometimes the quality of the captured images was not good and required other trials. Therefore, additional studies are needed to investigate whether a different dose regimen of HS and other types of surgery might have further improved outcome, and the clinical validity of the Capstesia app should be subjected to further studies.
CONCLUSIONS
The use of hypertonic saline (3% NaCl) solution for goal-directed therapy in GI surgery resulted in a beneficial reduction in positive fluid balance, possible earlier resumption of bowel movement, and decreased postoperative complications. Capstesia is a comfortable and hand-held software that could direct and aid in intraoperative fluid management.