Introduction
Nonalcoholic fatty liver disease (NAFLD) is one of the most common types of liver disease in the world [1]. Recent studies suggest that between 75 million and 100 million individuals in the United States likely have NAFLD [2]. NAFLD was divided into two kinds of histological categories, nonalcoholic fatty liver (NAFL) and nonalcoholic steatohepatitis (NASH) [3, 4]. Among NAFLD cases, 70–75% of individuals were NAFL patients and 25–30% of individuals were NASH patients [2]. NASH is the progressive subtype of NAFLD [5]. Of note, about 10–15% of NASH patients can progress to cirrhosis and hepatocellular carcinoma (HCC) [6, 7]. However, the molecular mechanisms underlying the progression of NAFLD are still poorly understood.
Although not well understood for molecular mechanisms of NAFLD, NAFLD has been shown to be associated with components of metabolic syndrome (MetS), including type 2 diabetes, obesity and dyslipidemia [8–10]. A few MetS related genes, including LEP, PEMT, PPAR-γ, TNF-α, PNPLA3 and CD14, were also reported as regulators of NAFLD development [8, 11–13]. Of note, the regulatory roles of epigenetic modification, including microRNAs and DNA methylation, in NAFLD were also widely elucidated [14–16]. Ahrens et al. [16] reported nine enzymes (including PC, ACLY, PLCG1, IGF1, IGFBP2, and PRKCE) showing NAFLD-specific expression and methylation differences. These studies provided new insights into NAFLD. Meanwhile, a series of high-throughput assays, such as microarray and next-generation RNA sequencing, had been widely applied to monitor gene expression in the development of NAFLD. Combination with bioinformatics analysis and public microarray data will help us to identify novel pathways and genes regulating NAFLD.
In this study, we analyzed two public datasets to identify differentially expressed mRNAs among healthy controls (HC), SS and NASH. Next, protein-protein interaction networks, gene ontology (GO) and pathway analysis were performed to explore potential roles of DEGs in NAFLD. The present study aimed to provide useful information to identify involvement of genes critical in NAFLD development.
Material and methods
Microarray data
The gene expression profiles of GSE48452 [16] and GSE89632 [7] were downloaded from the GEO database. According to Ahrens’s report, a total of 14 healthy controls, 14 steatosis (SS) samples and 18 nonalcoholic steatohepatitis (NASH) samples were included in GSE48452. In Ahrens’s study, liver samples were obtained percutaneously for patients undergoing liver biopsy for suspected NAFLD or intraoperatively for assessment of liver histology. Normal control samples were recruited from samples obtained for exclusion of liver malignancy during major oncological surgery. None of the normal control individuals underwent preoperative chemotherapy, and liver histology demonstrated absence of both cirrhosis and malignancy. Consenting patients underwent a routine liver biopsy during bariatric surgery for assessment of liver affection. Biopsies were immediately frozen in liquid nitrogen, ensuring an ex vivo time of less than 40 s in all cases. A percutaneous follow-up biopsy was obtained in consenting bariatric patients 5–9 months after surgery. Patients with evidence of viral hepatitis, hemochromatosis, or alcohol consumption greater than 20 g/day for women and 30 g/day for men were excluded. All patients provided written informed consent.
In the GSE89632 dataset, patients and healthy controls (HCs) were recruited from the liver clinic or the Multiorgan Transplant Program, respectively, at the University Health Network, Toronto, Canada. The study was approved by the local Research Ethics Board, was registered (NCT02148471, www.clinicaltrials.gov), and followed the guidelines of the 1975 Declaration of Helsinki and its revisions. All participants provided informed written consent. No organs were obtained from executed prisoners or other institutionalized persons. Patients were approached when a liver biopsy for suspected NAFLD was scheduled; HCs were approached during their assessments for a live donor liver transplant. These participants underwent transient elastography, computed tomography, and/or magnetic resonance imaging. Inclusion criteria were as follows: male or female; 18 years; for HCs, presence of a normal liver (no steatosis or cirrhosis) on imaging and/or histology; and for NAFLD patients, a diagnostic liver biopsy. Exclusion criteria were as follows: alcohol consumption > 20 g/day; any other liver disease; use of medications that may cause steatohepatitis, ursodeoxycholic acid or any experimental drug, antioxidants, or PUFA supplements in the 6 months prior to entry; pregnancy or breast-feeding; for NAFLD patients, anticipated need for liver transplantation within 1 year, complications of liver disease, or any reasons contraindicating a biopsy; and, for HCs, any reason excluding them from liver donation.
MRNAs having fold changes ≥ 2 and p-values < 0.05 were selected as of significantly differential expression.
Identification of DEGs
The raw data of the mRNA expression profiles were downloaded and analyzed by R language software. Background correction, quartile data normalization, and probe summarization were applied for the original data. The limma [17] method in Bioconductor (http://www.bioconductor.org/) was used to identify genes which were differentially expressed among HC, SS, and NASH; the significance of DEGs was calculated by the t-test and was represented by the p-value. The threshold for the DEGs was set as corrected p-value < 0.05 and |log2 fold change (FC)| ≥ 1.
GO and KEGG pathway analysis
To identify functions of DEGs in OA, we performed GO function enrichment analysis in 3 functional ontologies: biological process (BP), cellular component (CC) and molecular function (MF). KEGG pathway enrichment analysis was also performed to identify pathways enriched in OA using the MAS system (Molecule Annotation System, http://bioinfo.capitalbio.com/mas3/). The p-value was calculated by hypergeometric distribution and a pathway with p < 0.05 was considered as significant.
PPI network construction
STRING online software was used to analyze the interaction. The interaction relationships of the proteins encoded by DEGs were searched by STRING online software, and the combined score > 0.4 was used as the cut-off criterion. The PPI network was visualized using Cytoscape software.
Statistical analysis
The numerical data were presented as mean ± standard deviation (SD) of at least three determinations. Statistical comparisons between groups of normalized data were performed using the t-test or Mann-Whitney U-test according to the test condition. A p < 0.05 was considered statistically significant with a 95% confidence level.
Results
Identification of DEGs in the development of NAFLD
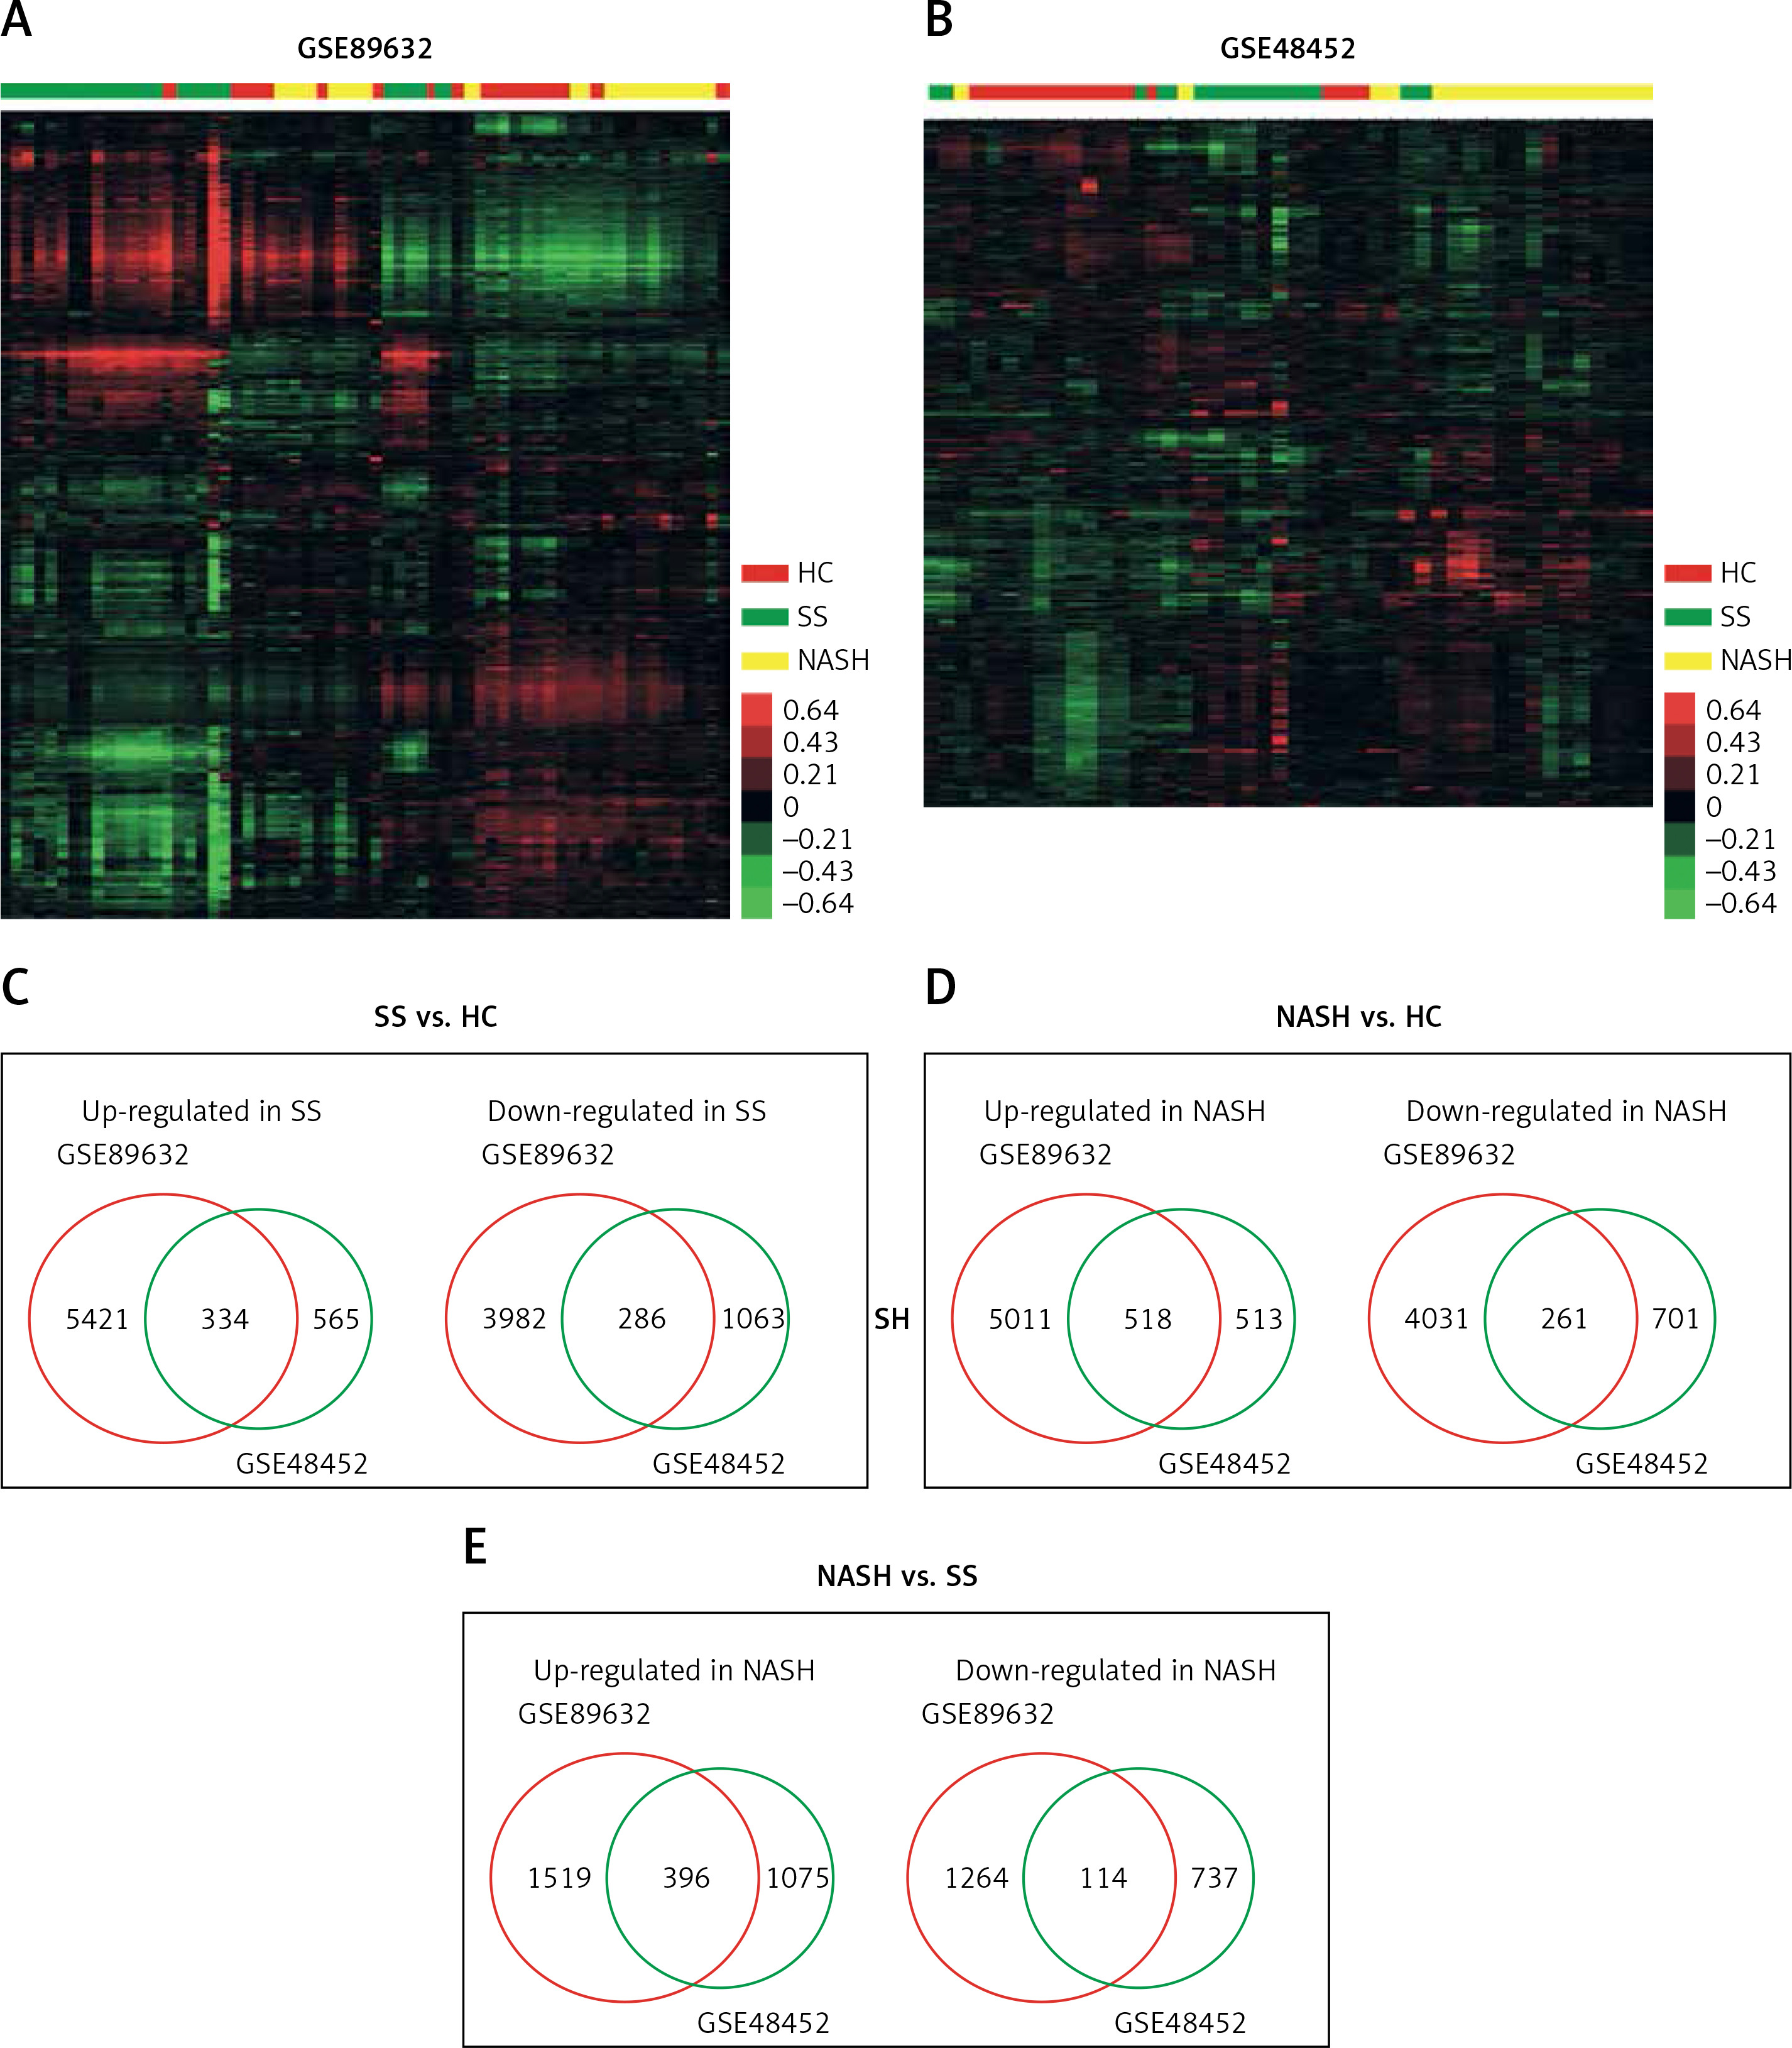
In order to identify key pathways and genes in the progression of NAFLD, we analyzed differentially expressed mRNAs among healthy controls (HC), SS and NASH using two public datasets (GSE89632 and GSE48452). We observed 334 up- and 286 down-regulated mRNAs in SS compared with HC (Figure 1 C). We also found 518 up- and 261 down-regulated mRNAs in NASH compared with HC (Figure 1 D). Meanwhile, 396 up- and 114 down-regulated mRNAs were observed in NASH compared with SS (Figure 1 E). Hierarchical clustering of the differentially expressed mRNAs among HC, SS and NASH is shown in Figures 1 A and B.
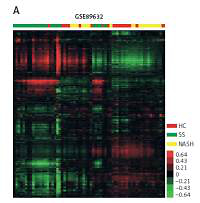
Figure 1
Identification of differentially expressed genes in the development of NAFLD. A–B – Heat map shows differential gene expression among HC, SS, and NASH by using GSE89632 (A) and GSE48452 (B). Red indicates high relative expression and green indicates low relative expression, whereas HC represents healthy controls, SS represents steatosis and NASH represents nonalcoholic steatohepatitis. C – Venn diagrams display the overlap of up- and down-regulated genes between SS and HC using GSE89632 and GSE48452. D – Venn diagrams display the overlap of up- and down- regulated genes between NASH and HC using GSE89632 and GSE48452. E – Venn diagrams display the overlap of up- and down-regulated genes between NASH and SS using GSE89632 and GSE48452
GO analysis of differentially expressed genes in the development of NAFLD
Furthermore, we performed GO analysis to explore potential roles of differentially expressed mRNAs in the development of NAFLD.
GO analysis showed that the DEGs between SS and HC were mainly involved in regulating metabolism-related pathways (including proteolysis, lipid metabolism, carbohydrate metabolism, modification-dependent protein catabolism, and ubiquitin-dependent protein catabolism), signal transduction (such as protein amino acid phosphorylation, Rab GTPase activity, and small GTPase mediated signal transduction), transcription, transport, and cell proliferation (including cell cycle, anti-apoptosis, and cell division) (Figure 2 A).
Figure 2
GO analysis of differentially expressed genes in the development of NAFLD. A – GO analysis of differentially expressed genes between SS and HC. B – GO analysis of differentially expressed genes between NASH and HC. C – GO analysis of differentially expressed genes between NASH and SS
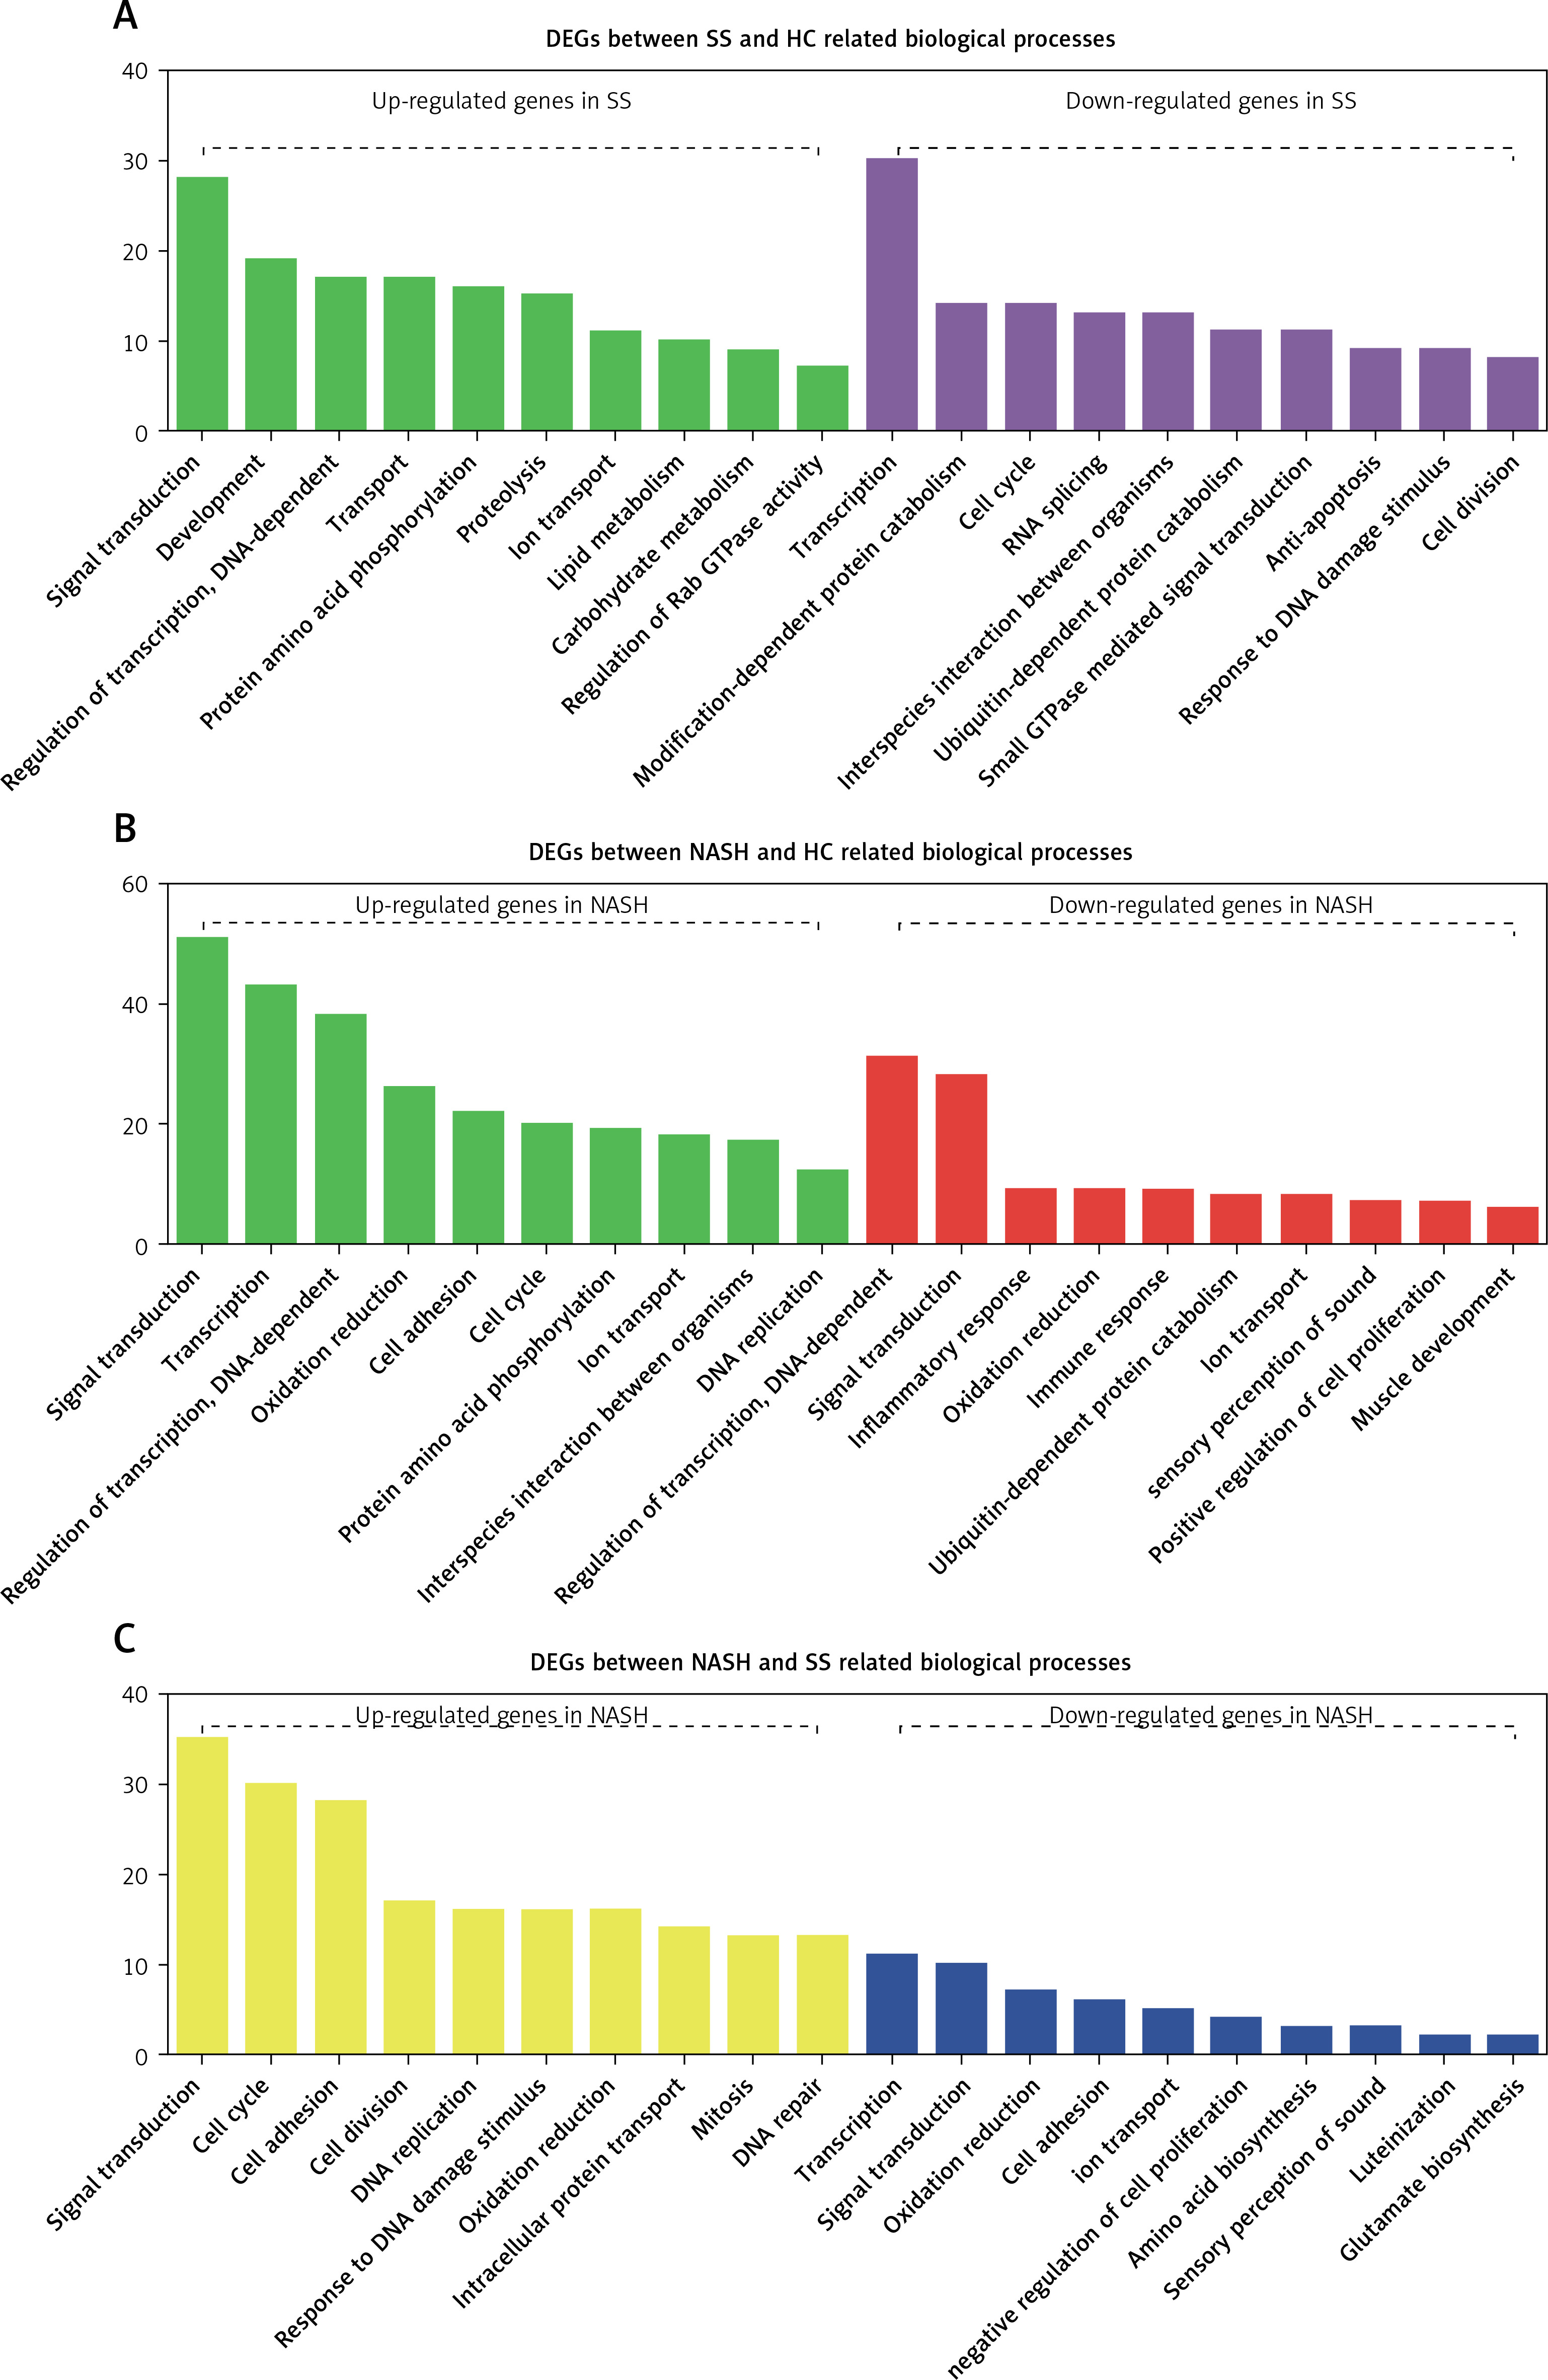
We observed that the DEGs between NASH and HC were mainly involved in regulating signal transduction, transcription, oxidation reduction, cell proliferation and adhesion (including interspecies interaction between organisms, the cell cycle, DNA replication and positive regulation of cell proliferation), the inflammatory response, the immune response, and ubiquitin-dependent protein catabolism (Figure 2 B).
In addition, we demonstrated that the DEGs between NASH and SS were mainly enriched in categories associated with cell proliferation (including the cell cycle, cell division, DNA replication, mitosis and negative regulation of cell proliferation), response to DNA damage stimulus, DNA repair, amino acid and glutamate biosynthesis, signal transduction, oxidation reduction, intracellular protein transport, transcription, and ion transport (Figure 2 C).
KEGG analysis of differentially expressed genes in the development of NAFLD
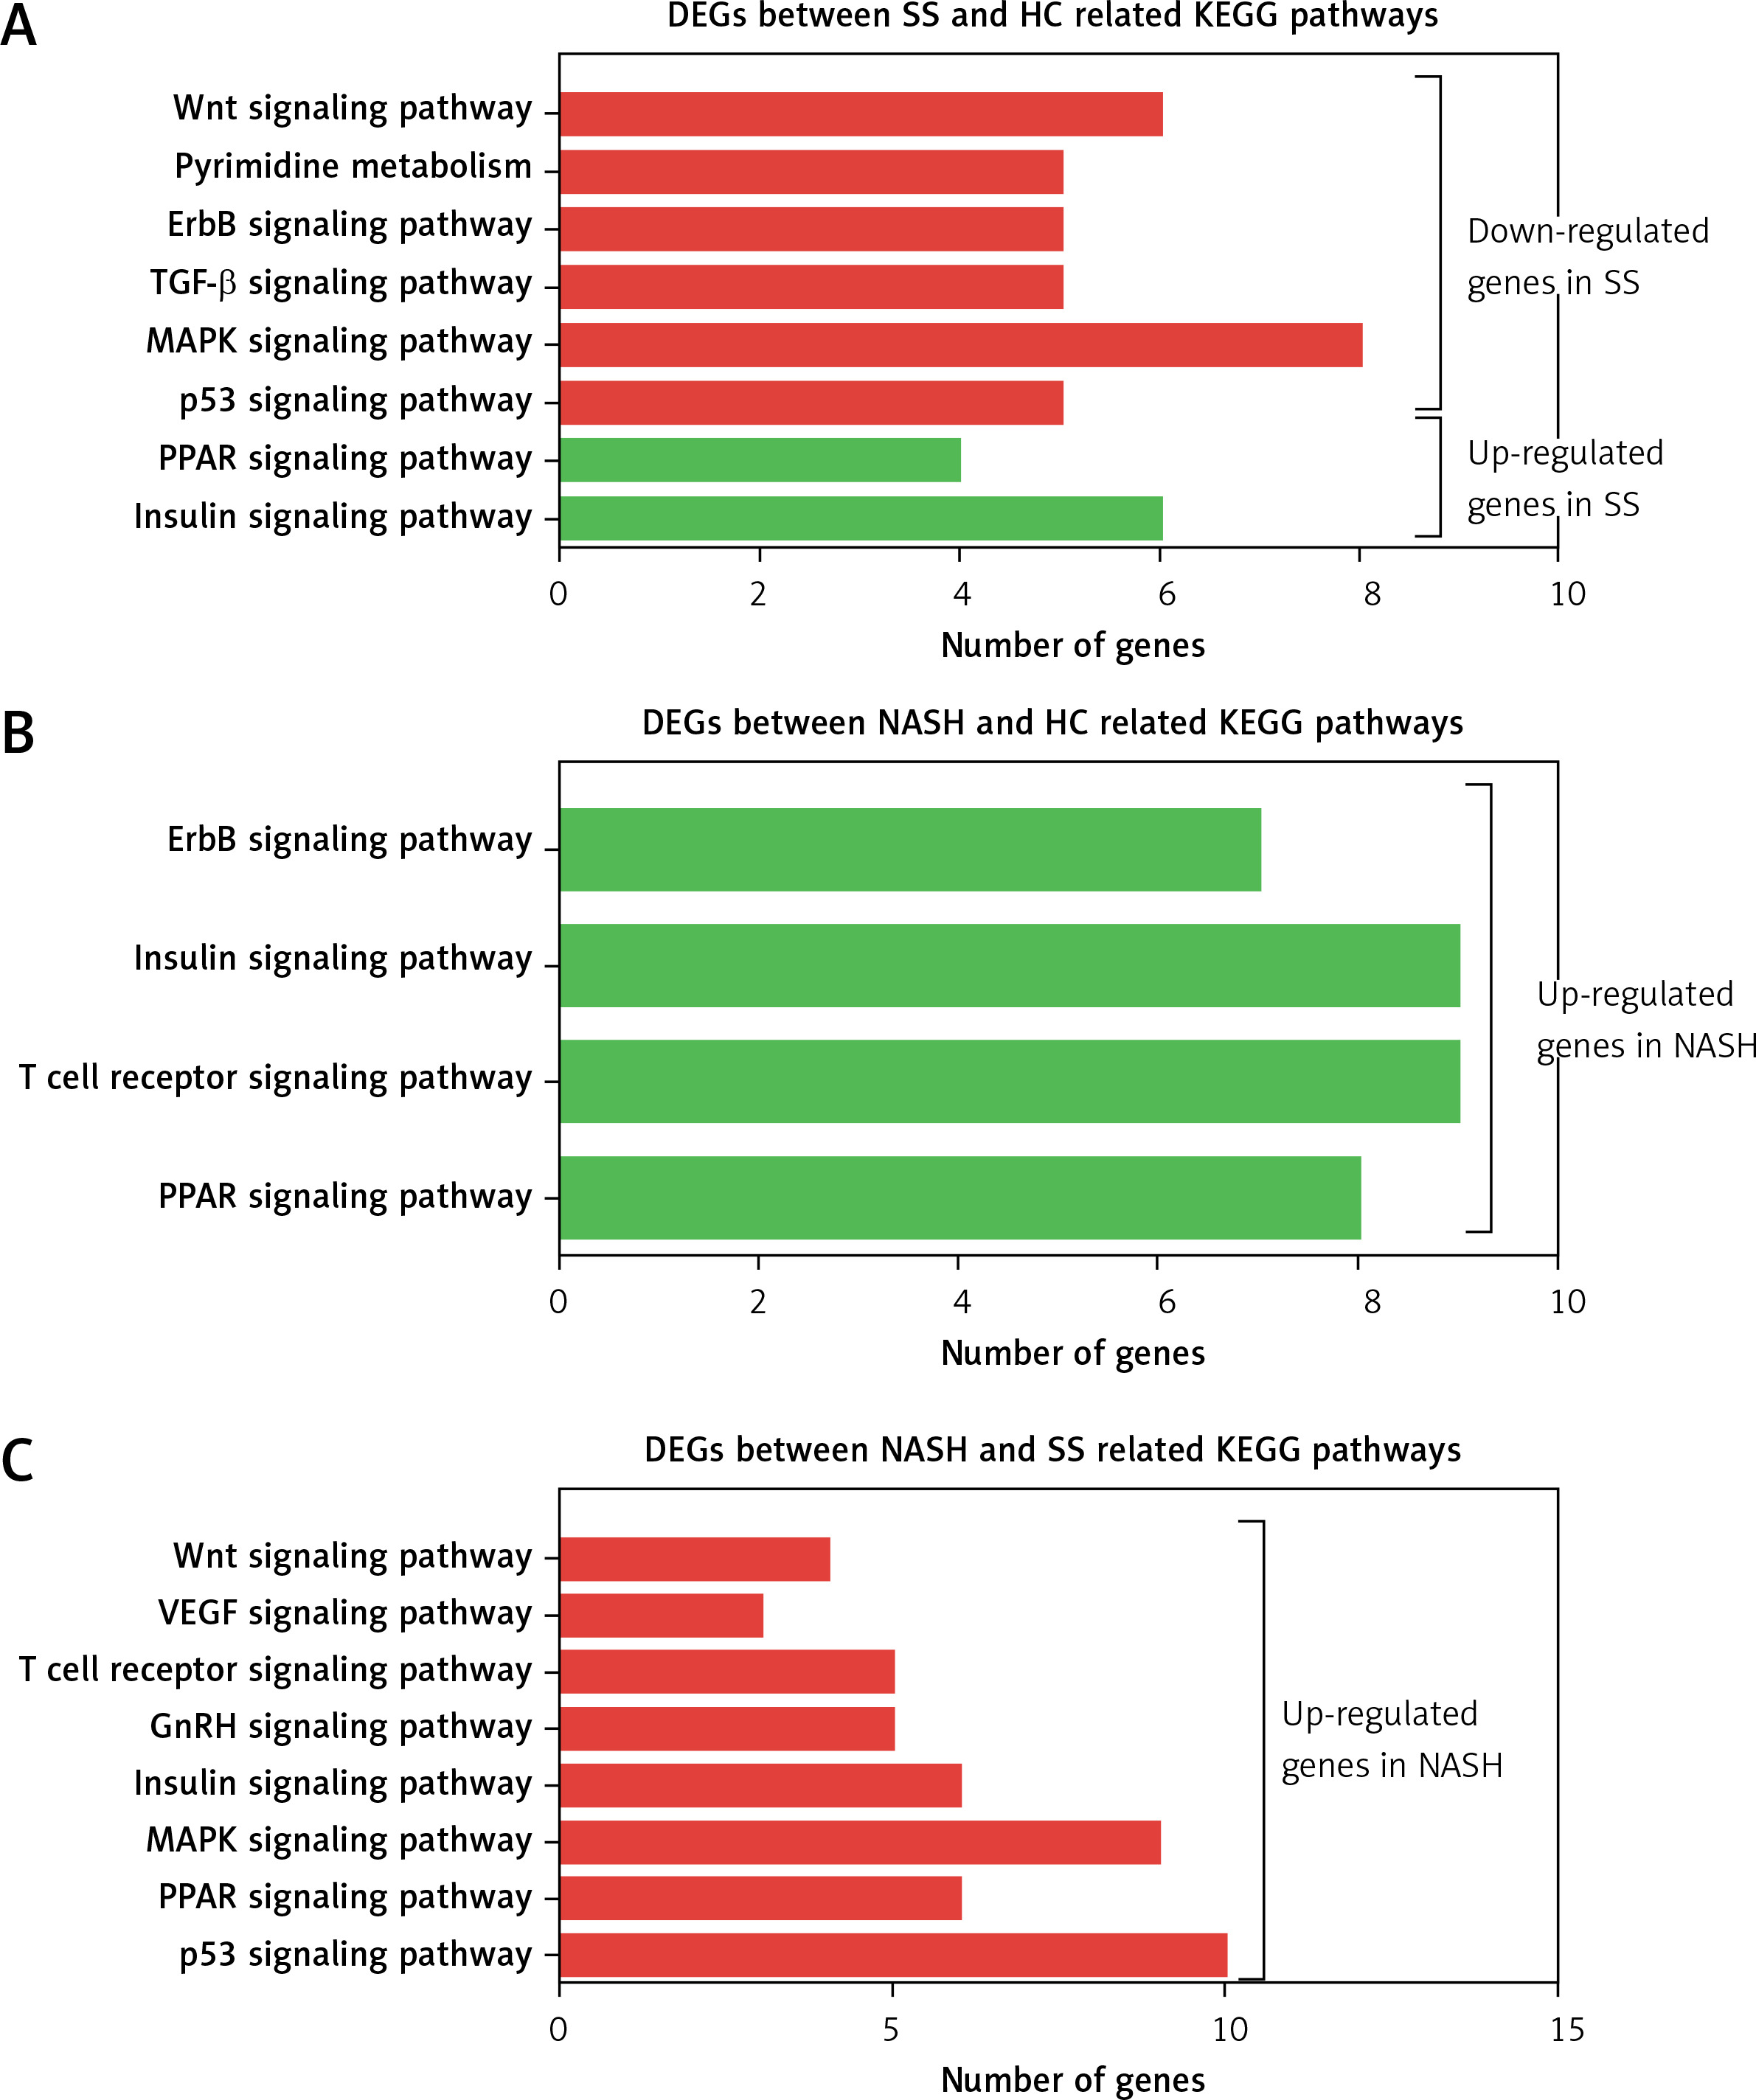
KEGG pathway analysis showed that the DEGs between SS and HC were primarily enriched in pathways associated with the insulin signaling pathway, PPAR signaling pathway, p53 signaling pathway, MAPK signaling pathway, TGF-β signaling pathway, ErbB signaling pathway, pyrimidine metabolism, and the Wnt signaling pathway (Figure 3 A). We found that the DEGs between NASH and HC were mainly involved in the PPAR signaling pathway, T cell receptor signaling pathway, insulin signaling pathway, and ErbB signaling pathway (Figure 3 B). DEGs between NASH and SS were mainly associated with the p53 signaling pathway, PPAR signaling pathway, MAPK signaling pathway, insulin signaling pathway, GnRH signaling pathway, T cell receptor signaling pathway, VEGF signaling pathway, and Wnt signaling pathway (Figure 3 C).
Figure 3
KEGG pathway analysis of differentially expressed genes in the development of NAFLD. A – KEGG pathway analysis of differentially expressed genes between SS and HC. B – KEGG pathway analysis of differentially expressed genes between NASH and HC. C – KEGG pathway analysis of differentially expressed genes between NASH and SS
PPI network construction
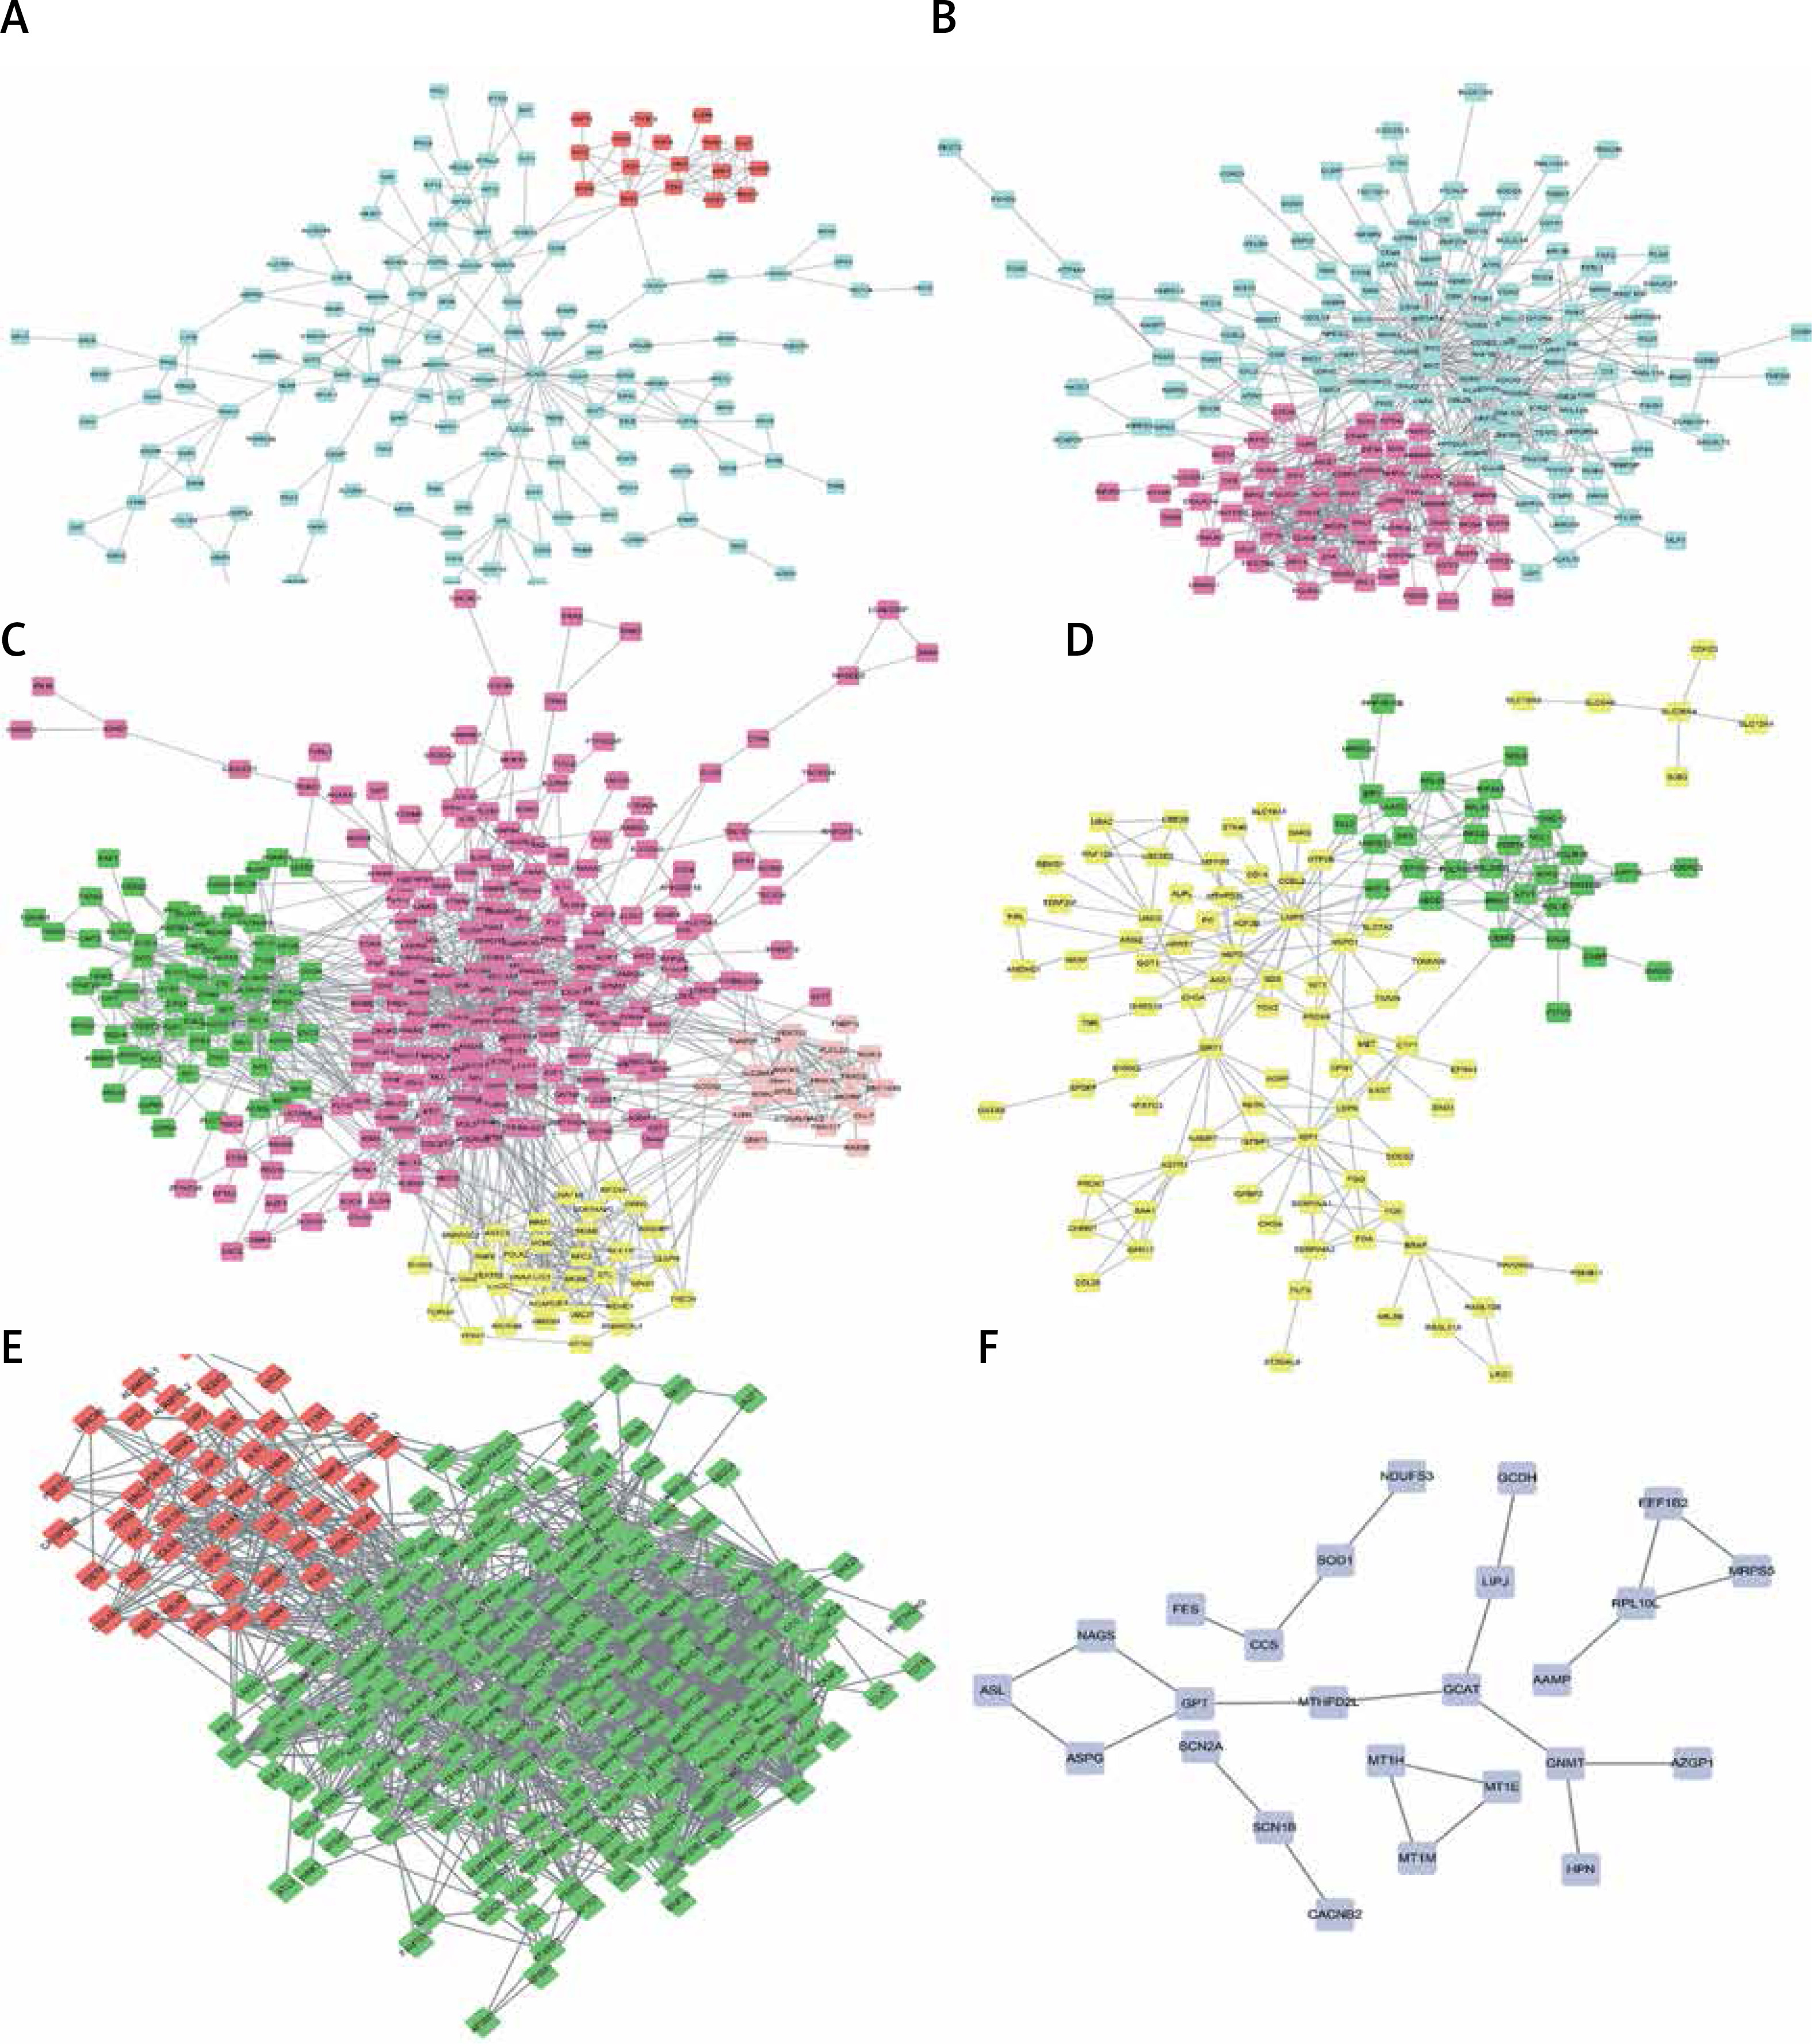
As shown in Figures 4 A–F, PPI networks were constructed for DEGs between SS and HC. We found that OAS3 (degree = 10), ACACB (degree = 9) and NADSYN1 (degree = 8) were the key the hub nodes with the highest connectivity degree in the SS-high module, while TP53 (degree = 39), NHP2L1 (degree = 28) and UMPS (degree = 26) were the key the hub nodes in the SS-low module. We also constructed PPI networks for DEGs between NASH and HC. ACACA (degree = 37), SRC (degree = 32), HDAC9 (degree = 28), UMPS (degree = 20), RSL24D1 (degree = 15), TWISTNB (degree = 14) were the key hub nodes with the highest connectivity degree in the NASH-high or low modules. In addition, 2 modules were identified in the transformation from SS to NASH from the PPI network. TOP2A (degree = 88), PCNA (degree = 55), CHEK1 (degree = 54), RPL10L (degree = 3), ASPG (degree = 2), CCS (degree = 2) were identified as key hub nodes.
Figure 4
Construction of PPI networks for differentially expressed genes in the development of NAFLD. Construction of PPI networks for up- (A) and down-regulated (B) genes in SS compared to HC. Construction of PPI networks for up- (C) and down-regulated (D) genes in NASH compared to HC. Construction of PPI networks for up- (E) and down-regulated (F) genes in NASH compared to SS
DEGs in NAFLD were dysregulated in hepatocellular carcinoma
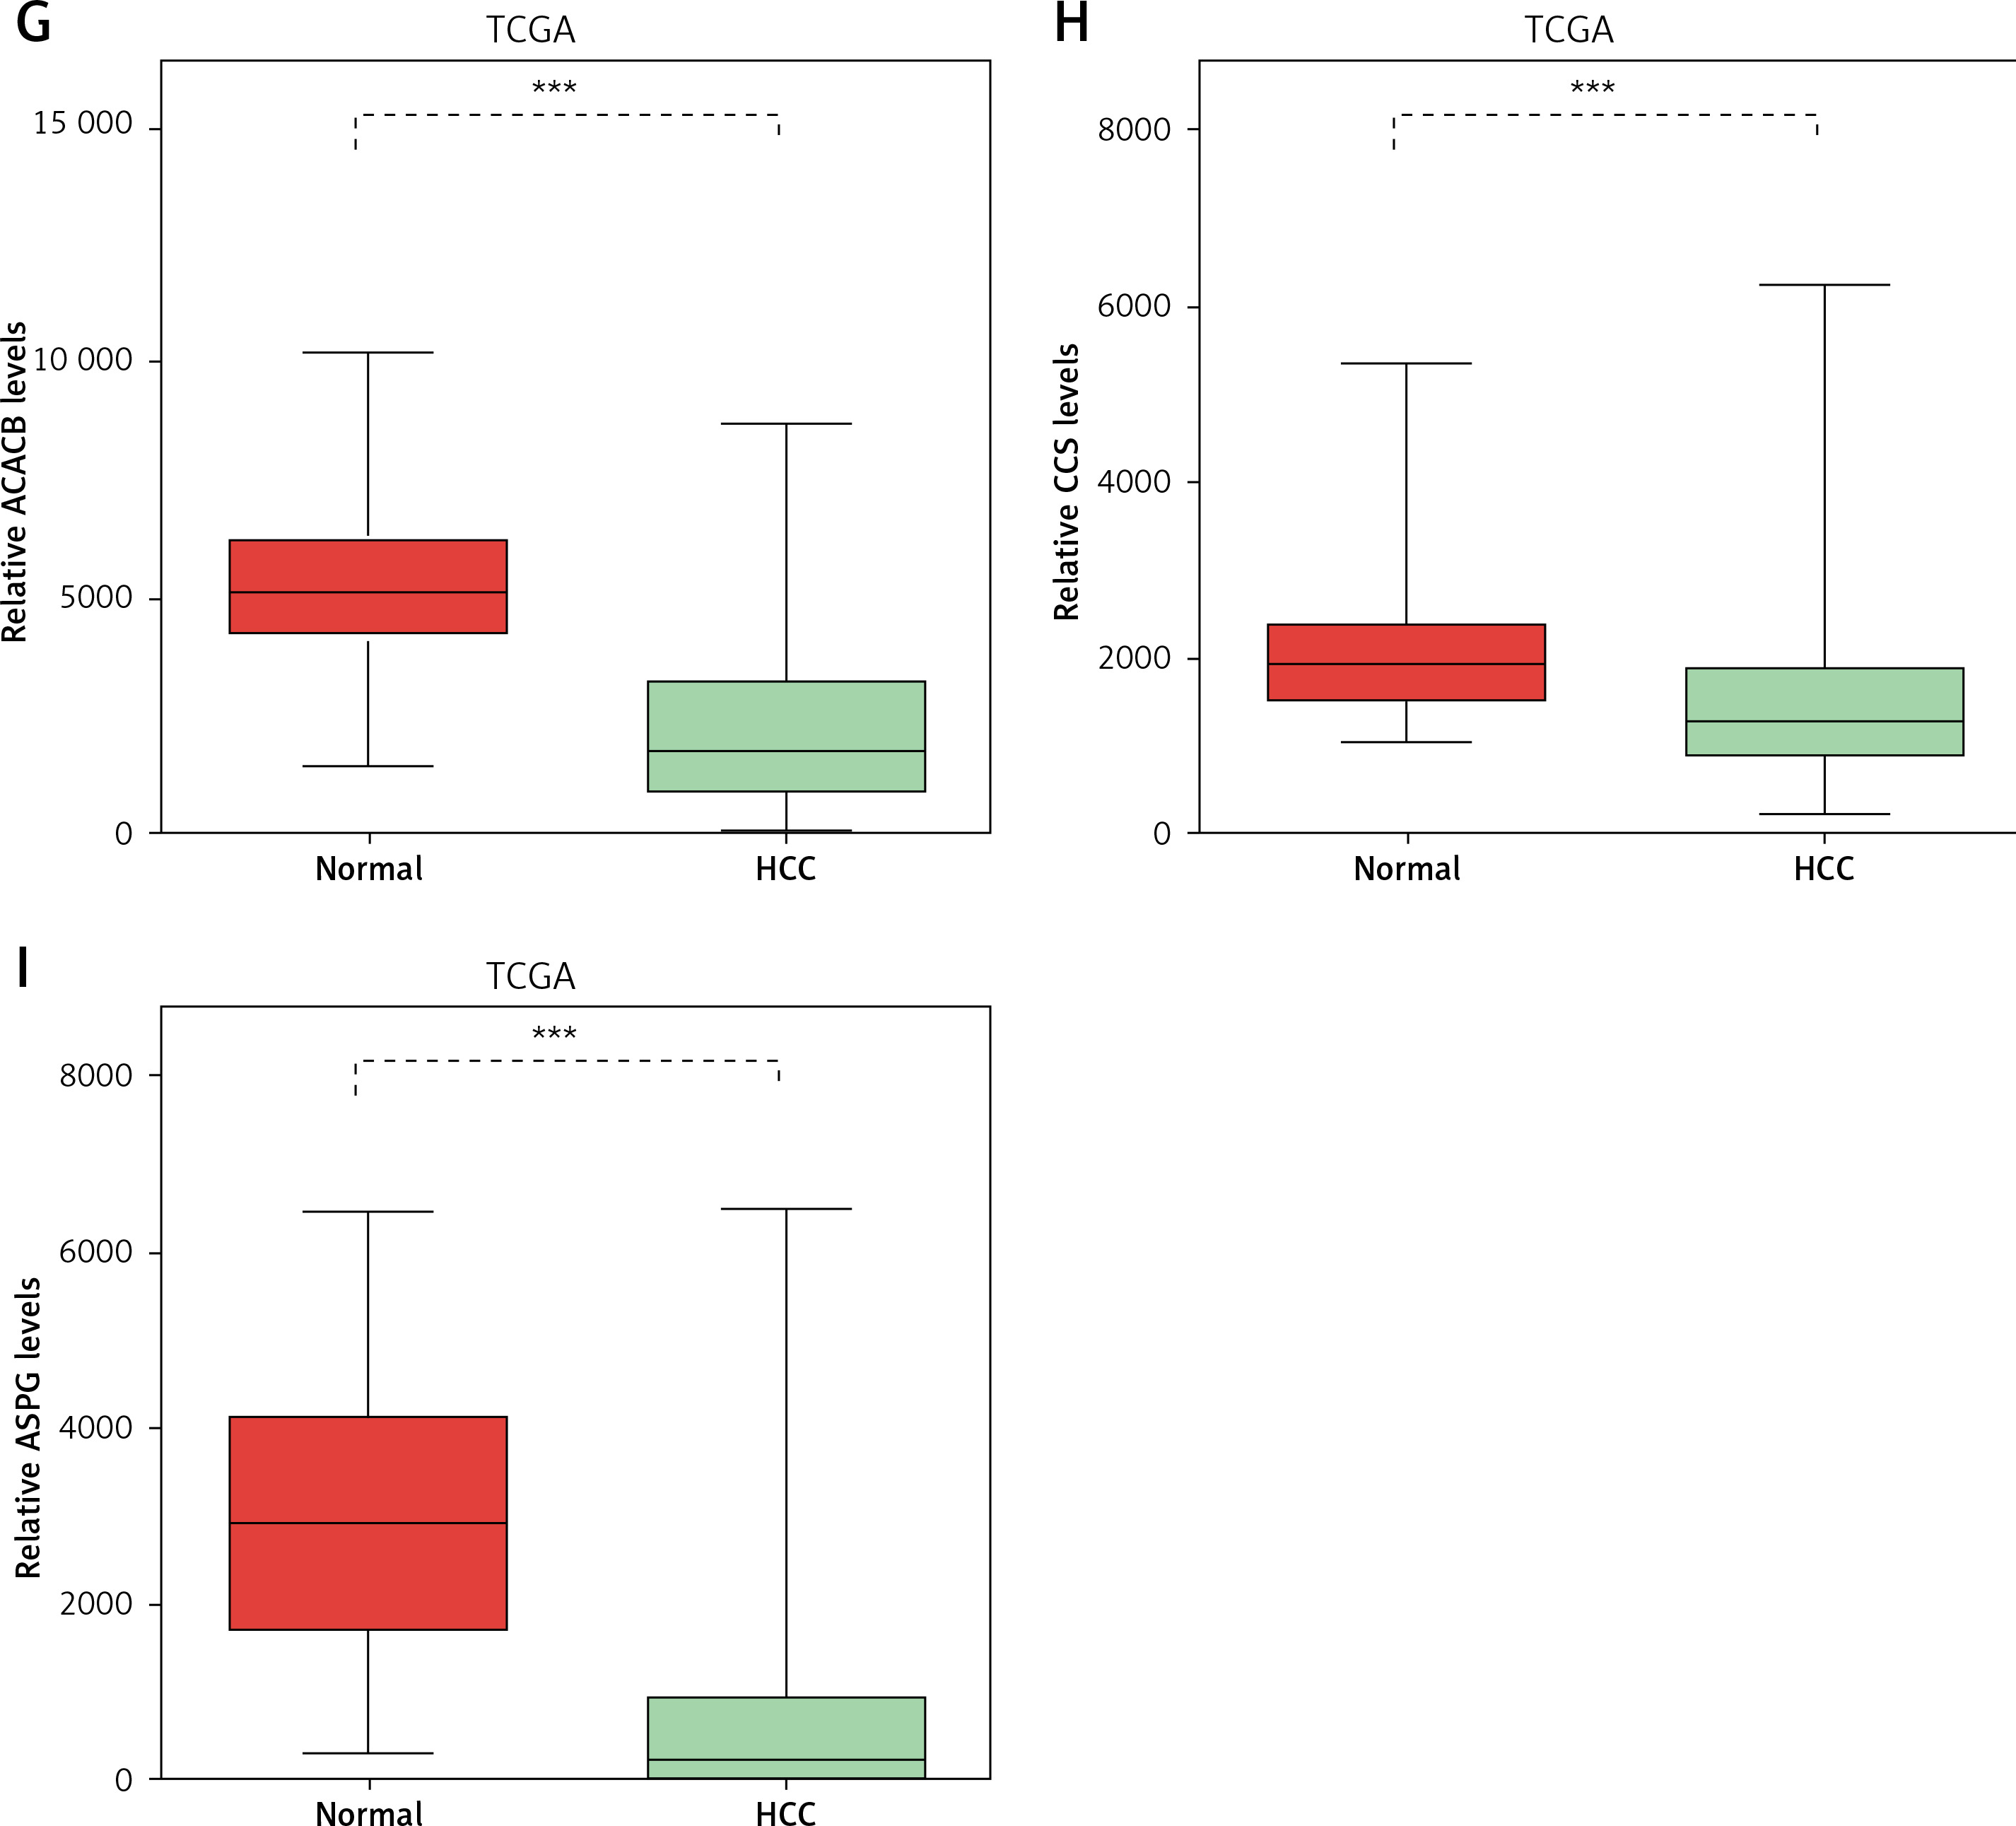
Considering the significant association between NAFLD and HCC, we evaluated the expression pattern of NAFLD DEGs in HCC. Eighteen key genes (ACACA, ACACB, ASPG, CCS, CHEK1, HDAC9, NADSYN1, NHP2L1, OAS3, PCNA, RPL10L, RSL24D1, SRC, TOP2A, TP53, TWISTNB, UMPS) in NAFLD development identified by the PPI network were selected for further study. We found that ACACA, CHEK1, NADSYN1, NHP2L1, PCNA and TOP2A were significantly up-regulated and CCS, ASPG and ACACB were significantly down-regulated in HCC tumor samples compared to normal samples using the TCGA dataset (Figures 5 A–I). These results suggested that DEGs in NAFLD were associated with hepatocellular carcinoma progression.
Figure 5
DEGs in NAFLD were dysregulated in hepatocellular carcinoma. A–I – TCGA data analysis showed that NADSYN1 (A), TOP2A (B), NHP2L1 (C), PCNA (D), CHEK1 (E), and ACACA (F) were up-regulated. ACACB (G), CCS (H), ASPG (I) were down-regulated in hepatocellular carcinoma compared to normal tissues. Significance was defined as p < 0.05 (*p < 0.05; **p < 0.01; ***p < 0.001)
DEGs in NAFLD were associated with hepatocellular carcinoma prognosis
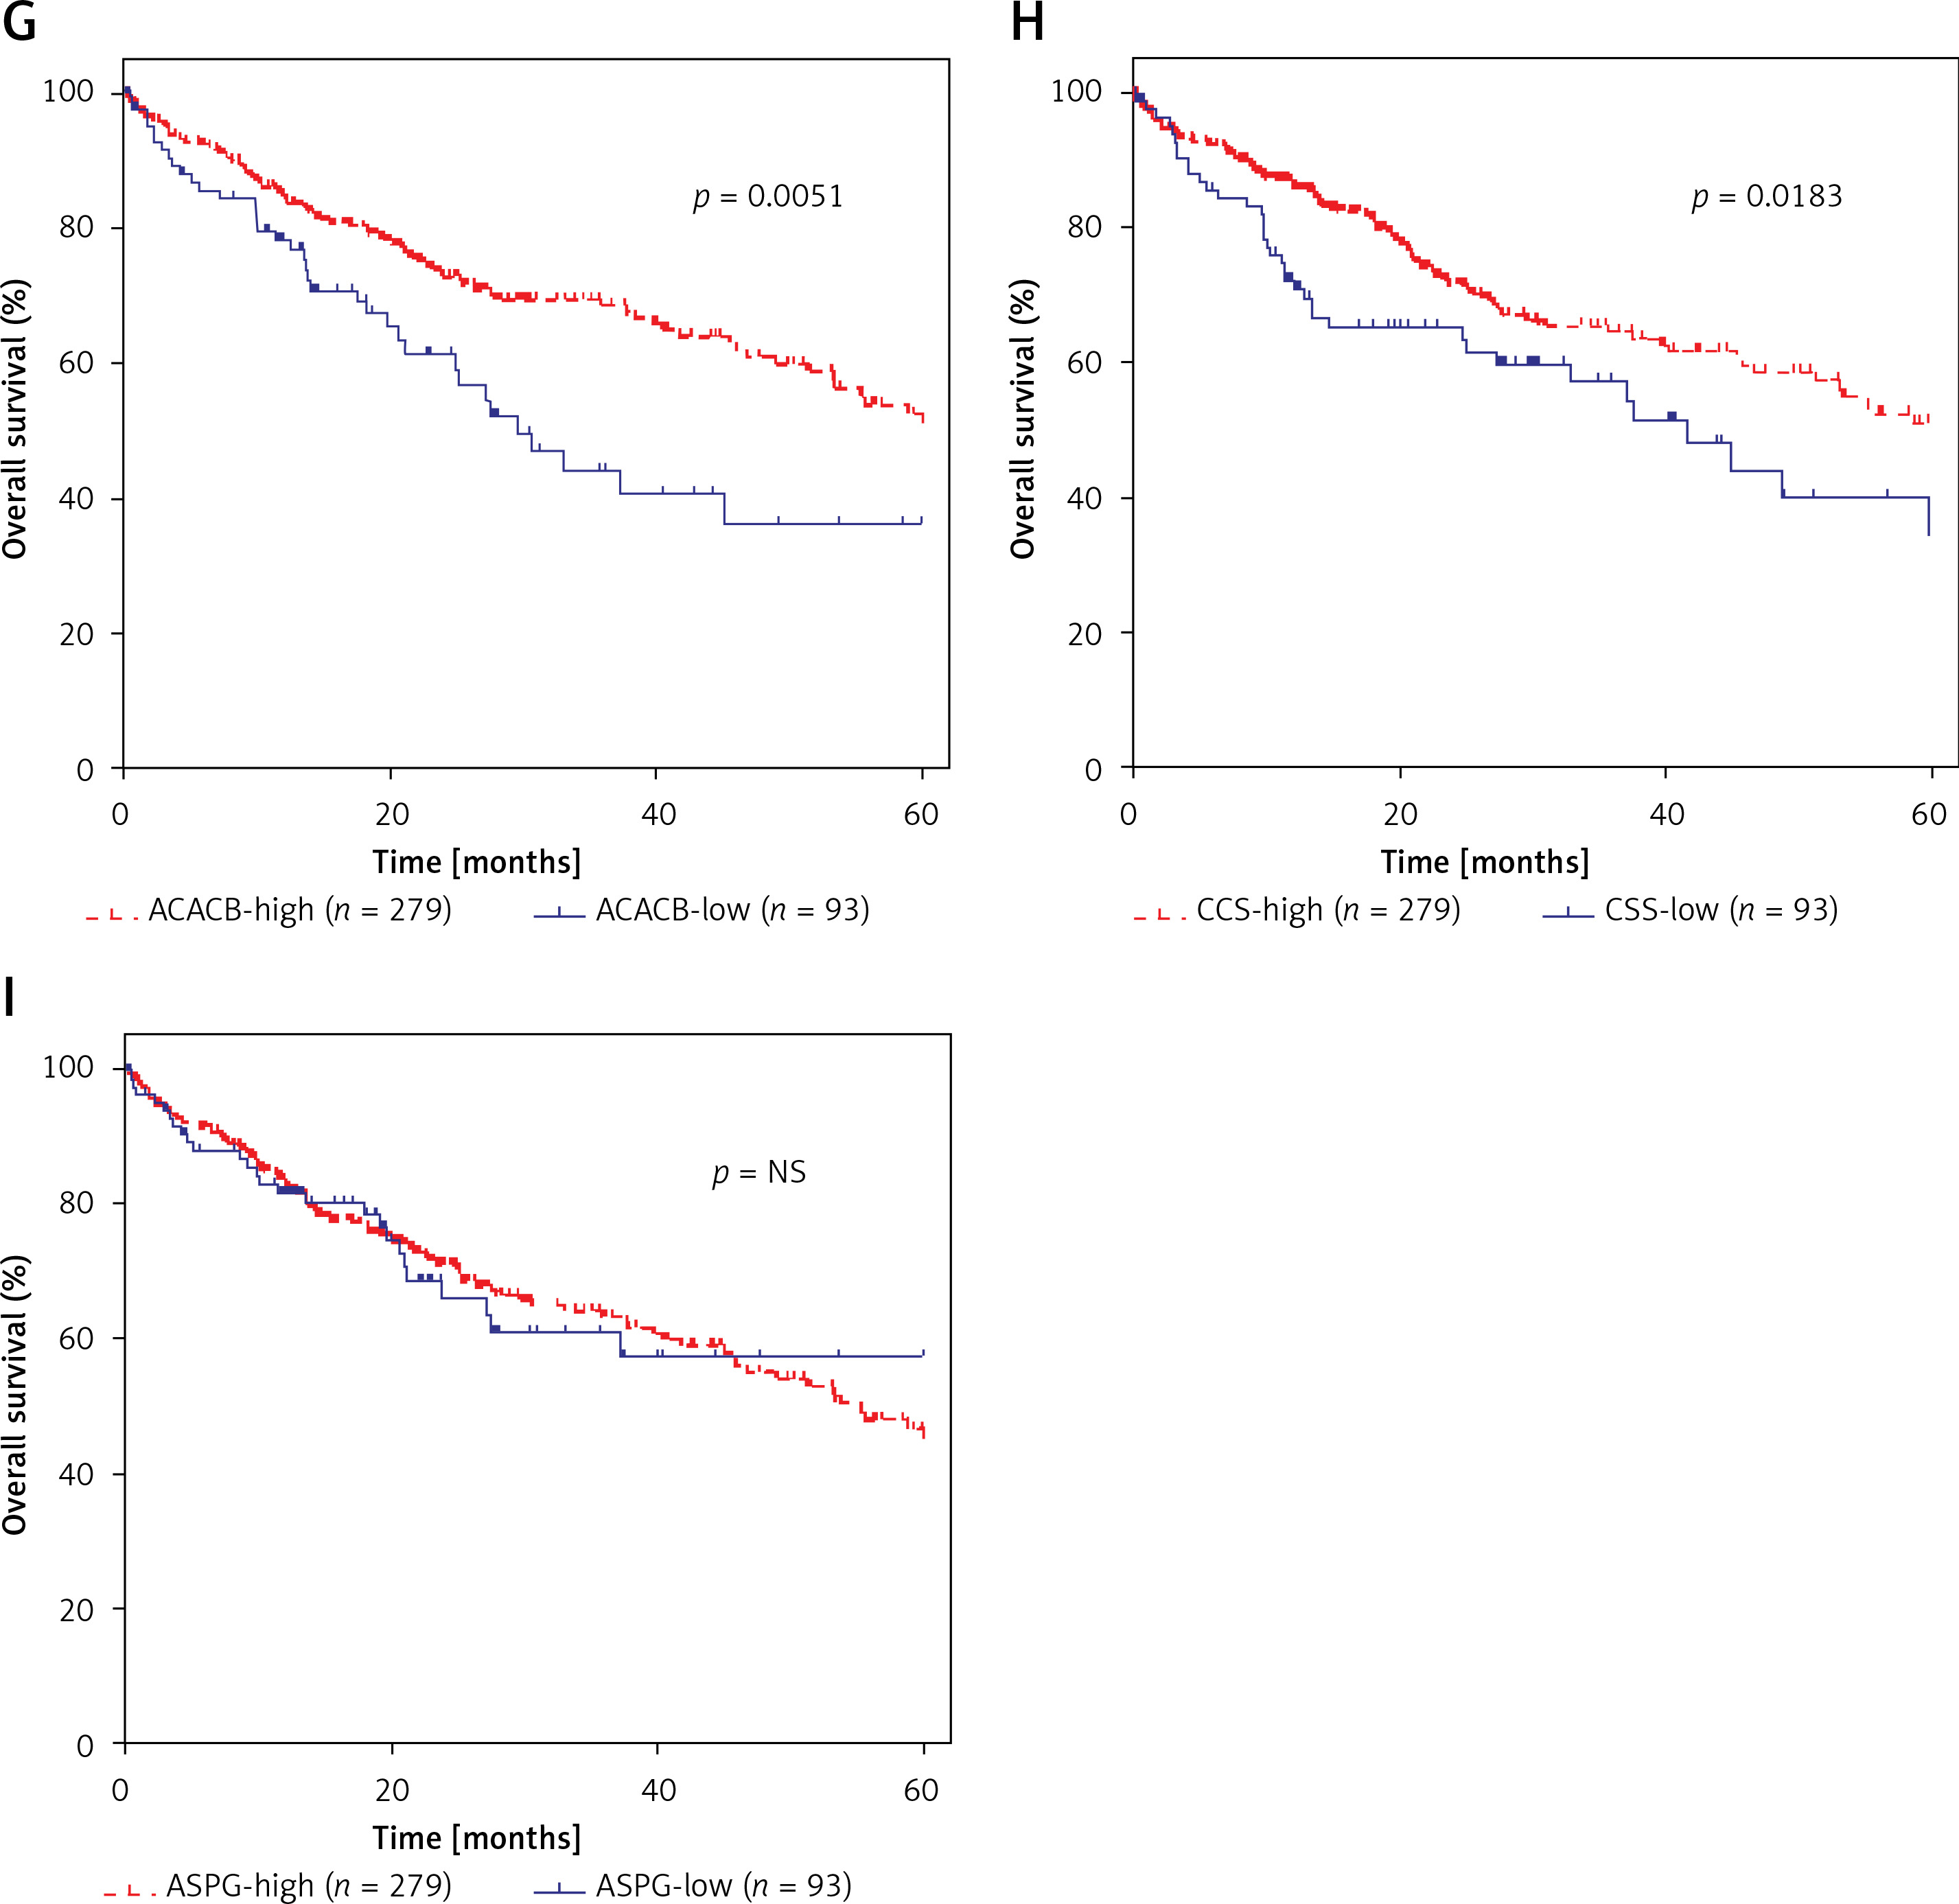
Furthermore, we evaluated the possible prognostic value of ACACA, CHEK1, NADSYN1, NHP2L1, PCNA, TOP2A, CCS, ASPG and ACACB in HCC using TCGA RNA-seq data. As shown in Figures 6 A–I, according to Kaplan-Meier analysis, we found that compared to TOP2A-, NHP2L1-, PCNA-, CHEK1- and ACACA-high patients, the survival rates were higher in low expression patients in the TCGA dataset; however, we observed that CCS- and ACACB-high patients showed higher survival rates compared to CCS- and ACACB-low patients.
Figure 6
DEGs in NAFLD were associated with hepatocellular carcinoma prognosis. A – There was no difference between NADSYN1 high and low expression groups. TCGA data analysis showed that TOP2A (B), NHP2L1 (C), PCNA (D), CHEK1 (E), and ACACA (F) high expression HCC samples had shorter survival time than low-expression patients TCGA data analysis showed that ACACB (G) and CCS (H) high expression HCC samples had longer survival time than low-expression patients. I – There was no difference between ASPG high and low expression groups
Discussion
Nonalcoholic fatty liver disease is one of the most common types of liver disease in the world [1]. However, the molecular mechanisms regulating the development of NAFLD have remained unclear. In this study, we identified a series of DEGs among HC, SS and NASH using GSE89632 and GSE48452 datasets. Next, GO, KEGG, and PPI network analyses were performed to explore the potential roles of these DEGs. Of note, ten DEGs of NAFLD were also found to be dysregulated in HCC.
Recent studies have identified a series of genes including LEP, PEMT, PPAR-γ, TNF-α, PNPLA3 and CD14 that were associated with NAFLD development [8, 11–13]. However, there was still lacking a comprehensive analysis of DEGs in NAFLD development. In this study, we analyzed GSE89632 and GSE48452 datasets to identify differentially expressed mRNAs among the different stages of NAFLD. We observed 334 up- and 286 down-regulated mRNAs in SS and found 518 up- and 261 down-regulated mRNAs in NASH compared with HC. Of note, 396 up- and 114 down-regulated mRNAs were observed in NASH compared with SS. Next, we performed GO and KEGG analysis to explore the potential mechanism regulating NAFLD development.
In previous reports, metabolic syndrome had been shown to be associated with NAFLD [8–10]. Our GO analysis results identified a series of metabolism-related pathways, including proteolysis, lipid metabolism, carbohydrate metabolism, modification-dependent protein catabolism, oxidation reduction, glutamate biosynthesis, and ubiquitin-dependent protein catabolism, which were consistent with these reports. We also observed that cell proliferation and adhesion-related genes were also dysregulated in NAFLD. Of note, we found that the DEGs between NASH and HC were mainly involved in the inflammatory response and immune response. KEGG pathway analysis showed that the DEGs in NAFLD were primarily enriched in pathways associated with the insulin signaling pathway, PPAR signaling pathway, p53 signaling pathway, and MAPK signaling pathway. Of note, our findings about the insulin signaling pathway were also consistent with previous reports [18, 19], suggesting that this pathway could be an important potential therapeutic target for NAFLD.
Protein-protein interaction network analysis has been a useful tool to identify key regulators in human diseases, such as laryngeal carcinoma [20], colorectal cancer [21, 22] and glioma [23]. Here, we for the first time constructed NAFLD associated PPI networks. Eighteen key genes (ACACA, ACACB, ASPG, CCS, CHEK1, HDAC9, NADSYN1, NHP2L1, OAS3, PCNA, RPL10L, RSL24D1, SRC, TOP2A, TP53, TWISTNB, UMPS) were identified to be key hub nodes with the highest connectivity degree in NAFLD development. Previous reports demonstrated that about 10–15% of NASH patients can progress to cirrhosis and hepatocellular carcinoma (HCC) [6, 7]. To test whether these eighteen key genes were also involved in HCC progression, we explored their expression pattern in HCC using TCGA data. We found that ACACA, CHEK1, NADSYN1, NHP2L1, PCNA and TOP2A were significantly up-regulated and CCS, ASPG and ACACB were significantly down-regulated in HCC tumor samples compared to normal samples. Kaplan-Meier analysis showed that the low level of TOP2A, NHP2L1, PCNA, CHEK1 and ACACA and high level of CCS and ACACB were correlated with a longer survival time.
In conclusion, we analyzed two public datasets to identify differentially expressed mRNAs in the progression of NAFLD. GO analysis showed that DEGs were mainly involved in regulating a series of metabolism-related pathways (including proteolysis and lipid metabolism), cell proliferation and adhesion, inflammatory response, and immune response. KEGG pathway analysis showed that DEGs in NAFLD were mainly enriched in the insulin signaling pathway, PPAR signaling pathway, p53 signaling pathway, and MAPK signaling pathway. We also constructed PPI networks for these DEGs. Interestingly, we observed that key hub nodes in PPI networks were also associated with the progression of HCC. Although further validation is still needed, we believe this study will provide useful information to explore the potential candidate biomarkers for diagnosis, prognosis, and drug targets of NAFLD.