Introduction
Hypertrophic cardiomyopathy (HCM) is a genetically heterogeneous disorder of cardiac myocytes with an estimated prevalence of 0.2% in the general population [1]. Hypertrophic cardiomyopathy has been one of the main reasons for sudden cardiac death of young people [2]. Clinically, myocyte hypertrophy, disarray, and interstitial fibrosis are the common pathological features [3]. Of note, about 25% of HCM patients demonstrate left ventricular outflow tract obstruction [4]. Recent studies have revealed several genes and pathways associated with HCM progression. For example, MYH7 and MYBPC3 mutations were the two most common mutations in HCM and were found in about half of the patients with familial HCM [5]. Baertling et al. found that mutations in COA6 could cause neonatal hypertrophic cardiomyopathy [6]. Moreover, the Hippo/YAP pathway was found to be activated in HCM [7]. However, the mechanism underlying HCM progression remained unclear. Therefore, there was still an urgent need to identify novel regulators to understand the molecular mechanism involved in HCM.
Long non-coding RNAs (lncRNA) are a novel class of noncoding RNAs longer than 200 nucleotides without protein-coding function [8]. LncRNAs were reported to regulate target genes at transcriptional, post-transcriptional, and post-translational regulation levels in different types of human diseases, such as cancer, acute myocardial infarction and osteoarthritis [9]. In HCM, several studies have focused on the potential roles of lncRNAs. For example, Kitow et al. [10] found that mitochondrial lncRNAs functioned as blood-based biomarkers for cardiac remodeling in HCM patients. Yang et al. [11] also identified 965 up-regulated and 461 down-regulated lncRNAs in HCM. However, these reports just focused on differentially expressed lncRNAs in a small sample size.
In this study, we analyzed a public dataset (GSE36961) to identify differentially expressed lncRNAs and mRNAs in HCM. Protein–protein interaction (PPI) networks were constructed to reveal potential roles of differentially expressed proteins. Furthermore, co-expression analysis was performed to identify hub lncRNAs in HCM. This study will provide useful information to explore the potential biomarkers for diagnosis and prognosis in HCM.
Material and methods
Microarray data
The microarray data of GSE36961 contributed by Suresh et al. [12] were downloaded from the National Center of Biotechnology Information (NCBI) Gene Expression Omnibus database (GEO, http://www.ncbi.nlm.nih.gov/geo/). A total of 39 control samples and 106 HCM samples were included in this dataset.
LncRNA classification pipeline
In present study, we identified differentially expressed lncRNAs in HCM by adopting criteria reported by Zhang et al. [13]. Briefly, first, the GPL570 platform of Affymetrix Human Genome U133 Plus 2.0 Array (Affymetrix Inc., Santa Clara, California, USA) probe set ID was mapped to the NetAffx Annotation Files (HG-U133 Plus 2.0 Annotations, CSV format, release 31, 08/23/10). The annotations included the probe set ID, gene symbol, and Refseq transcript ID. Second, the probe sets that were assigned a Refseq transcript ID in the NetAffx annotations were extracted. In this study, we only retained those labeled as “NR_” (NR indicates non-coding RNA in the Refseq database). Finally, 2448 annotated lncRNA transcripts with corresponding Affymetrix probe IDs were generated.
Differentially expressed genes
The raw datasets of HCM from GEO were downloaded and preprocessed by log2 transformation. All sample data were normalized using the limma package in R software version 3.3.0 (https://www.r-project.org/). The differentially expressed mRNA and lncRNAs were identified by the linear models for microarray analysis (Limma) method [14]. The differentially expressed genes (DEGs) were obtained with thresholds of |logFC| > 1.5 and p < 0.001.
The hierarchical cluster analysis of differentially expressed mRNAs and lncRNAs was performed using CLUSTER 3.0, and the hierarchical clustering heat map was visualized by Tree View [15].
Construction of PPI network and module analysis
In order to predict protein interactions, which include physical and functional associations, the present study used the Search Tool for the Retrieval of Interacting Genes (STRING) to construct the PPI network for DEGs (minimum required interaction score > 0.4) [16]. In addition, Cytoscape software version 3.4.0 (http://cytoscape.org/download_old_versions.html) was used for visualization of the PPI networks [17]. Following the construction of the PPI network, a module analysis of the network was performed using the Mcode plugin (degree cut-off ≥ 2 and the nodes with edges ≥ 2-core) [18]. Additionally, the Network Analyzer was used to compute the basic properties of the PPI network, including average clustering coefficient distribution, closeness centrality, average neighborhood connectivity, node degree distribution, shortest path length distribution, and topological coefficients [19].
Co-expression network construction and analysis
In this study, the Pearson correlation coefficient of DEG-lncRNA pairs was calculated according to their expression value. The co-expressed DEG-lncRNA pairs with the absolute value of Pearson’s correlation coefficient ≥ 0.6 were selected and the co-expression network was established using Cytoscape software.
GO and KEGG pathway analysis
To identify functions of DEGs in HCM, we performed GO function enrichment analysis in 3 functional ontologies: biological process (BP), cellular component (CC) and molecular function (MF) [20]. KEGG pathway enrichment analysis was also performed to identify pathways enriched in HCM using the MAS system (Molecule Annotation System, http://bioinfo.capitalbio.com/mas3/). A p-value less than 0.05 was considered as significant.
Statistical analysis
The numerical data were presented as mean ± standard deviation (SD) of at least three determinations. Statistical comparisons between groups of normalized data were performed using the t-test or Mann-Whitney U-test according to the test condition. A p < 0.05 was considered statistically significant with a 95% confidence level.
Results
Identification of DEGs and lncRNAs in HCM
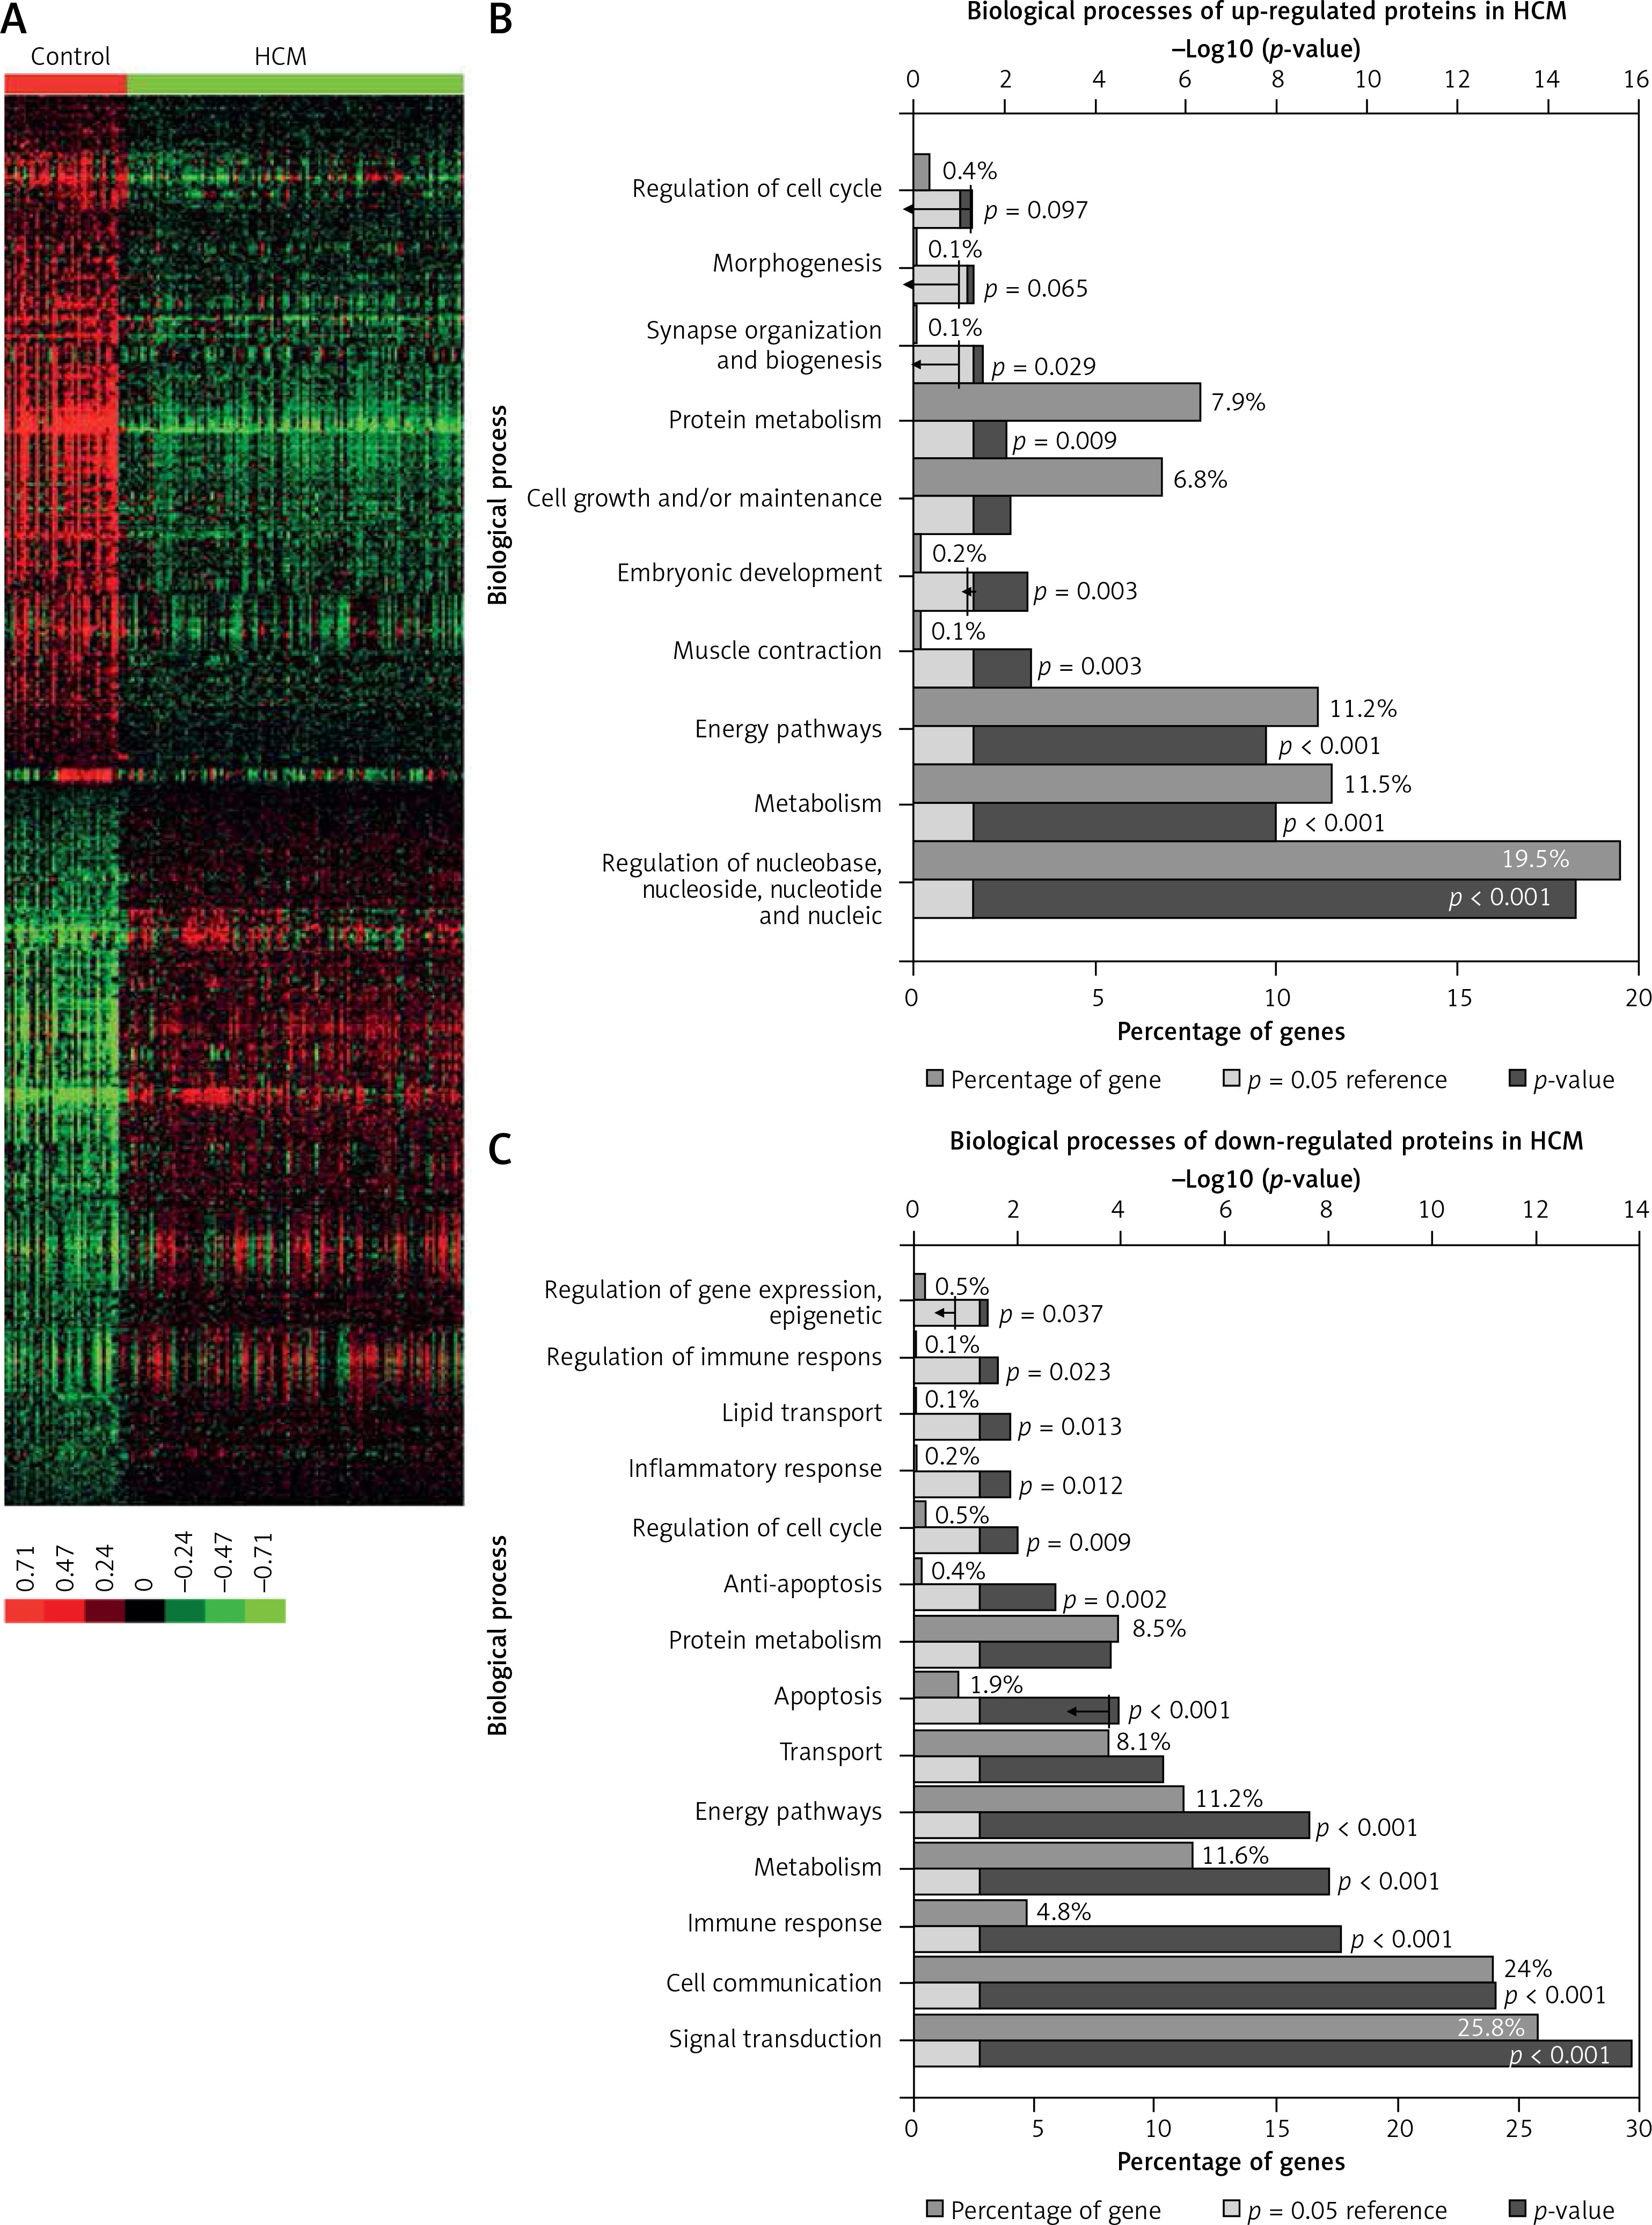
In the present study, we analyzed a public HCM expression profiling dataset (GSE36961) to identify DEGs. A total of 39 control samples and 106 HCM samples were included in GSE36961 (Supplementary Table I). We identified 6158 mRNAs with differential expression (p < 0.001) between HCM samples and normal tissues. Of these DEGs, 3127 mRNAs were up-regulated and 3021 mRNAs were down-regulated in HCM compared to control samples. Hierarchical clustering analysis of the DEGs in HCM is shown in Figure 1 A.
Figure 1
Identification of DEGs and lncRNAs in HCM. A – Hierarchical clustering analysis shows differential gene expression in the HCM by using GSE36961. DEG analysis shows 3127 up-regulated mRNAs and 3021 down-regulated mRNAs in HCM. B – GO analysis shows up-regulated DEG associated biological processes in HCM. C – GO analysis shows down-regulated DEG associated biological processes in HCM
Functional annotation of DEGs in HCM
Furthermore, we performed GO analysis for differentially expressed mRNAs. GO analysis showed that the up-regulated DEGs were mainly involved in regulating Regulation of nucleobase metabolism, Metabolism, Energy pathways, Muscle contraction, Embryonic development, Cell growth and/or maintenance, Protein metabolism, and Synapse organization and biogenesis (Figure 1 B).
Meanwhile, the down-regulated DEGs were associated with Signal transduction, Cell communication, Immune response, Metabolism, Energy pathways, Transport, Apoptosis, Protein metabolism, Anti-apoptosis, Regulation of cell cycle, Inflammatory response, Lipid transport, Regulation of immune response, Regulation of gene expression, epigenetic, and Regulation of cell proliferation (Figure 1 C).
PPI network analysis of DEGs in HCM
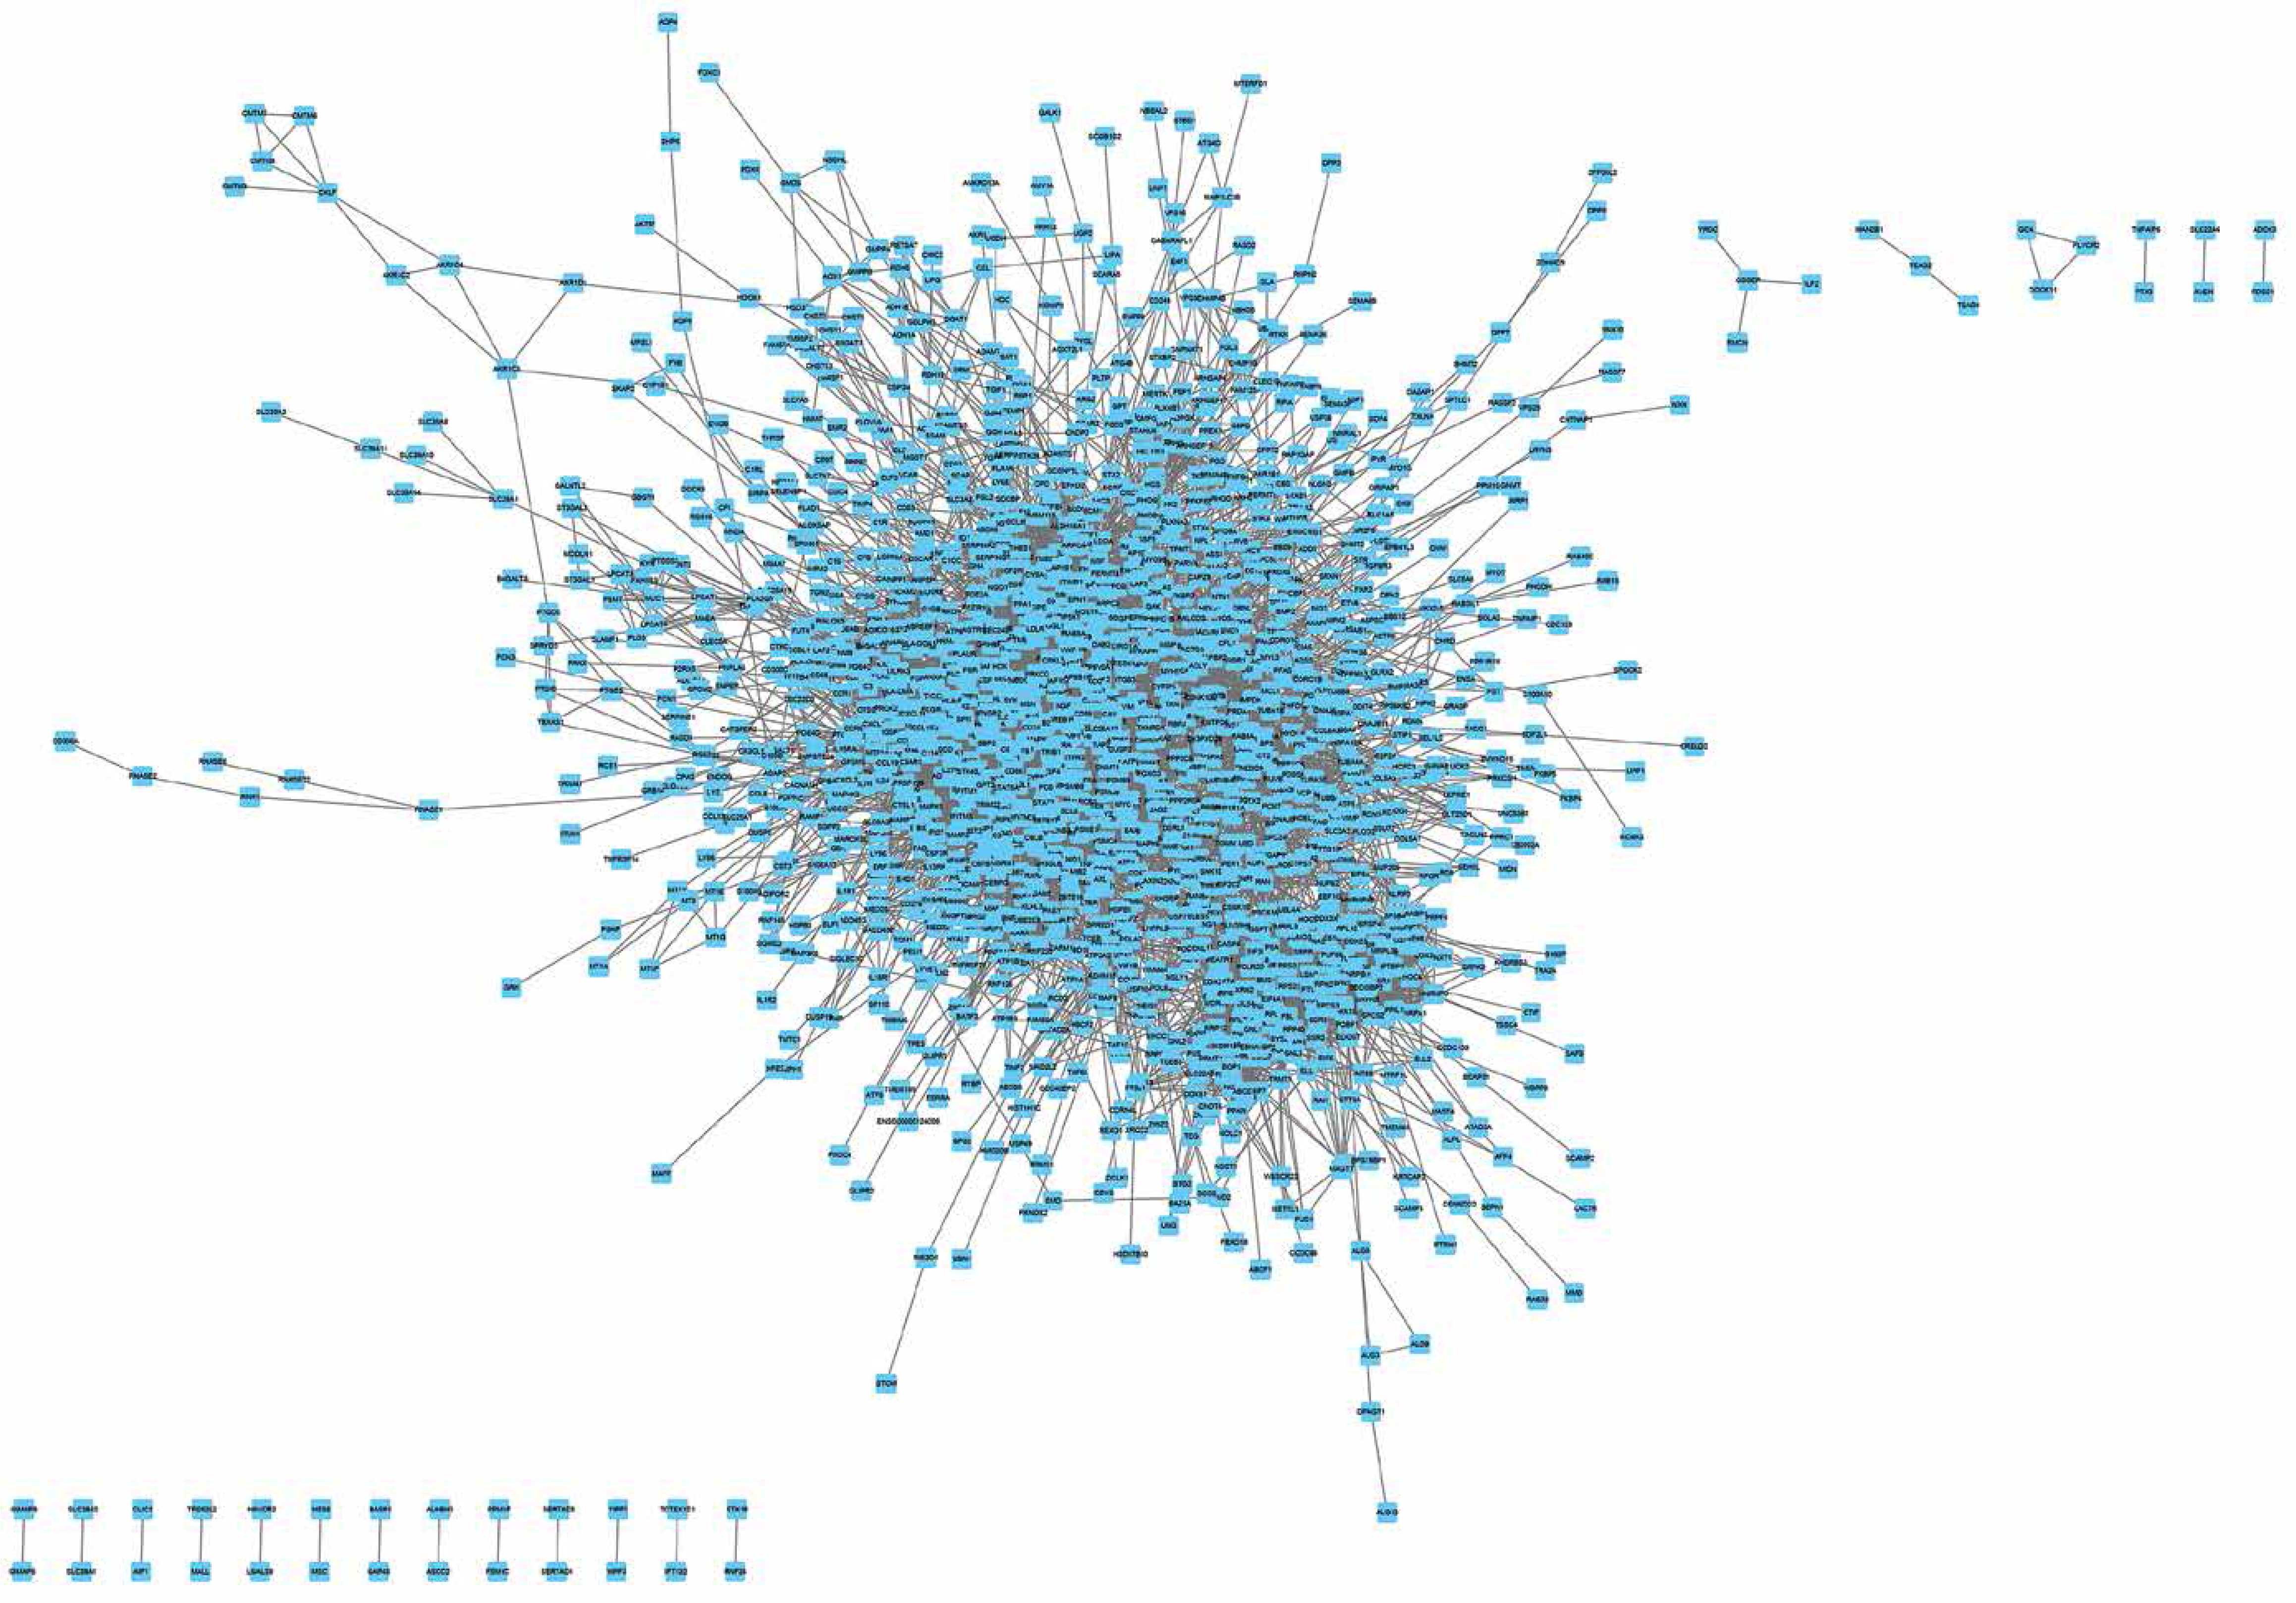
The STRING database was used to predict the interaction between 3127 up- and 3021 down-regulated proteins in HCM (combined score > 0.7). We found that the up-regulated PPI network included 1232 nodes and 5261 edges (Figure 2), and the down-regulated PPI network included 1447 nodes and 8751 edges (Figure 3). Several proteins were found to play more important roles in HCM and interacted with more than 50 proteins. The nodes that had higher degrees included up-regulated UBB (degree = 120), POLR2C (degree = 71), POLR2L (degree = 69), POLR2B (degree = 68), and POLR2G (degree = 63) and down-regulated IL-6 (degree = 90), JUN (degree = 79), ACTB (degree = 78), MAPK3 (degree = 76), and MYC (degree = 69). Finally, the PPI network was constructed using Cytoscape and is shown in Figure 3.
Figure 2
Up-regulated PPI network analysis of DEGs in HCM. We constructed a PPI network for up-regulated proteins in HCM. We found that the up-regulated PPI network included 1232 nodes and 5261 edges
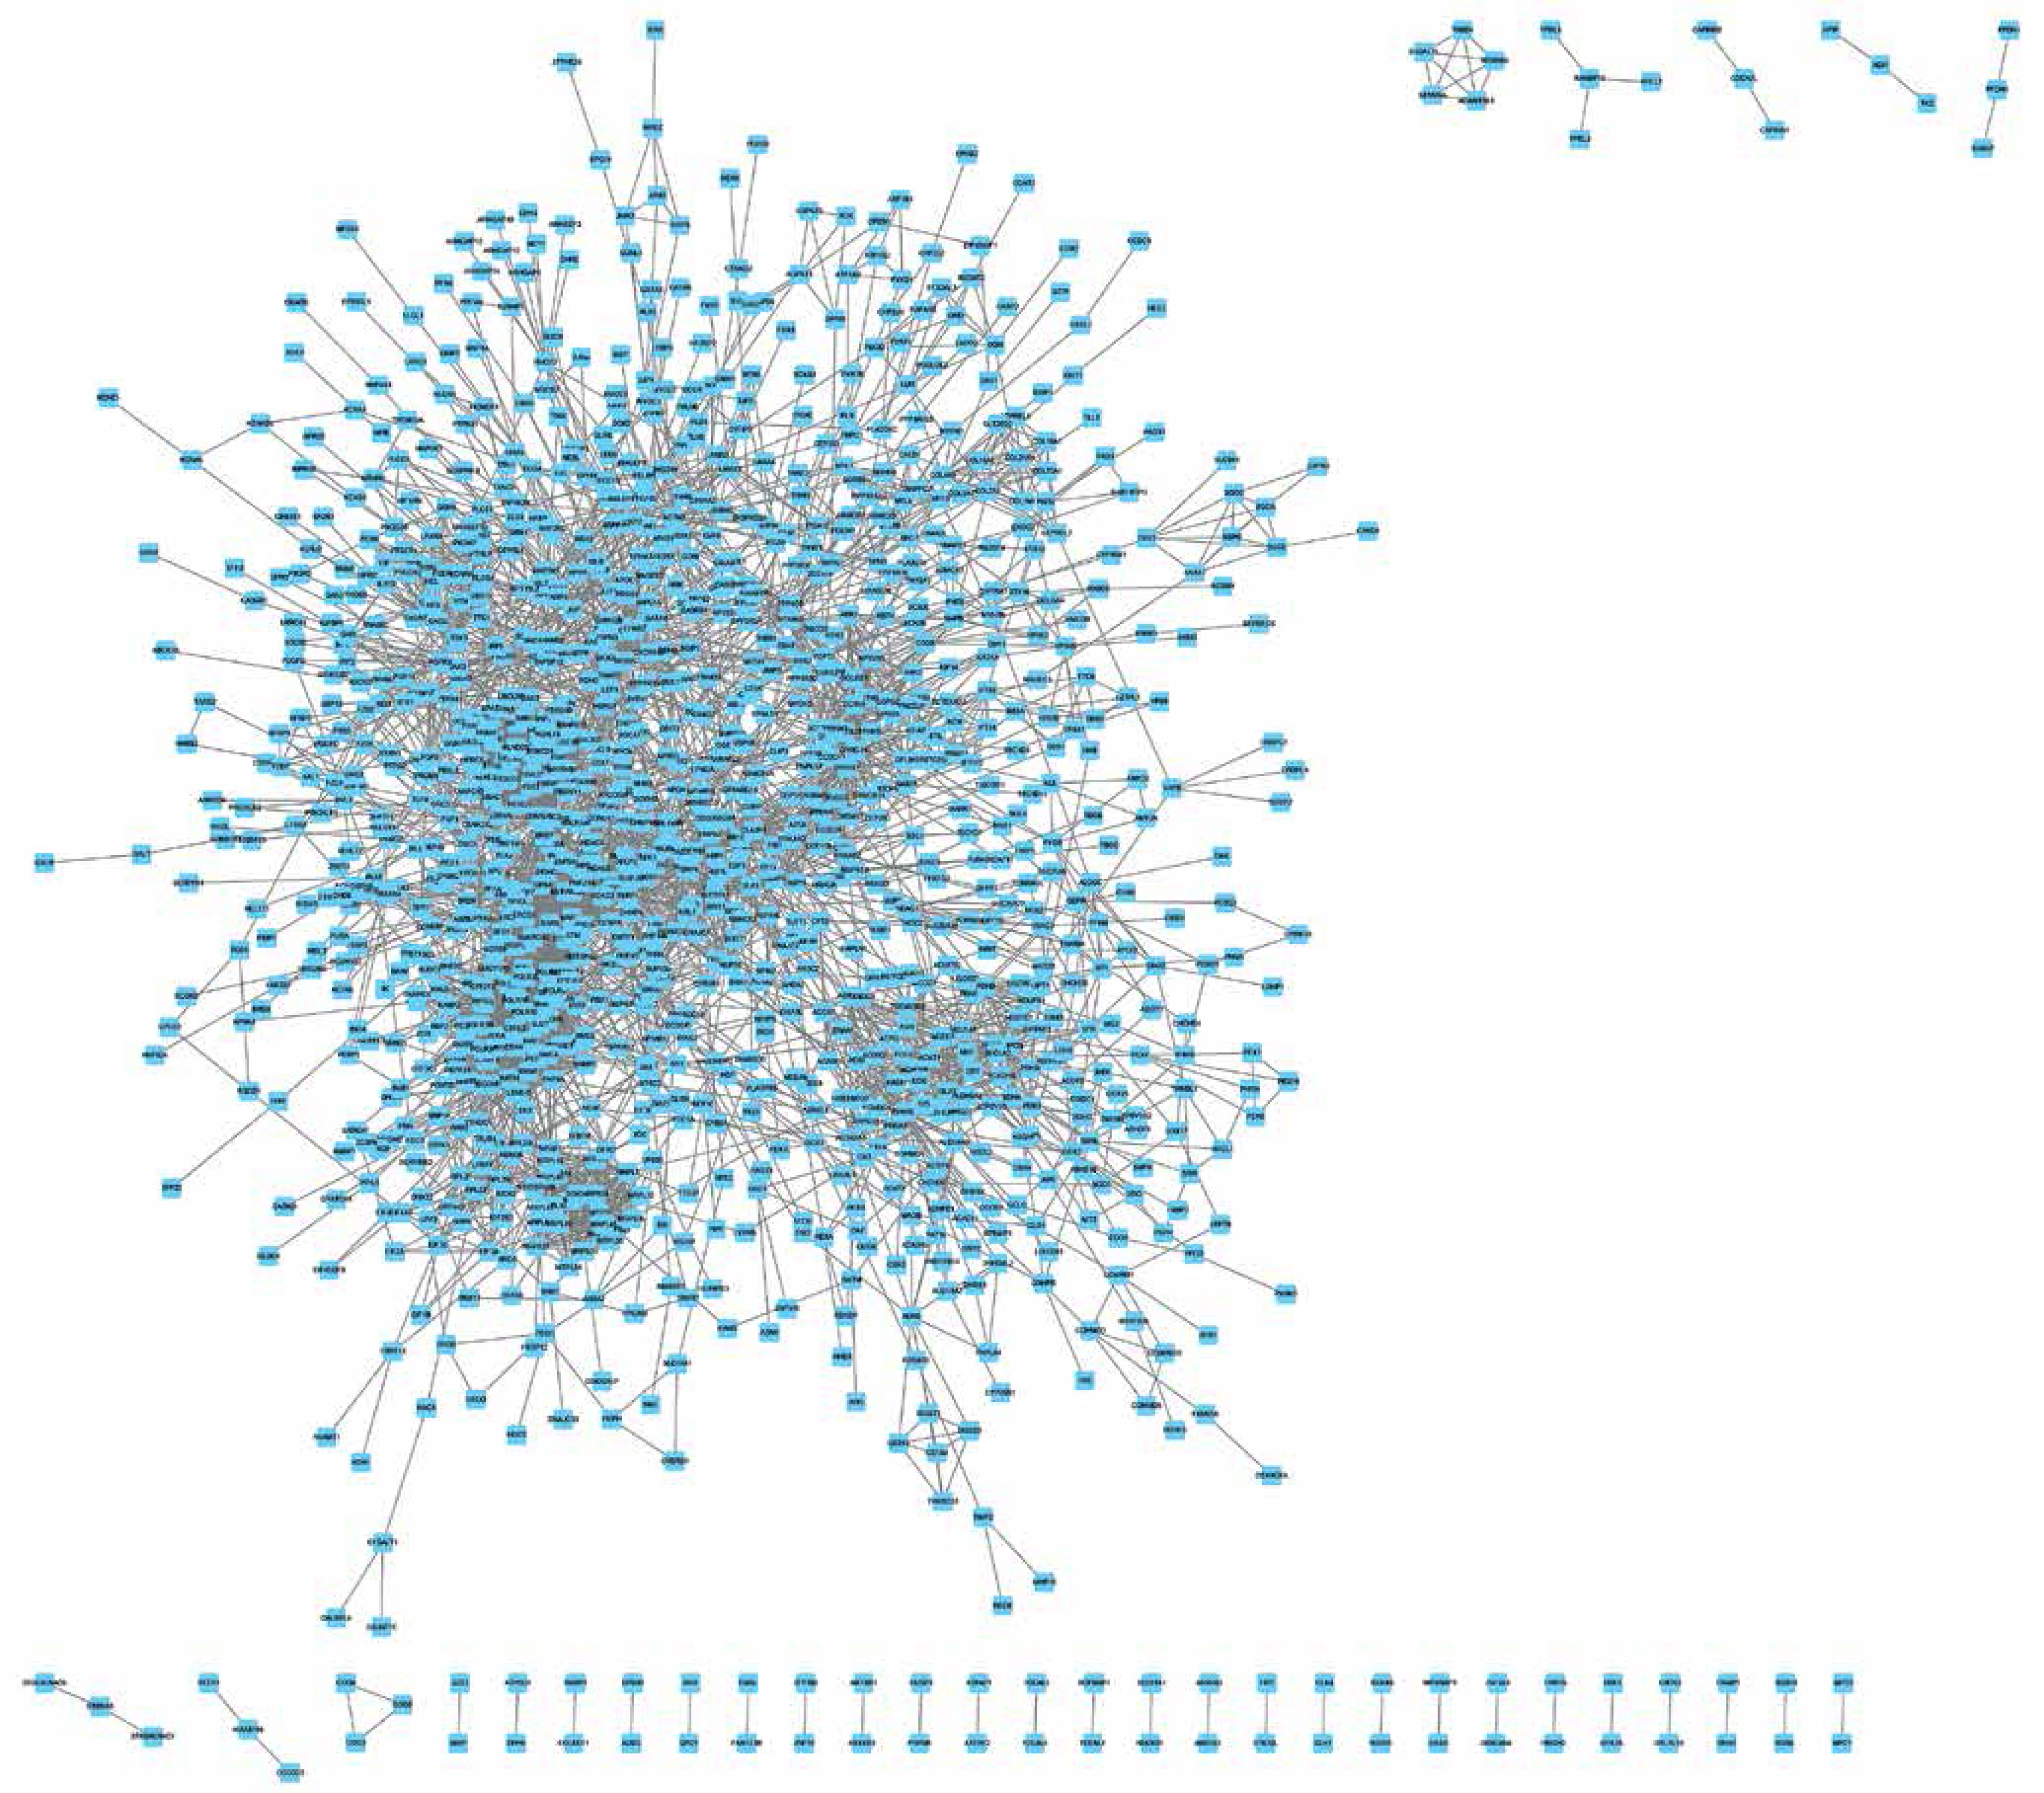
Figure 3
Down-regulated PPI network analysis of DEGs in HCM. We constructed a PPI network for down-regulated proteins in HCM. We found that the up-regulated PPI network included 1447 nodes and 8751 edges
Following the construction of the PPI network, a module analysis of the network was performed using the Mcode plugin (degree cut-off ≥ 3 and the nodes with edges ≥ 3-core). A total of 35 hub-networks were identified in the up-regulated DEG mediated PPI networks and 34 hub-networks were identified in the down-regulated DEG-mediated PPI networks.
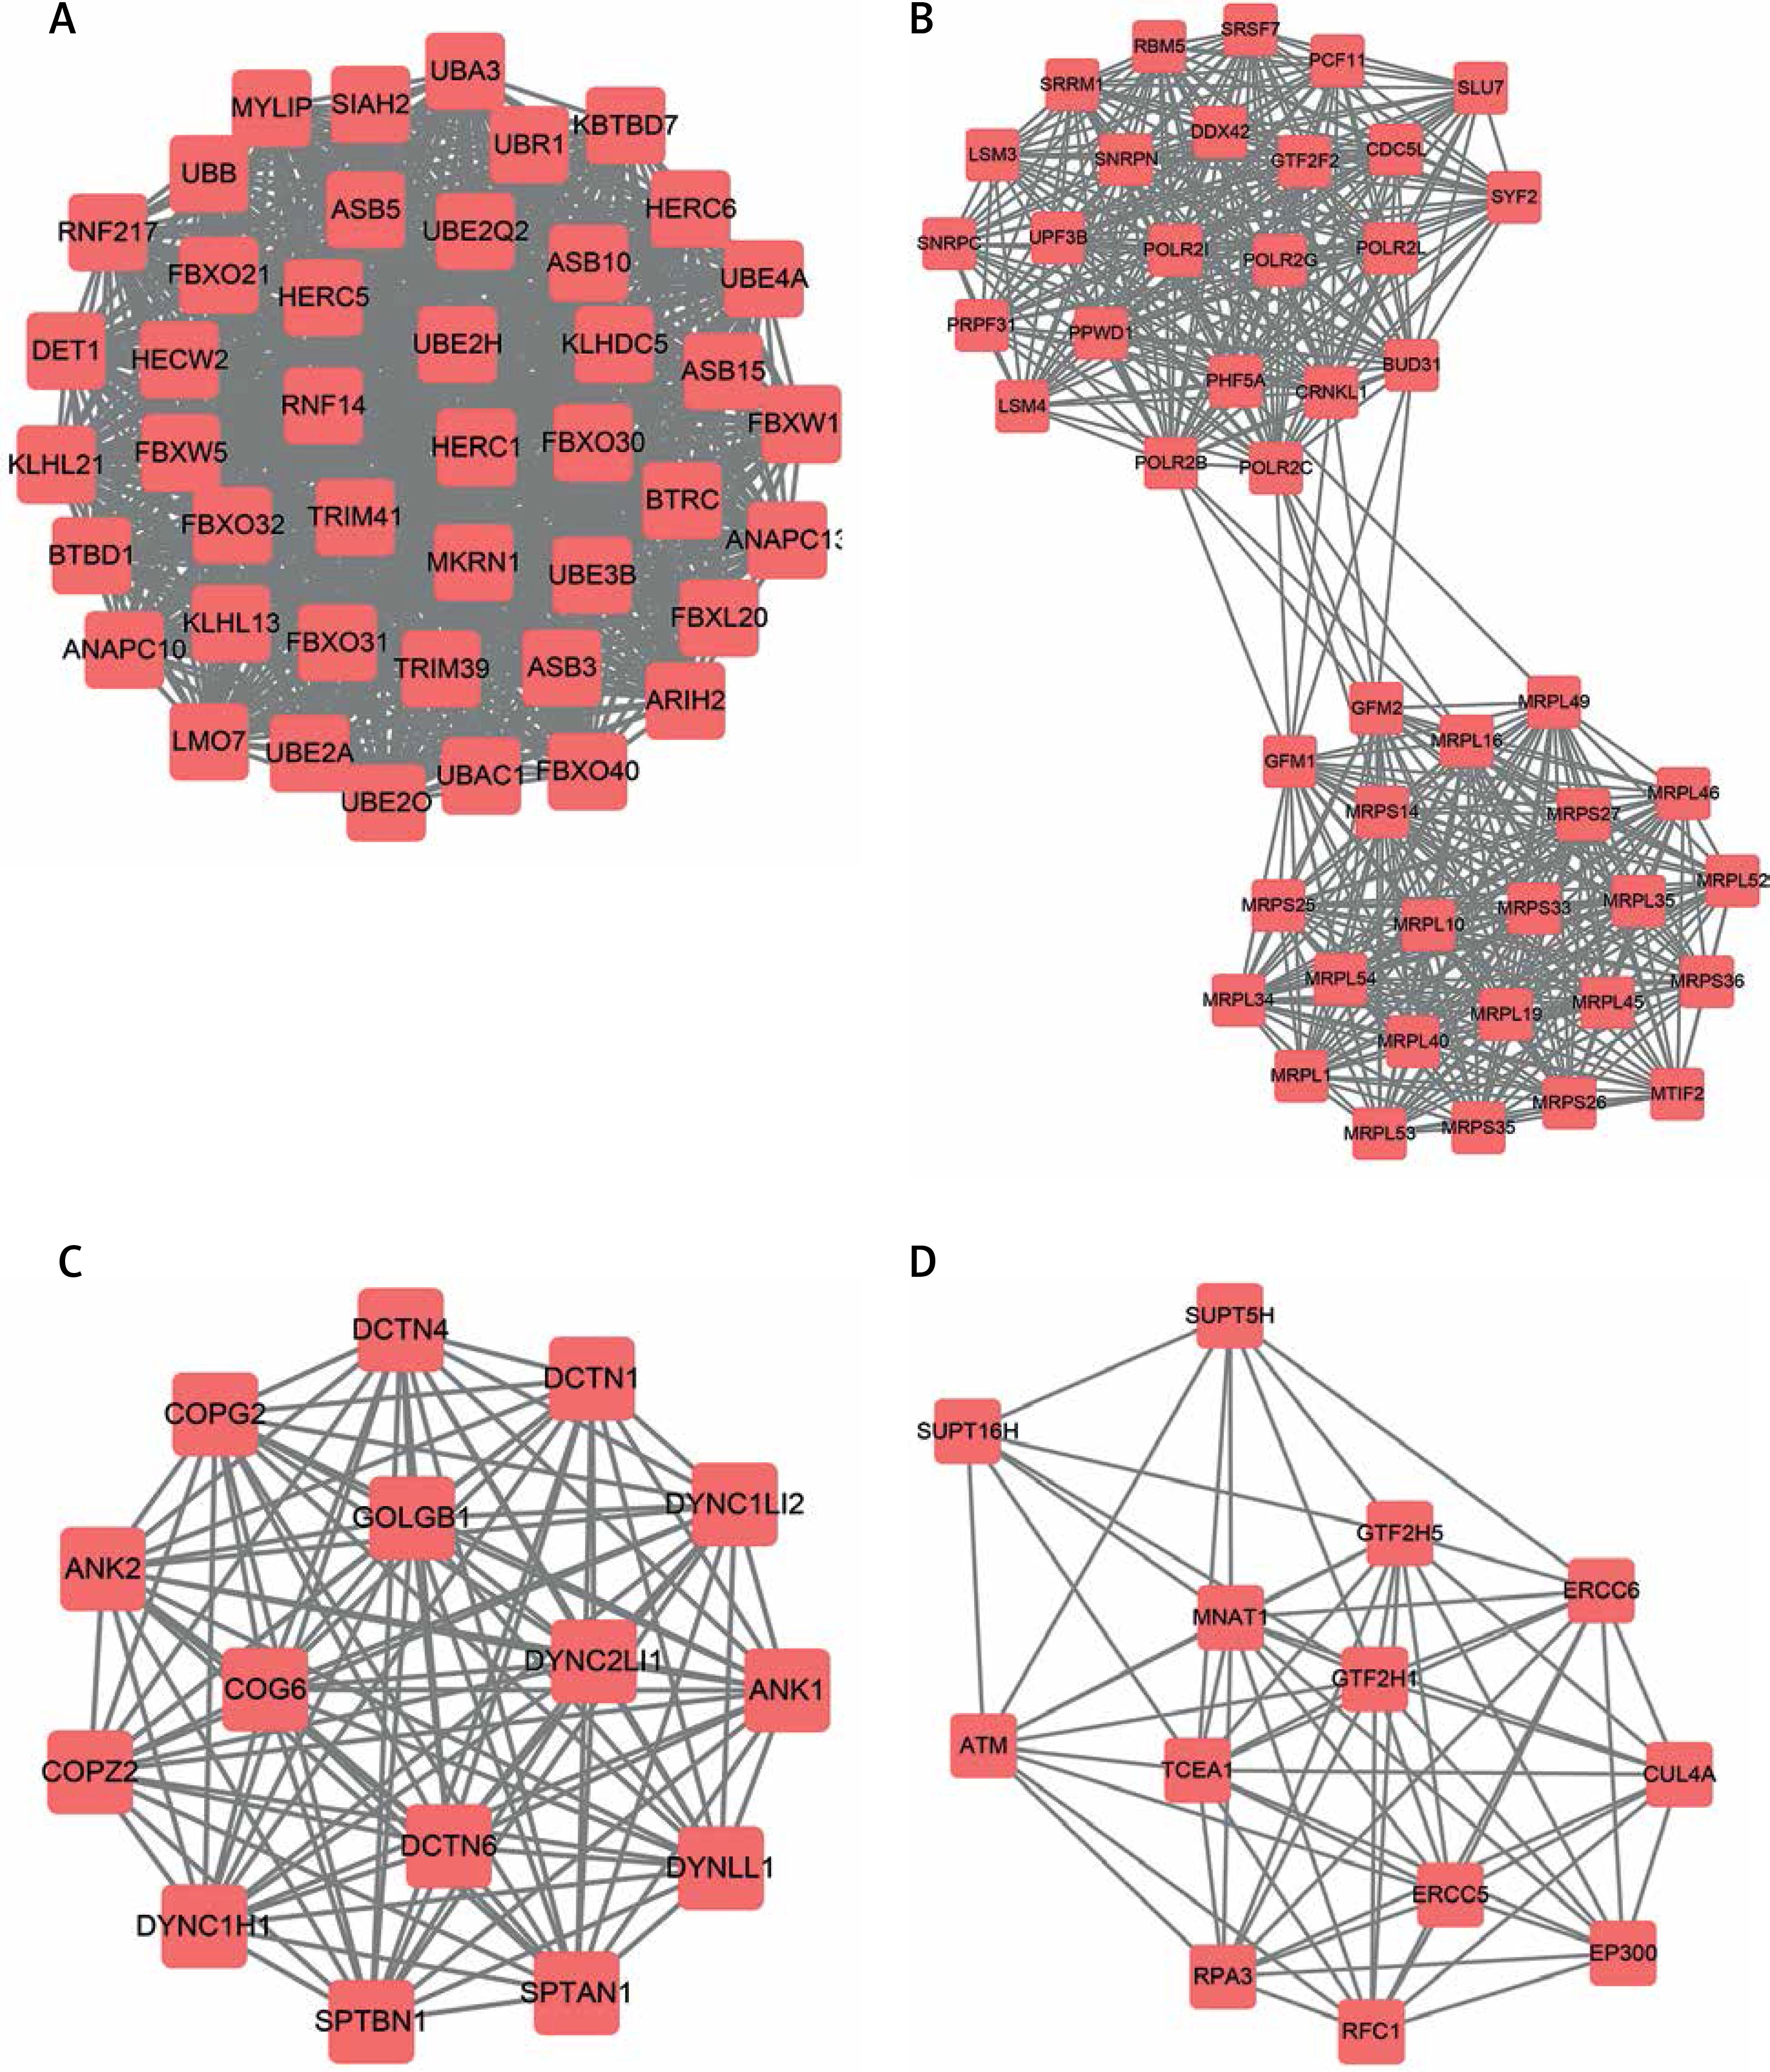
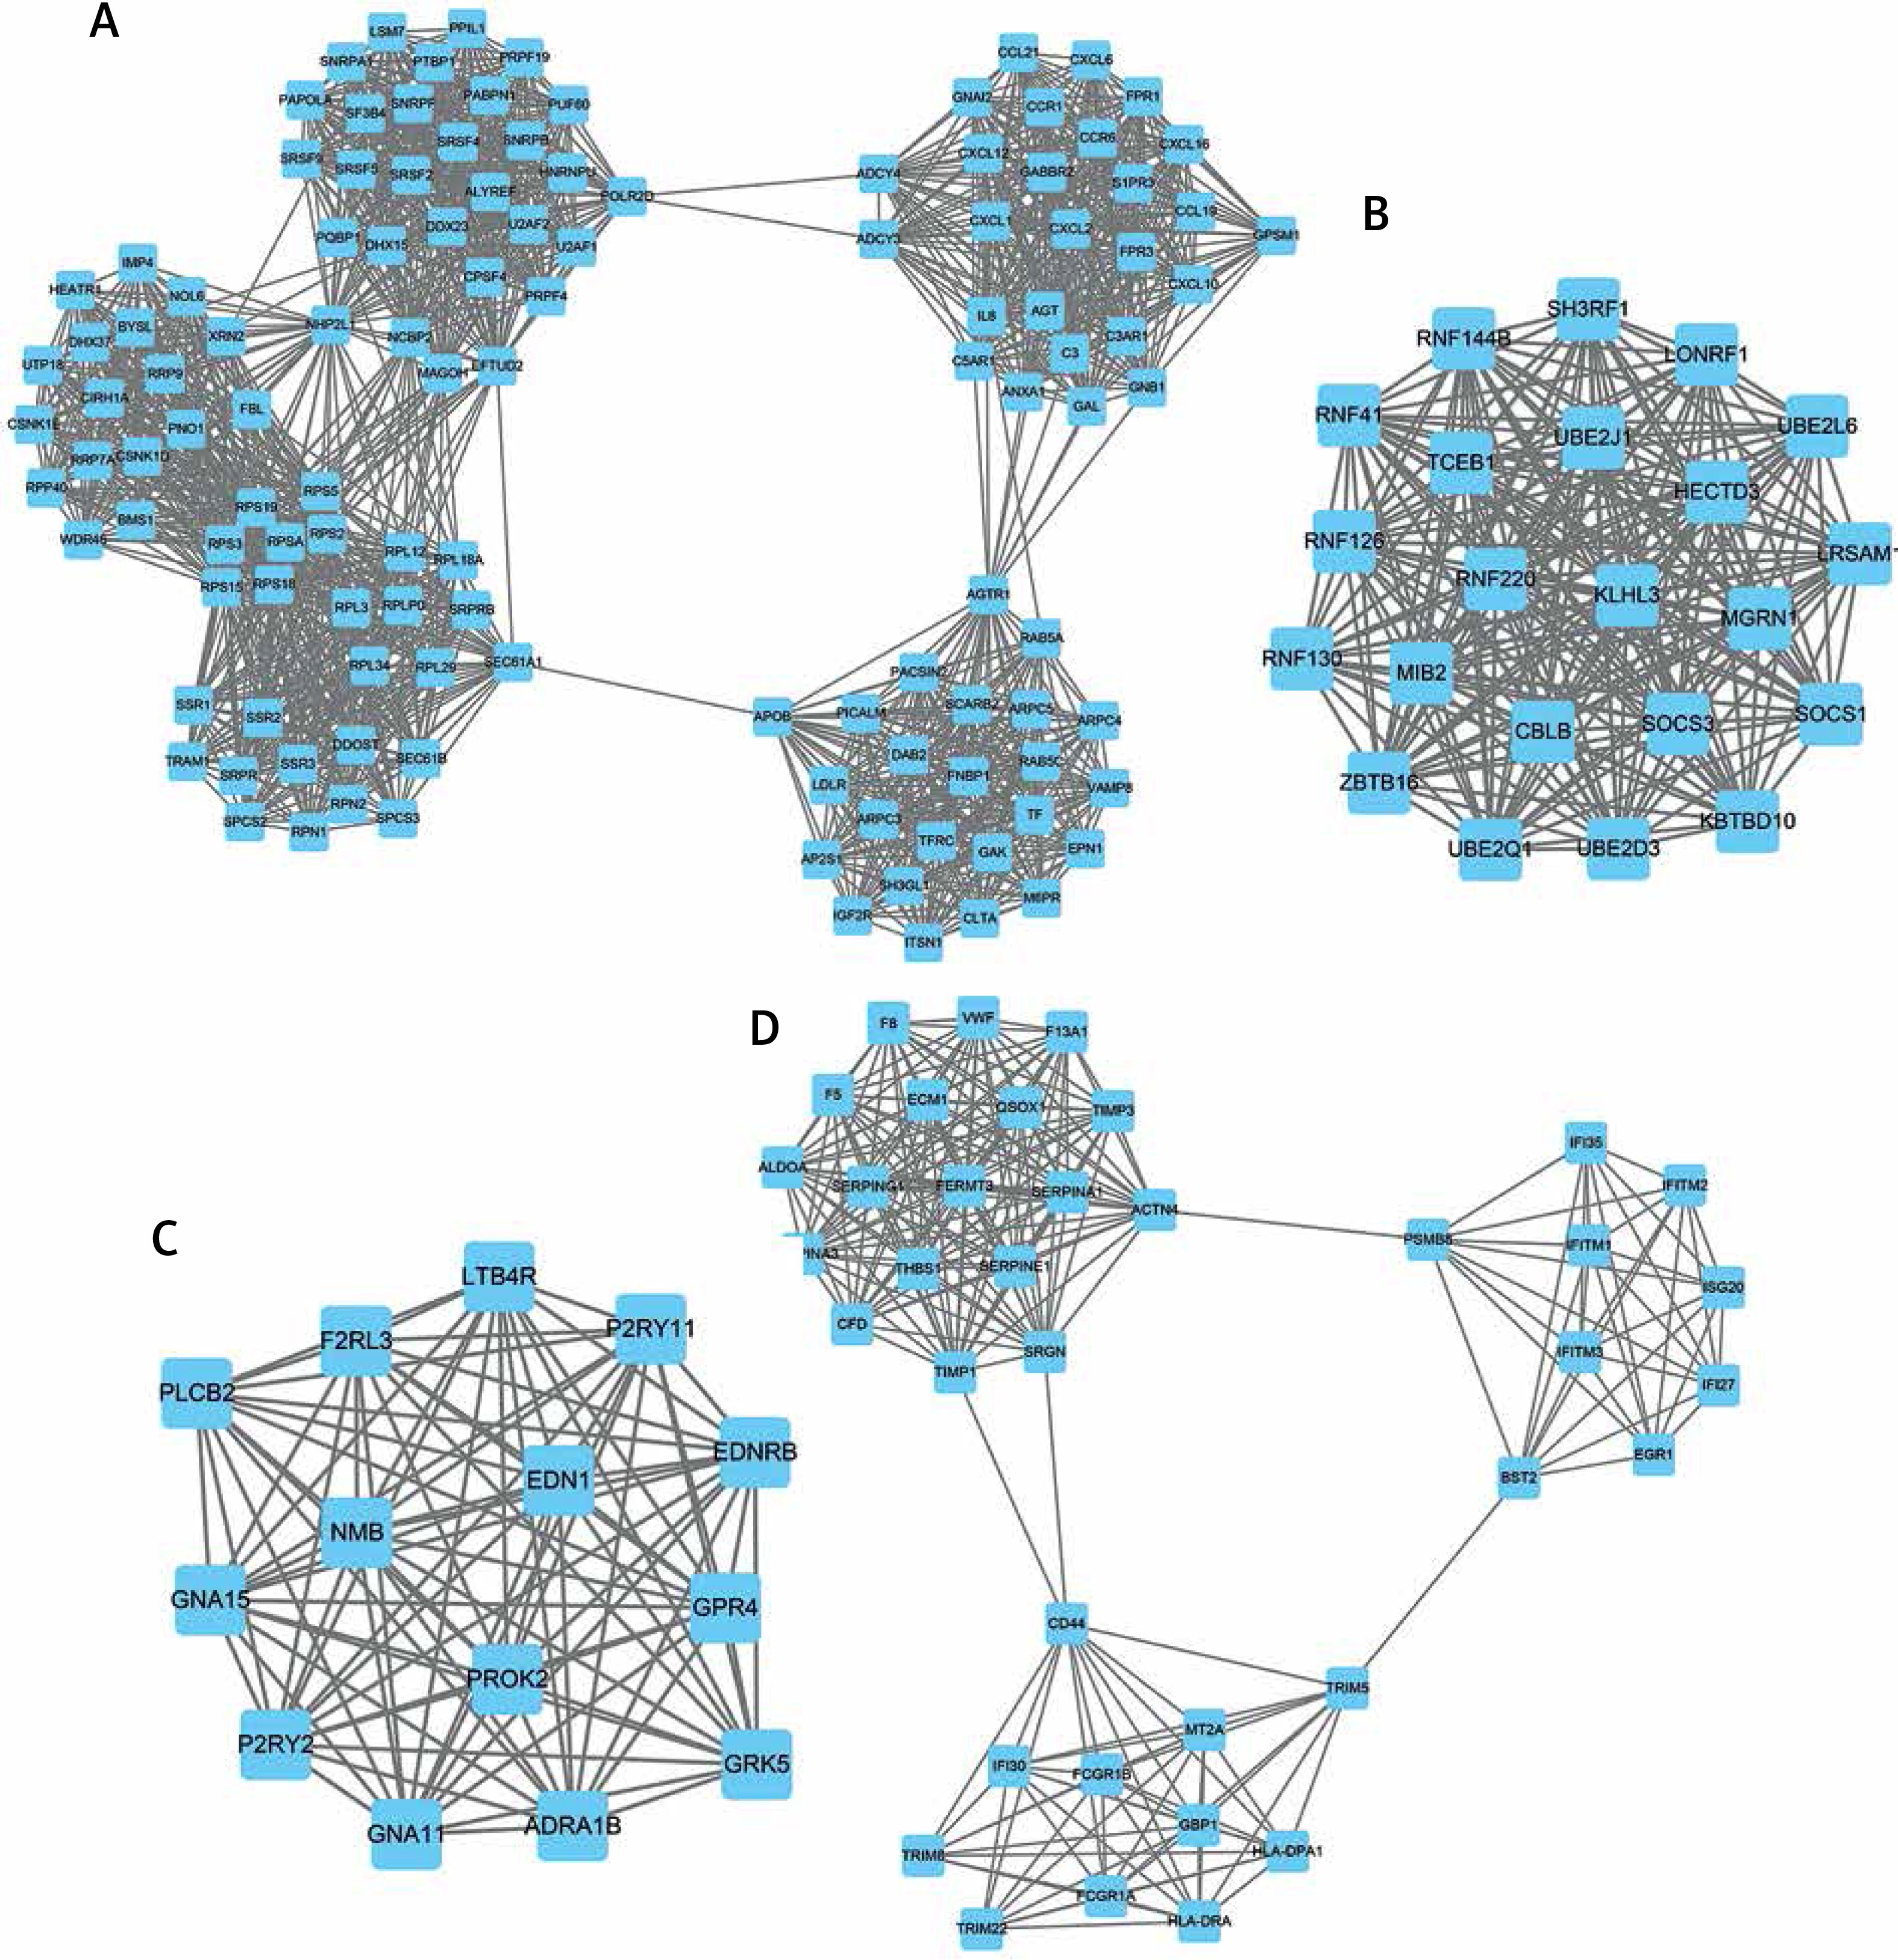
The top 4 hub-networks in up-regulated DEG-mediated PPI networks are shown in Figure 4. Hub-network 1 held 44 nodes and 946 edges (Figure 4 A), hub-network 2 contained 47 nodes and 552 edges (Figure 4 B), hub-network 3 had 15 nodes and 105 edges (Figure 4 C), and hub-network 4 had 13 nodes and 164 edges (Figure 4 D).
Figure 4
Hub-networks analysis of up-regulated DEGs in HCM. A – Hub-network 1 held 44 nodes and 946 edges. B – Hub-network 2 contained 47 nodes and 552 edges. C – Hub-network 3 had 15 nodes and 105 edges. D – Hub-network 4 had 13 nodes and 164 edges
The top 4 hub-networks in down-regulated DEG-mediated PPI networks are shown in Figure 5. Hub-network 1 held 122 nodes and 1664 edges (Figure 5 A), hub-network 2 contained 22 nodes and 231 edges (Figure 5 B), hub-network 3 had 14 nodes and 90 edges (Figure 5 C), and hub-network 4 had 38 nodes and 245 edges (Figure 5 D).
Co-expression network analysis of differentially expressed lncRNA in HCM
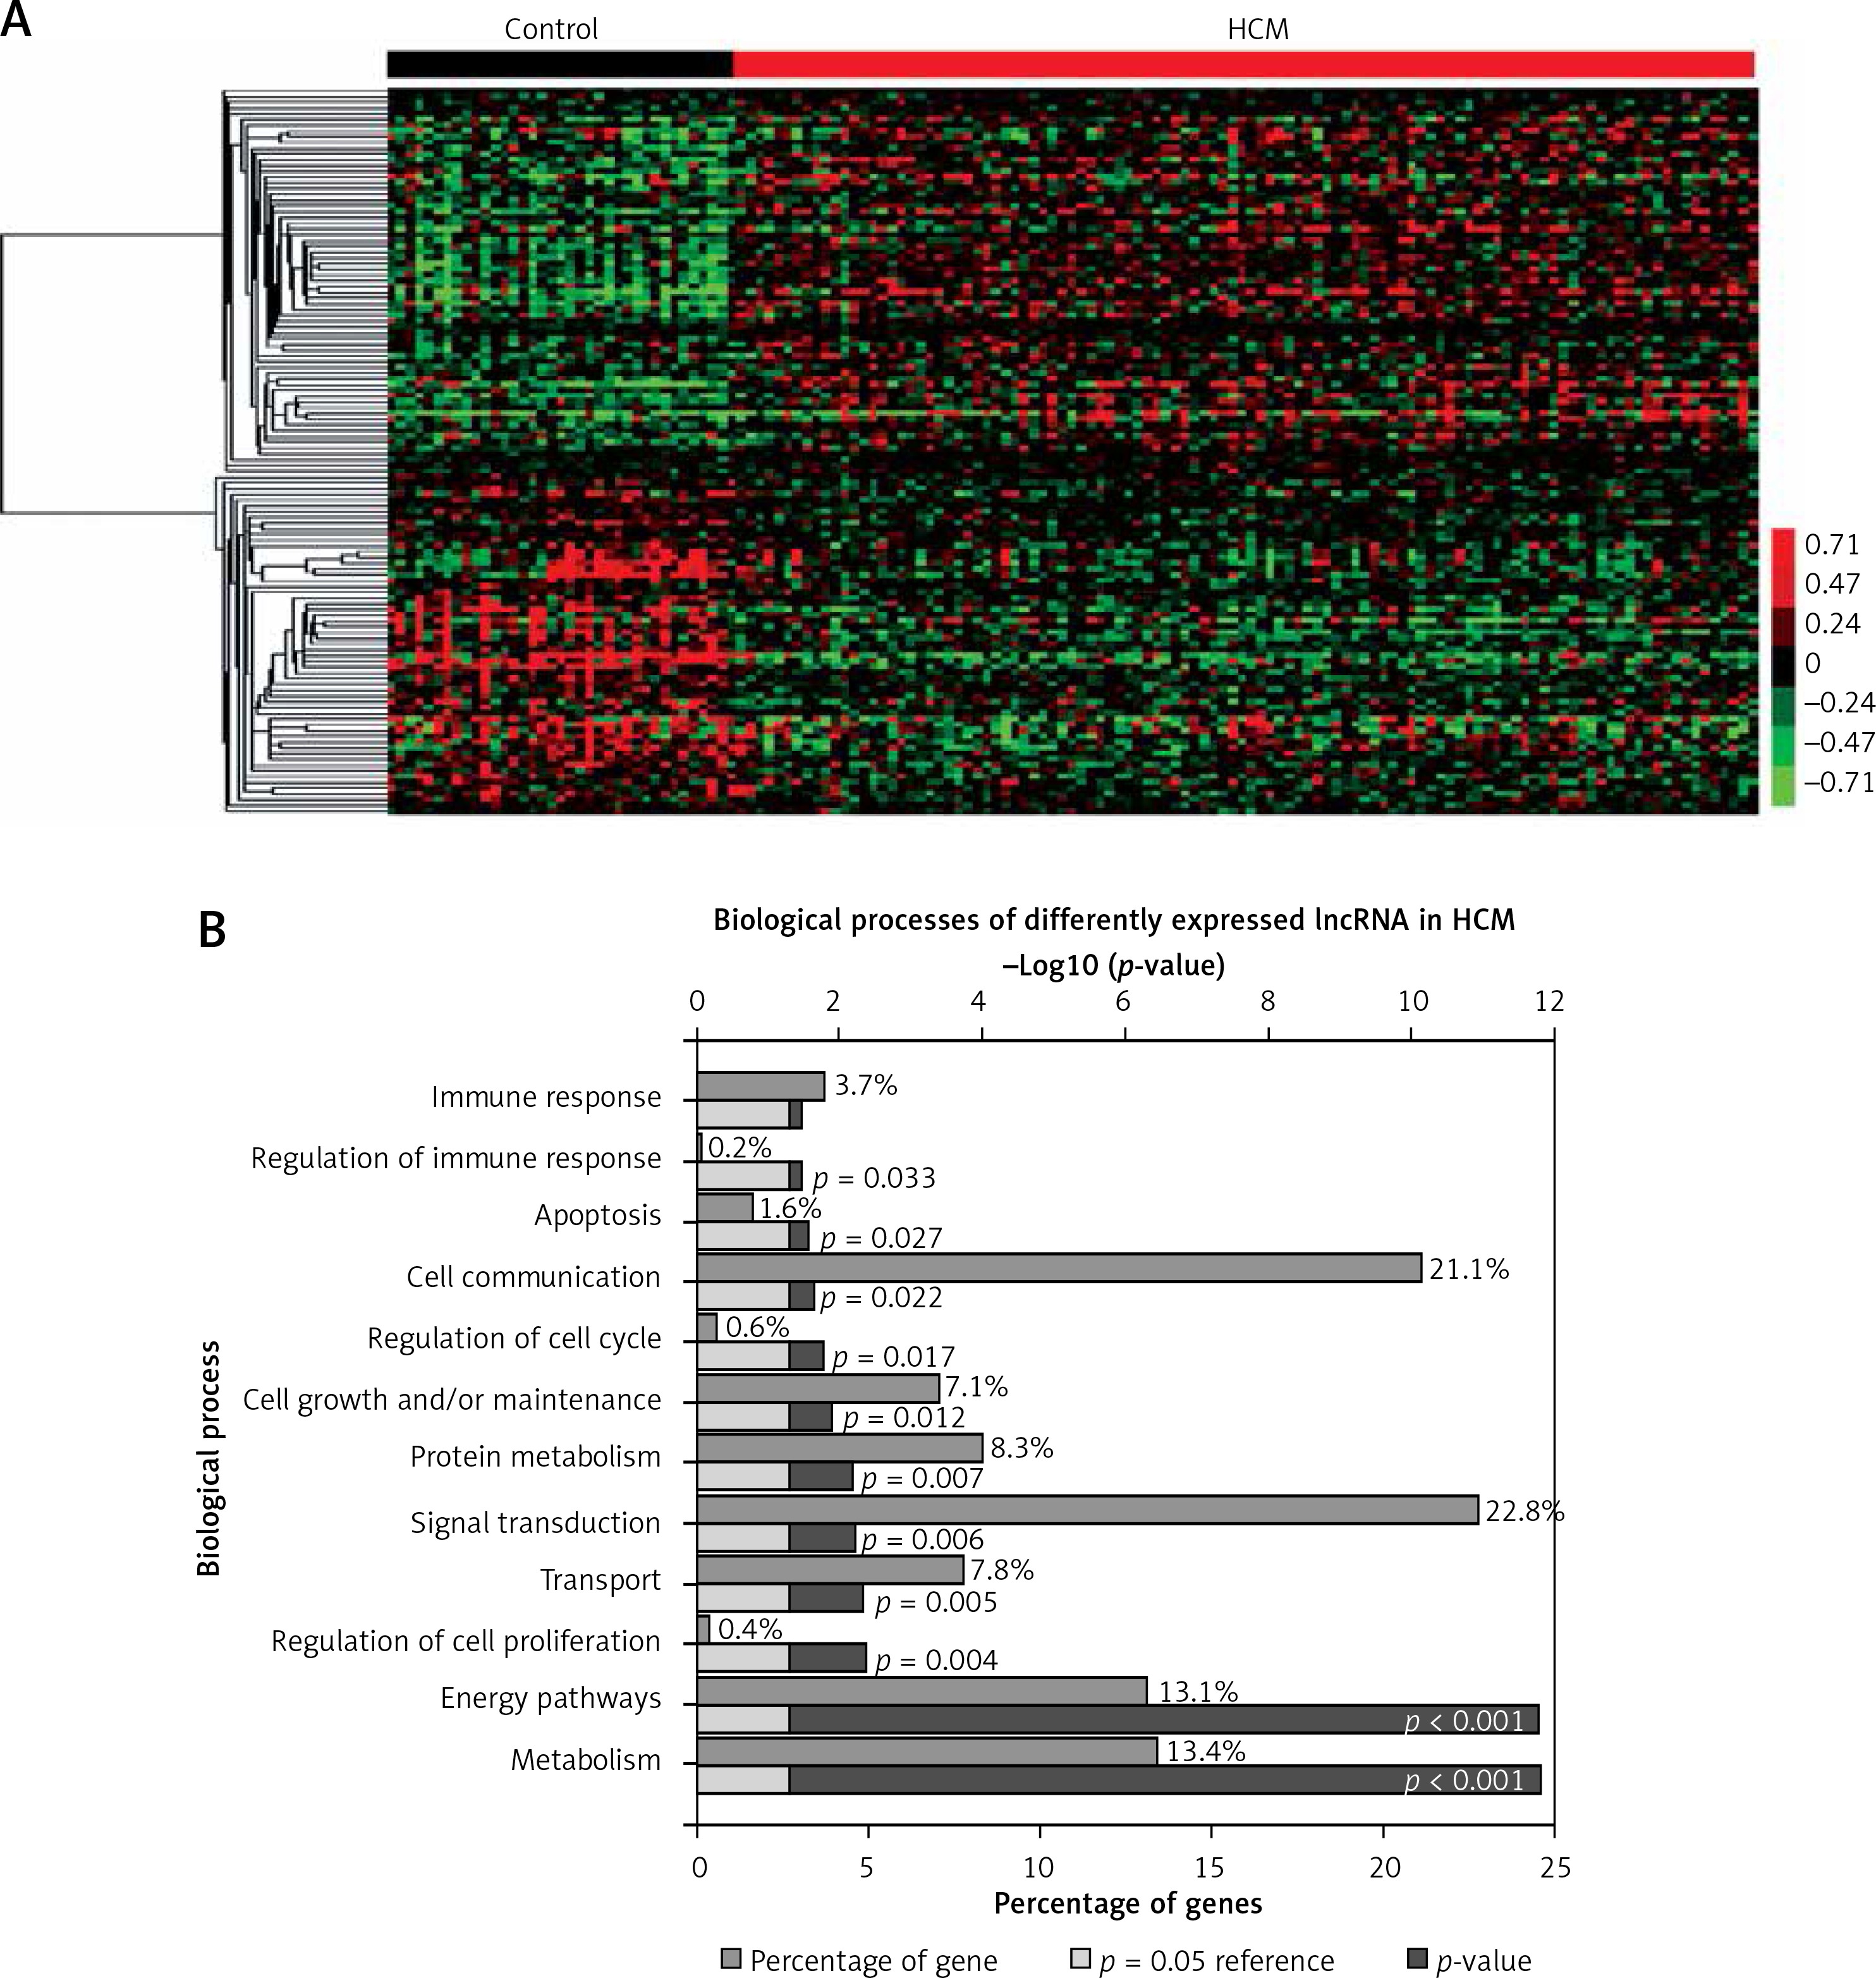
Of note, we observed a series of lncRNAs that were differentially expressed in HCM by applying the LncRNA classification pipeline. However, the function of most dysregulated lncRNAs in HCM remained unclear. A total of 1423 lncRNAs were identified in GSE36961. Of these lncRNAs, 67 lncRNAs were up-regulated and 59 lncRNAs were down-regulated in HCM compared to control samples with a p < 0.001 (Figure 6 A).
Figure 6
Identification of differentially expressed lncRNA in HCM. A – Hierarchical clustering analysis shows differential lncRNA expression in HCM by using GSE36961. Differential lncRNAs expression analysis shows 67 up-regulated lncRNAs and 59 down-regulated lncRNAs in HCM. B – GO analysis shows dysregulated lncRNA associated biological processes in HCM
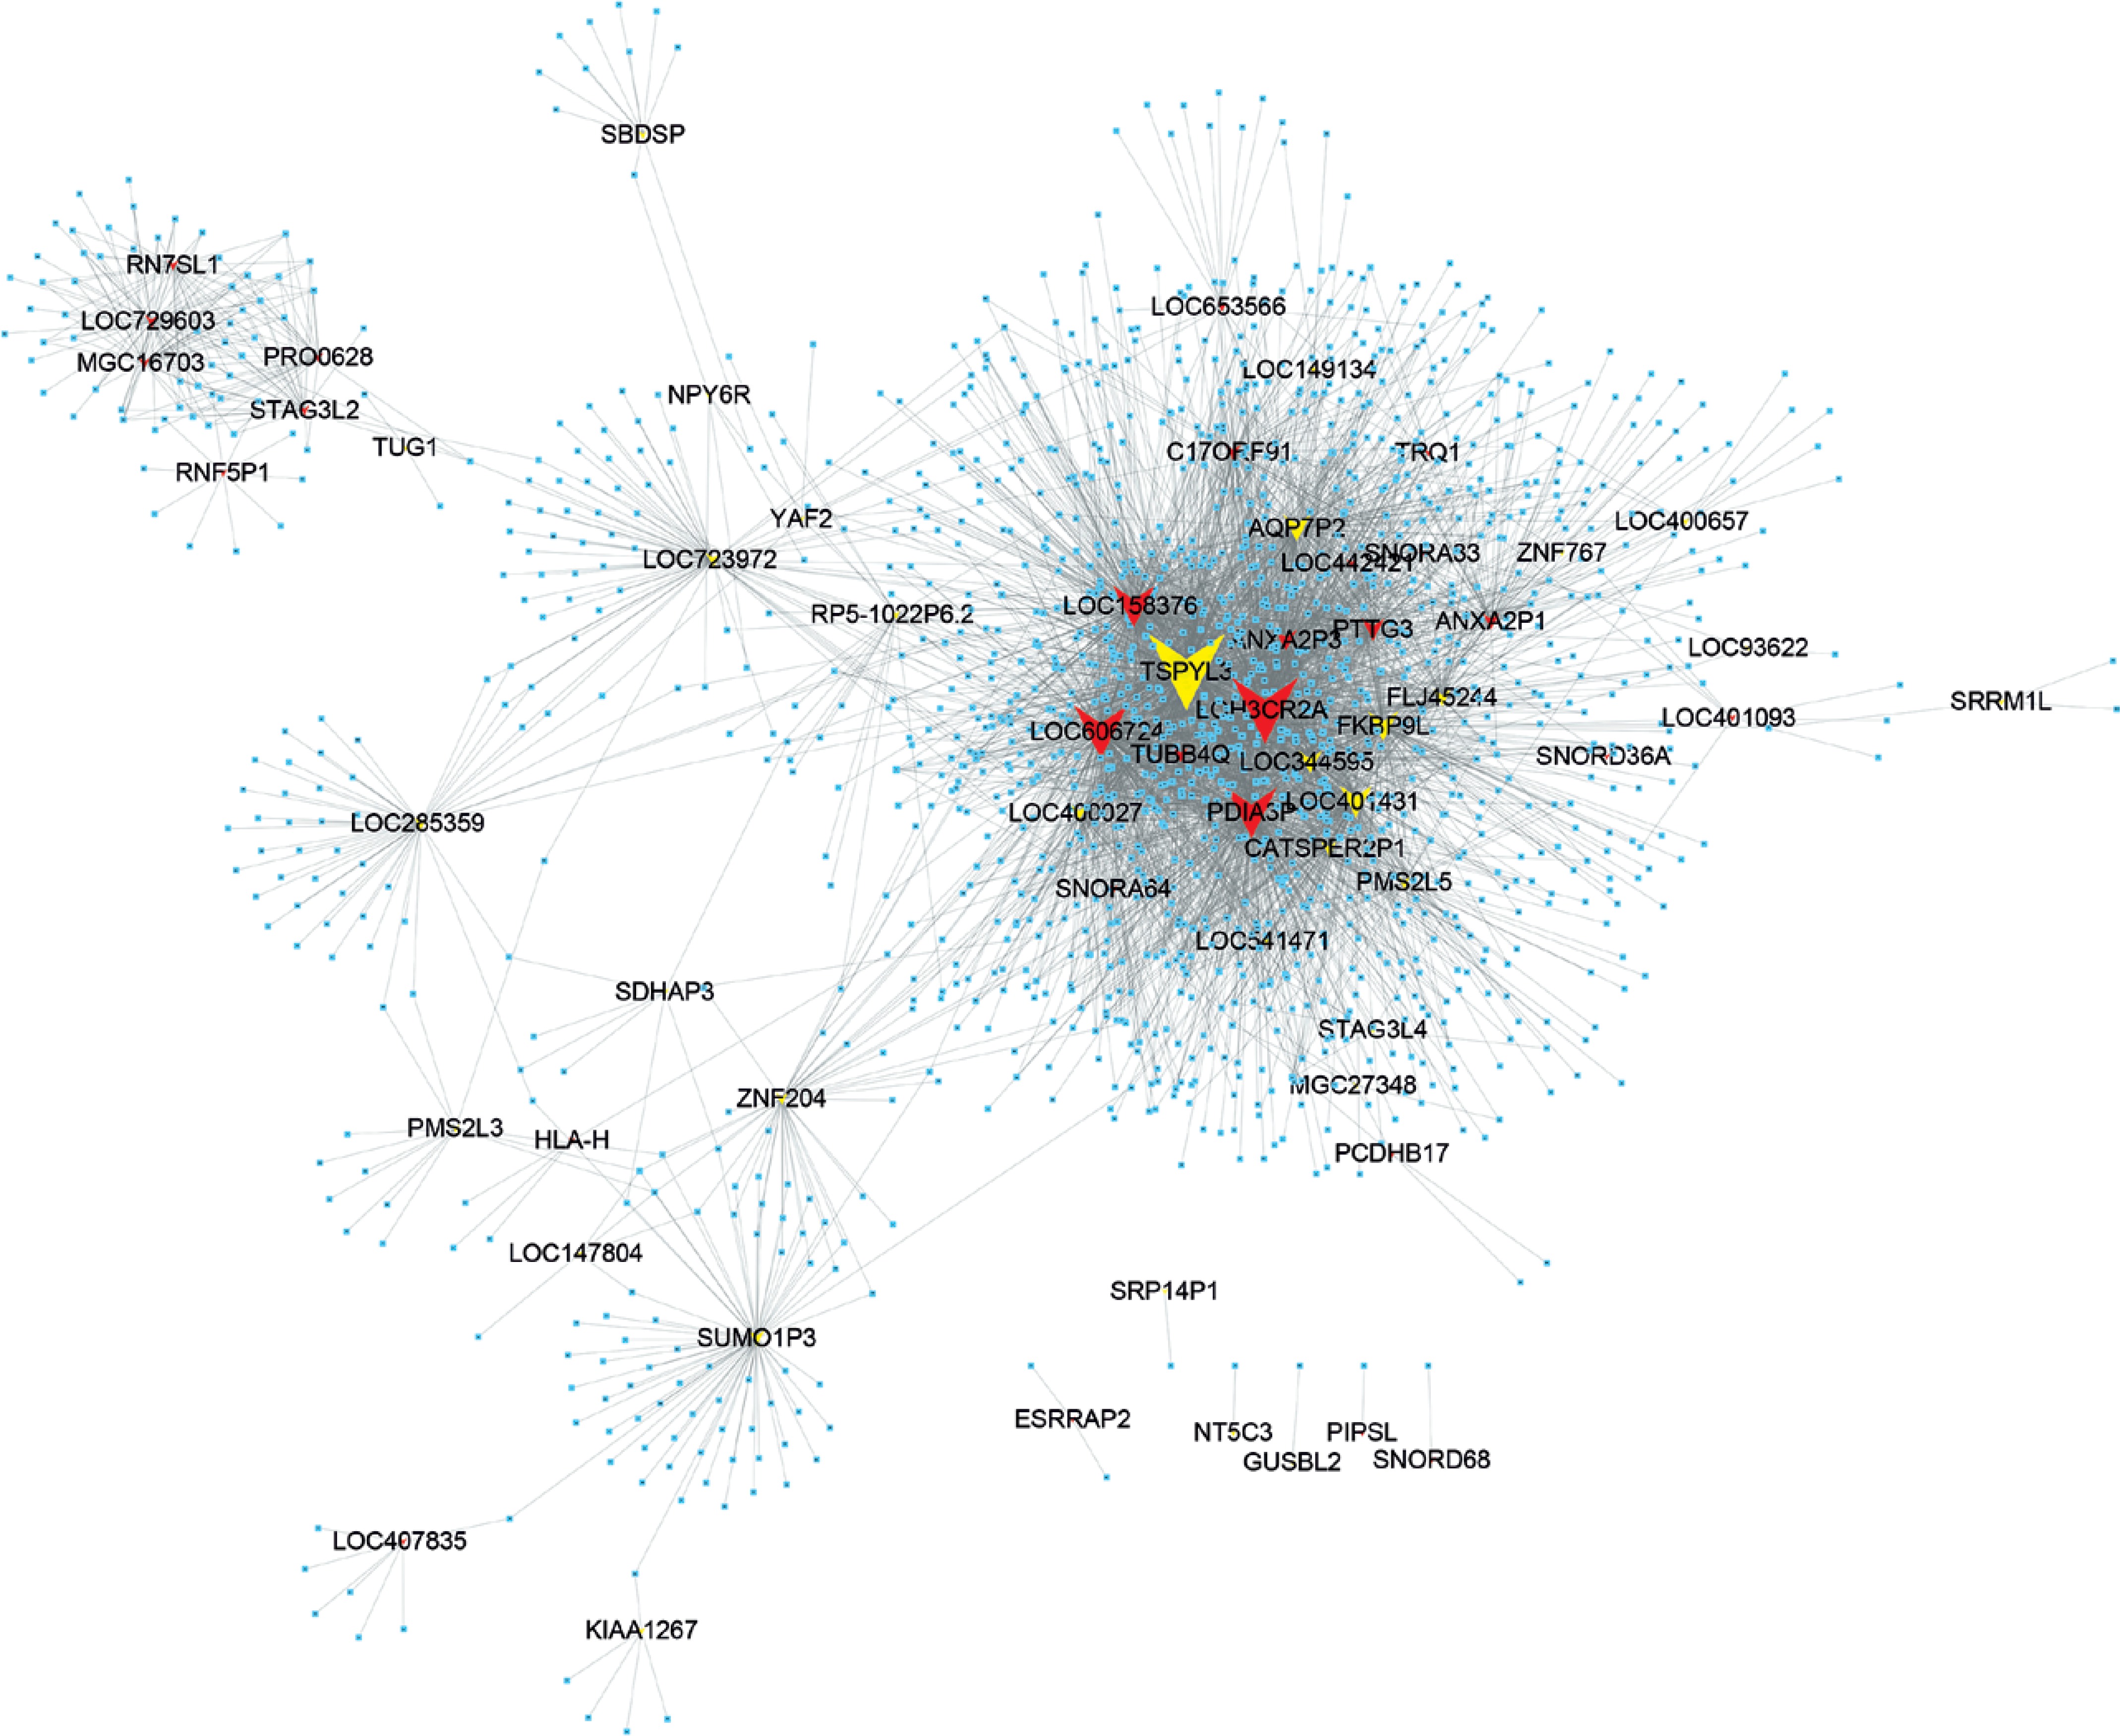
Then, we constructed a co-expression network of lncRNAs to reveal their potential roles in HCM. By calculating the Pearson correlation coefficient of lncRNA-DEG pairs, we then selected the co-expressed DEG-lncRNA pairs with the absolute value of Pearson’s correlation coefficient ≥ 0.60 for co-expression network construction. As shown in Figure 7, a total of 64 lncRNAs and 1892 DEGs were included in the dysregulated lncRNAs associated network.
Figure 7
Co-expression network analysis of differentially expressed lncRNA in HCM. Yellow nodes, up-regulated lncRNAs; red nodes, down-regulated lncRNAs. Co-expression network shows two up-regulated lncRNAs (TSPYL3 and LOC401431) and three down-regulated lncRNAs (LOC158376, LOC606724, PDIA3P and LOH3CR2A) in HCM
Furthermore, we performed bioinformatics analysis for differentially expressed lncRNAs. GO analysis showed that the dysregulated lncRNAs were mainly involved in regulating Metabolism, Energy pathways, Regulation of cell proliferation, Transport, Signal transduction, Protein metabolism, Cell growth and/or maintenance, Regulation of cell cycle, Cell communication, Apoptosis, Regulation of immune response, and Immune response (Figure 6 B).
Identification of key lncRNAs in HCM
In the co-expression network, we identified two up-regulated lncRNAs (TSPYL3 and LOC401431) and three down-regulated lncRNAs (LOC158376, LOC606724, PDIA3P and LOH3CR2A) as key lncRNAs in HCM. We found these lncRNAs co-expressed with more than 200 mRNAs. Of note, TSPYL3 showed the most important regulating roles by co-expressing with 576 proteins.
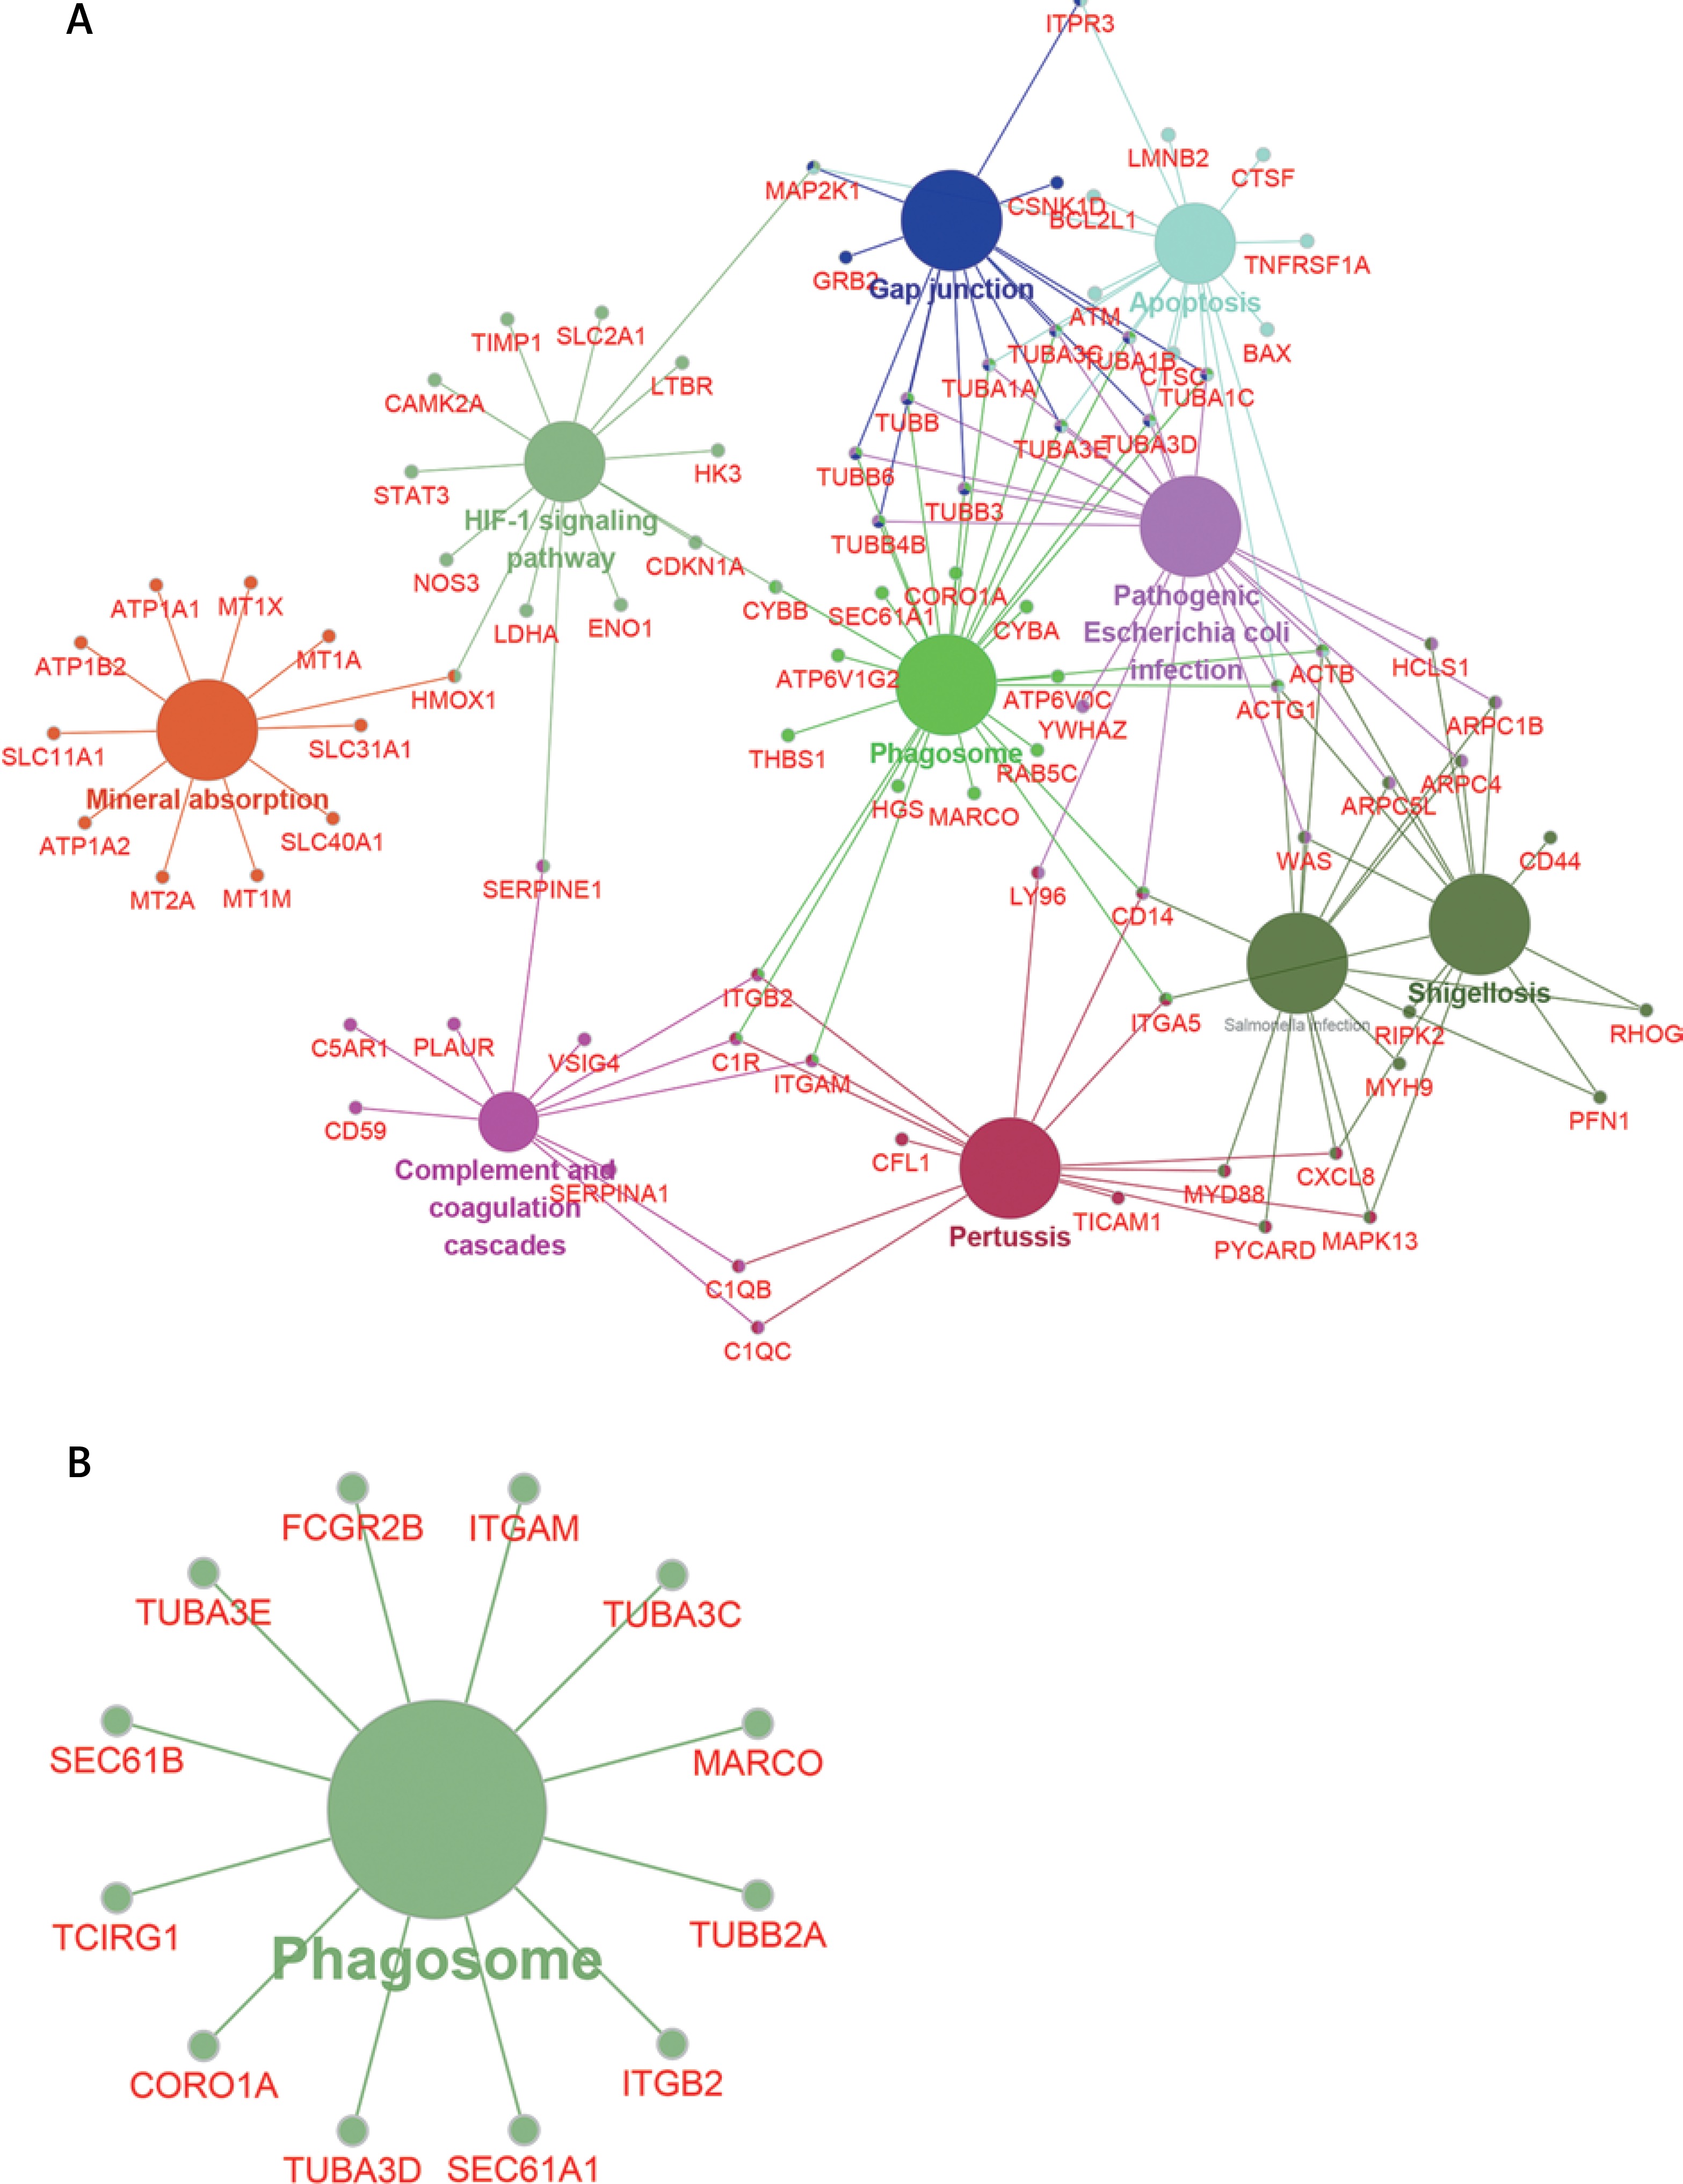
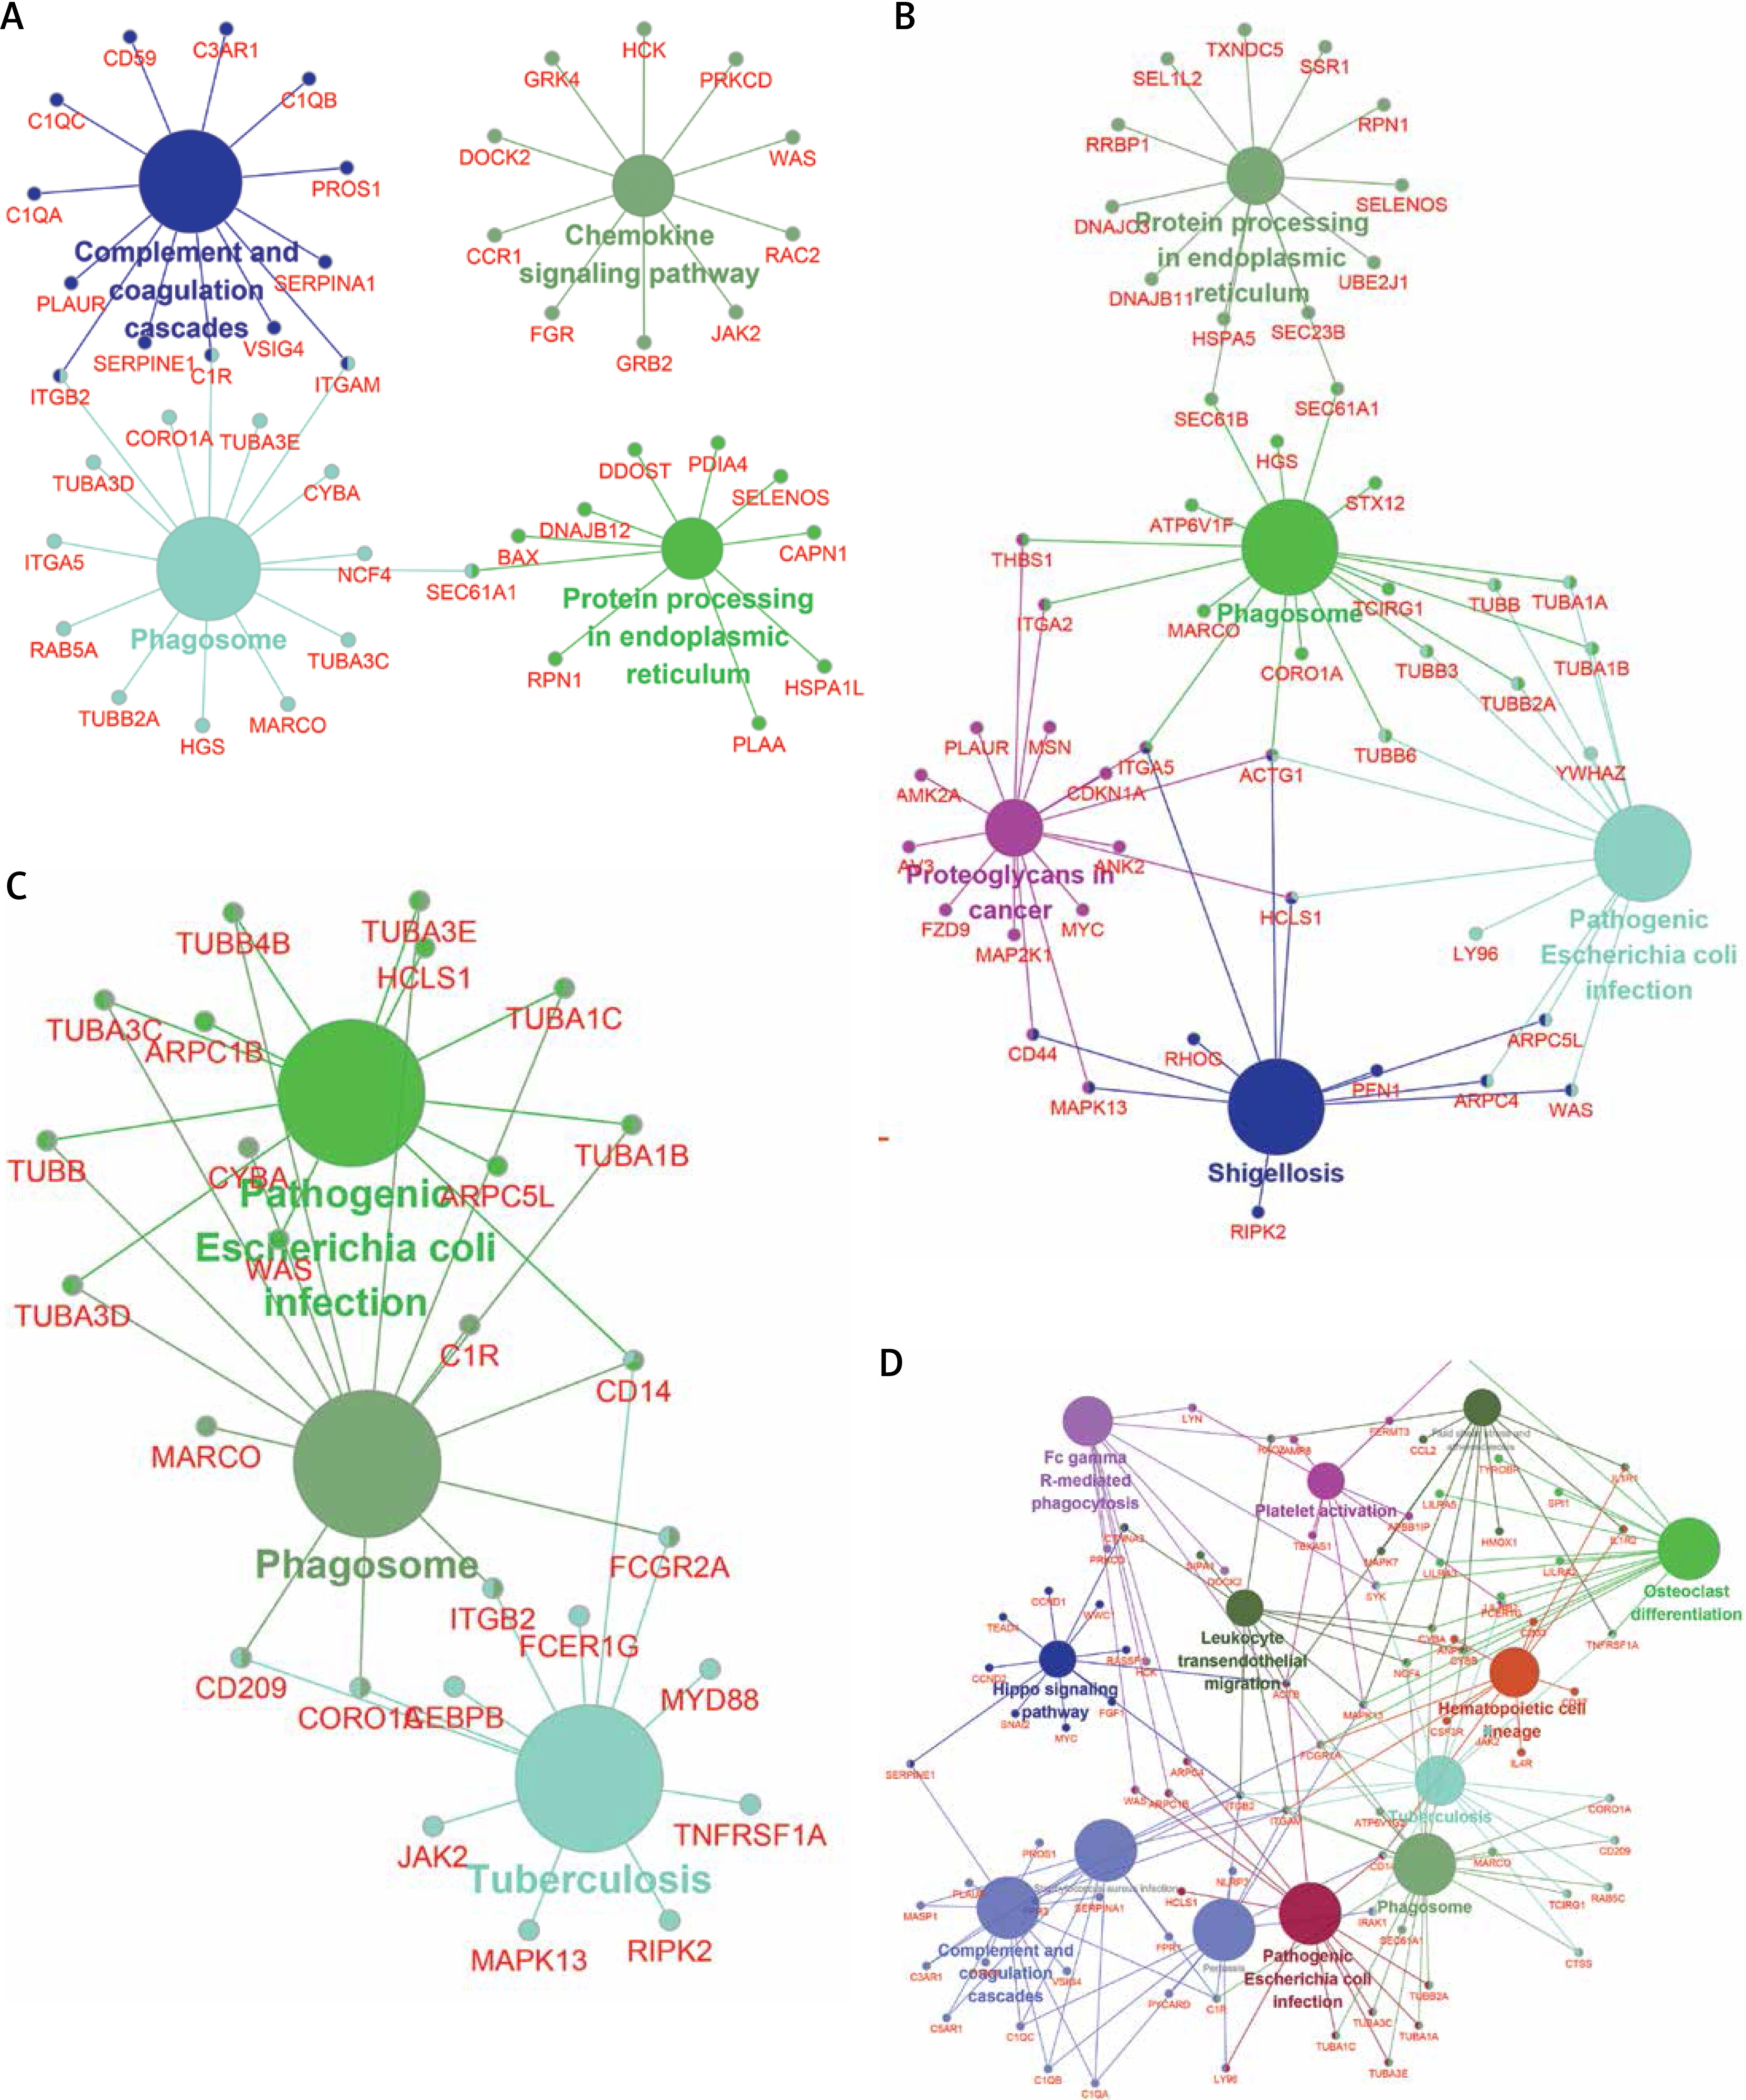
To further explore the key lncRNAs in regulating key biological processes in HCM, we constructed lncRNA mediated mRNA-KEGG pathway networks by applying ClueGO in Cytoscape software. We observed that TSPYL3 was associated with the HIF-1 signaling pathway, Complement and coagulation cascades, Gap junction, Apoptosis, Phagosome, and Mineral absorption (Figure 8 A). LOC401431 (Figure 8 B) and LOC158376 (Figure 9 D) were found to be involved in Phagosome regulation. PDIA3P was associated with Complement and coagulation cascades, Chemokine pathway, Phagosome and Protein processing in endoplasmic reticulum (Figure 9 A). LOH3CR2A was associated with Protein processing in endoplasmic reticulum, Phagosome, Shigellosis, Pathogenic Escherichia coli infection and Proteoglycans in cancer (Figure 9 B). LOC606724 was found to be involved in Hippo signaling pathway, Platelet activation, Osteoclast differentiation, Hematopoietic cell lineage and Leukocyte transendothelial migration (Figure 9 C).
Discussion
Hypertrophic cardiomyopathy, a genetically heterogeneous disorder of cardiac myocytes, has been one of the main reasons for sudden cardiac death of young people [20, 21]. However, the mechanism underlying HCM progression remained unclear. In the present study, we screened differentially expressed proteins and lncRNAs in HCM by analyzing a public dataset (GSE36961). A total of 3127 mRNAs were up-regulated and 3021 mRNAs were down-regulated in HCM. Meanwhile, we also identified 67 up-regulated lncRNAs and 59 down-regulated lncRNAs in HCM compared to control samples. Additionally, protein-protein interaction network analysis was performed to reveal the potential function of DEGs in HCM. Furthermore, we performed co-expression analysis to reveal the potential roles of differentially expressed lncRNAs.
Previous studies revealed that several genes and pathways were associated with HCM progression. For example, sarcomeric genes (such as MYH7, MYBPC3, TPM1, TNNT2 and TNNI3) are mutated in approximately 40% of HCM patients [22]. Meanwhile, gene mutation of several pathways, including the RAS signaling pathway, and hypoxia-inducible factor pathway, were also observed in HCM [23]. However, there was still an urgent need to identify novel regulators to elucidate the molecular mechanisms for HCM. Here, we identified 6158 DEGs in HCM. GO analysis showed that the up-regulated DEGs were mainly involved in regulating Regulation of nucleobase metabolism, Metabolism, Energy pathways, Muscle contraction, Cell growth and/or maintenance, and Protein metabolism. Meanwhile, the down-regulated DEGs were associated with Signal transduction, Cell communication, Immune response, Metabolism, Energy pathways, and Transport. Here, we also constructed HCM associated PPI networks. Several proteins (including down-regulated IL-6, JUN, ACTB, MAPK3, and MYC and up-regulated UBB, POLR2C, POLR2L, POLR2B, and POLR2G) were found to play more important roles in HCM and interacted with more than 50 proteins. Of note, by screening publications, several genes, such as MYC, have been reported to be involved in HCM progression. For example, emerging studies have shown that inhibition of MYC was becoming an attractive paradigm for prevention and treatment of cardiomyopathy and heart failure [24, 25].
LncRNA, a class of non-coding RNA molecules with more than 200 bases, plays important regulatory roles in the transcription, post-transcription and translation regulation of protein-coding genes [7]. Previous studies have revealed that lncRNAs also regulate cardiomyopathy progression. For example, down-regulation of lncRNA KCNQ1OT1 protects against myocardial ischemia/reperfusion injury following acute myocardial infarction [26]. Zhang et al. also reported that the long non-coding RNA H19 promotes cardiomyocyte apoptosis in dilated cardiomyopathy [27]. In the present study, we found that 67 lncRNAs were up-regulated and 59 lncRNAs were down-regulated in HCM. Bioinformatics analysis showed that the dysregulated lncRNAs were mainly involved in regulating Metabolism, Energy pathways, and Regulation of cell proliferation.
Although Kitow et al. and Yang et al. found that lncRNAs could serve as biomarkers for HCM patients, the molecular function of lncRNAs in HCM remained largely unclear. In a co-expression network, we identified TSPYL3, LOC401431, LOC158376, LOC606724, PDIA3P and LOH3CR2A as key lncRNAs in HCM, which co-expressed with more than 200 mRNAs. Of note, TSPYL3 showed the most important regulatory roles by co-expressing with 576 proteins. Furthermore, we constructed lncRNA mediated mRNA-KEGG pathway networks by applying ClueGO in Cytoscape software. We observed that TSPYL3 was associated with HIF-1 signaling pathway, Gap junction, Apoptosis, Phagosome, and Mineral absorption. LOC401431 and LOC158376 were found to be involved in Phagosome regulation. PDIA3P was associated with Complement and coagulation cascades, Chemokine pathway, Phagosome and Protein processing in endoplasmic reticulum. LOH3CR2A was associated with Protein processing in endoplasmic reticulum, Phagosome, Shigellosis, and Proteoglycans in cancer. LOC606724 was found to be involved in Hippo signaling pathway, Platelet activation, Osteoclast differentiation, Hematopoietic cell lineage and Leukocyte transendothelial migration. LOC158376 was found to be involved in Phagosome and Tuberculosis. To the best of our knowledge, this is the first study to reveal the potential roles of these lncRNAs in HCM.
The main objective of this study was to provide information on gene expression which could be relevant for diagnosing HCM in some patients. However, several limitations of this study should be noted. First, we could not provide more detailed information to predict whether the results reported in this paper are homogenously or heterogeneously prevalent in the wide range of HCM cases, or whether our results were sensitive and specific in differentiating HCM from normal, because we did not get enough datasets to support these assumptions. Second, further studies are needed to confirm the expression levels of these key genes and lncRNAs in HCM patients. Last, the molecular functions of these key genes and lncRNAs should be further validated in HCM by using loss/gain of function assays.
In conclusion, we analyzed the public dataset GSE36961 to identify differentially expressed lncRNAs and mRNAs in HCM. A total of 6147 mRNAs and 126 lncRNAs were found to be dysregulated in HCM. PPI network and GO analysis showed that these DEGs were associated with metabolism, energy pathways, signal transduction, and cell communication. LncRNA co-expression analysis showed that lncRNAs were also involved in regulating metabolism, energy pathways, and regulation of cell proliferation. Moreover, TSPYL3, LOC401431, LOC158376, LOC606724, PDIA3P and LOH3CR2A were identified as key lncRNAs in HCM. We believe this study will provide information to explore novel molecular target therapy for HCM.