Introduction
Diabetes mellitus (DM), which is characterized by hyperglycemia [1], has been reported to adversely affect the male reproductive organs [2]. In men, DM can cause impairment to Leydig and Sertoli cell functions, which could result in infertility [3]. An inverse relationship has been observed between blood glucose level and sperm quality in humans and animals [4]. Semen analyses in diabetic men revealed decreased sperm motility [5] and sperm concentration [6] and increased abnormal sperm morphology including sperm with defective acrosome, nucleus, and mitochondria [5]. The DM is reported to be linked to oxidative stress [7], a state in which genes related to intracellular signaling, DNA integrity, structure and motility of the sperm are altered [8]. Oxidative stress can also cause sperm damage due to high levels of reactive oxygen species (ROS) [9]. In diabetes, levels of ROS can exceed antioxidant capacity of the seminal plasma [10]. Besides causing an increase in oxidative stress, hyperglycemia can also induce inflammation [11] and apoptosis [12]. High levels of inflammation have been reported in the sperm of diabetics [13].
Quercetin (3,3′,4′,5,7 pentahydroxy flavone), a bioflavonoid [14], contains a phenolic ring and is capable of halting oxidation via acting as a free radical scavenger [15]. This compound has been found to possess anti-inflammatory, anti-pathogenic, antioxidant and immune-modulatory activities [16]. Quercetin has been reported to be able to prevent lipid peroxidation (LPO)-induced testicular injuries in a diabetic rat model [17]. Its ability to protect the sperm against damage in diabetes is however unknown. In this study, effects of quercetin on sperm oxidative stress and inflammation in diabetes were investigated. Additionally, effects of this compound on sperm functions and morphology in diabetes were also unraveled.
Material and methods
Animals
Eight-week-old male Sprague-Dawley (SD) rats, weighing 225 ±25 g were housed under a 12/12 h light/dark cycle, temperature 24 ±2°C, 60–80% humidity and fed with rat diet (Harlan Teklad Global Diet, Harlan, Germany) and tap water ad libitum. All experimental procedures were approved by the Animal Care and Use Committee (ACUC), University of Malaya.
DM induction and fasting blood glucose (FBG) determination
The DM was induced in overnight fasting rats via a single intraperitoneal (i.p.) injection of nicotinamide (110 mg/kg/body weight) dissolved in normal saline, 15 min prior to streptozotocin (STZ) (55 mg/kg/body weight) injection, where the latter was dissolved in citrate buffer [18]. Control rats received citrate buffer only. Streptozotocin was used to destroy the pancreatic β-cells while nicotinamide limits the damage to β-cells, creating a state of partial insulin deficiency [19]. Three days after STZ-nicotinamide injection, DM was confirmed by the FBG level exceeding 150 mg/dl by using the Accu-Chek active glucometer (Accu-Chek, Roche Diagnostic, Meylan, France). Quercetin doses were chosen at 10, 25 and 50 mg/kg/day, following the doses previously used in other studies [14, 20]. Quercetin was dissolved in distilled water and was given orally four days after DM confirmation for 28 consecutive days.
Experimental designs
A total of 48 rats were used in this study and were divided into eight groups with n = 6 per group:
group 1 – normal control (NC),
group 2 – normal control treated with 10 mg/kg/b.w. quercetin (NC + Q10),
group 3 – normal control treated with 25 mg/kg/b.w. quercetin (NC + Q25),
group 4 – normal control treated with 50 mg/kg/b.w. quercetin (NC + Q50),
group 5 – diabetic control (DC),
group 6 – diabetic rats treated with 10 mg/kg/b.w. quercetin (DC + Q10),
group 7 – diabetic rats treated with 25 mg/kg/b.w. quercetin (DC + Q25),
group 8 – diabetic rats treated with 50 mg/kg/b.w. quercetin (DC + Q50).
Sperm harvesting and basic sperm parameter analysis
At the end of the treatment, rats were sacrificed by cervical dislocation. Rats were fasted overnight so levels of blood glucose between rats were presumed to be approximately the same, therefore allowing changes in the parameters observed to be compared. The cauda epididymis was dissected out and placed in 500–1000 µl of pre-warmed phosphate buffered saline (PBS) (Dulbecco A, UK) at 37°C, 5% carbon dioxide (CO2). Epididymis was gently squeezed to allow sperm to move out immediately after it was placed into the pre-warmed solution. Sperm suspension was used for the basic sperm parameter analysis.
Basic sperm parameter analyses
Sperm motility
A drop of sperm suspension was placed onto a microscope slide and was covered with a cover slip, and sperm motility was evaluated in 10 microscopic fields at 200× magnification using a phase contrast microscope, following the method of Belsey [21]. First, the non-motile sperm were counted followed by the motile sperm.
Sperm count
The sperm from the cauda epididymis were counted according to the method of Belsey [1, 22]. Briefly, 10 µl of diluted sperm sample was added into a Neubauer chamber of hemocytometer (Deep 1/10 mm, LAMBART, Darmstadt, Germany). The number of sperm in appropriate squares of the hemocytometer was counted under a light microscope. Sperm count was obtained following this equation:
Sperm viability
The ratio of live to dead sperm was determined using 1% trypan blue following the method of Talbot and Chacon [22]. A total of 300 sperm were counted per rat and the results were expressed as the percentage of live sperm.
Hypo-osmotic swelling test (HOS-T)
Integrity of sperm flagella membrane was assessed by hypo-osmotic swelling test (HOS-T), following the method of Jeyendran et al. [23].
Sperm morphology
The total percentage of sperm with head abnormalities, i.e. detached head, defects in head size and shape, nuclear vacuoles, acrosomal defects etc; mid-piece abnormalities, i.e. distal mid-piece reflex, bowed mid-piece, proximal droplet, etc, and tail abnormalities, i.e. bent tail, coiled tail, etc, were viewed under a light microscope (Nikon, H600L, Tokyo, Japan) at 400× magnification. The results were expressed as the percentages of sperm with abnormal morphology out of the total sperm count.
Sperm chromatin structure assay (SCSA)
Sperm DNA damage was evaluated by a flow cytometer. In brief, sperm samples were diluted to a concentration of 1–2 million sperm per ml by chromatin structure assay (SCSA). Then, 200 µl of TNE buffer (0.01 M Tris-HCl, 0.15 M NaCl, 0.001 M EDTA, pH 7.4) were added to the sperm suspension and gently mixed. 400 µl of cold acid detergent buffer (0.1% Triton X-100, (v/v), 0.15 M NaCl, 0.08 M HCl, pH 1.2) was added to the suspension. Following incubation with acid detergent for 30 s, 1.2 ml of 1.0 mg/ml acridine orange (AO) solution (chromatographically purified AO (Polysciences) in dd-H2O at 1.0 mg/ml) was added to the sperm suspension. The suspension was subjected to DNA damage analysis by a flow cytometer (FACSCanto II, BD Biosciences, USA). Acridine orange fluoresces green when it binds to native DNA and red when it binds to fragmented DNA. The percentage of DNA fragmentation index (% DFI) was then calculated [24, 25].
In flow cytometric analyses, gating allows selection of regions of cells or a cell population. Gating is dependent on experimental settings and the information required from the data. First, the threshold was adjusted to exclude most of the debris without cutting off the population of interest. Then, depending on cell size (forward scatter) and granules (side scatter), the population of interest (P1 and P2) was gated. Events that were crushed up against the axis (x and y) were considered as debris and events that formed a group or population away from the axis were not considered as debris. Data follow a biological distribution that does not always fit with rigid gating. The regions drawn were consistent and logical, to minimize subjective bias for inter-experiment comparison. All samples from one set of experiments were run using the same machine settings and gates to ensure standardization.
Preparation of sperm for biochemical assays
Aliquots of sperm containing approximately 1–2 million cells/ml were centrifuged at 800× g for 20 min at 4ºC, and the pellet was re-suspended in normal saline. The sperm were homogenized in a glass-Teflon homogenizer and were centrifuged at 800× g for 20 min at 4ºC. The supernatant was used for biochemical analyses. Protein concentration in sperm was estimated using the method of Lowry et al. [25].
Determination of sperm lipid peroxidation (LPO)
Lipid peroxidation level in sperm was measured as malondialdehyde (MDA) content, which was determined using thiobarbituric acid (TBA) reagent. The reactivity of TBA was determined according to the method of Buege and Aust [26]. The value was expressed as µmoles of MDA formed/mg protein.
Measurement of superoxide dismutase (SOD) (E.C.1.15.1.1) activity level
Sperm SOD activity level was determined using the epinephrine assay, according to the method of Misra and Fridovich [27]. Enzyme activity level was expressed as units per mg protein per min.
Measurement of catalase (E.C.1.11.1.6) activity level
Sperm catalase activity level was assayed following the method of Maehly and Chance [28]. Enzyme activity level was expressed as µmol of hydrogen peroxide (H2O2) metabolized/mg protein/min.
Measurement of glutathione peroxidase (GPx) (EC 1.11.1.9) activity level
Sperm glutathione peroxidase activity level was measured according to the method of Rotruck et al. [29]. Enzyme activity level was expressed as μmol of GSH consumed/mg protein/min.
Induction of oxidative stress in sperm with hydrogen peroxide (H2O2)
Sperm from normal and diabetic rats were incubated with 100 µm H2O2 for 3 h at 32ºC following the method previously described [30, 31].
Immunoblotting analyses of sperm inflammatory markers
Sperm were disrupted using a rotor-stator homogenizer (Heidolph DIAX 600) in RIPA buffer solution (BioVision, CA, USA) containing protease inhibitor (BioVision, CA, USA). For NF-κβ -p65 protein estimation, nuclear proteins from sperm were prepared using a nuclear extraction kit (Cat#40010, Active Motif, Carlsbad, CA, USA), according to the manufacturer’s guidelines. Total proteins were obtained by centrifugation at 14,000× g for 15 min at 4°C. Protein concentrations were quantified using a Thermo Scientific Micro BCA protein assay kit (Rockford, USA), following the manufacturer’s guidelines. Equal amount of proteins were added into the loading dye (BluEye Prestain Protein Ladder, Speed Biosystems, North Bethesda, USA), boiled for 5 min and loaded onto a 10% SDS gel. The separated proteins were transferred onto polyvinylidene fluoride (PVDF) membrane (Bio-Rad, US) for 1–2 h at 100 V, blocked in 5% bovine serum albumin (BSA) (Sigma-Aldrich, USA) for 60 min at room temperature.
The membranes were then probed with primary antibodies against NF-κβ-p65 and TNF-α (sc-8008 and sc-1350; Santa Cruz Biotechnology, CA, USA respectively) for 90 min at room temperature, followed by incubation with horseradish peroxidase (HRP) conjugated secondary antibody (Santa Cruz Biotechnology, CA, USA) for 60 min at room temperature. The membrane was washed three times with PBS-T, 5 min each following primary and secondary antibody incubations. The blots were developed using Thermo Scientific Super Signal West Pico Chemiluminescent Substrate (Rockford, USA) according to the manufacturer’s guidelines. Chemiluminescent signals were then captured using a CCD camera-based imager (BioSpectrum Imaging System), which was highly sensitive. The band intensity of each target was calculated and analyzed using Image J software. In brief, a rectangle was drawn around each single band. The size of the rectangle should be large enough to encompass the entire band. Dimensions of the rectangle should be kept the same for all other bands to be analyzed in the same experiment. A profile plot which represents the relative density of the contents of the rectangle over each band was created. The peak corresponds to the dark bands in the rectangle. The area under the curve (AUC) is proportional to the intensity of the band. β-actin (sc-47778, Santa Cruz Biotechnology) was used as an endogenous control. All experiments were performed in triplicate and mean intensity of target proteins/β-actin was then determined.
Gene expression studies by real-time PCR (qPCR)
Total RNA was freshly isolated from sperm suspension using the RNeasy plus Mini Kit (Qiagen, Valencia, CA, USA). Purity and concentration of RNA were assessed by 260/280 UV absorption ratios (Gene Quant 1300, GE Healthcare UK Limited, Buckinghamshire, UK). Two-step real-time PCR was used to evaluate gene expression. Reverse transcription into cDNA was performed using a high-capacity RNA-to-cDNA Kit (Applied Biosystems, Foster City, CA, USA) and the target genes were amplified using a standard real-time PCR kit (Applied Biosystems, Foster City, CA, USA). The amplification was performed in a real-time PCR system using SYBR green. The RNA fold changes in gene expression were calculated according to the comparative Ct (2–ΔΔCt) method. Primers used for amplification of the respective genes in this study, which included Sod1: F-5′-GGGACAATACACAAGGCTGT-3′; R-5′-CCTTTCCAGCAGCCACATTG-3′, Cat: F-5′-GTGCATGCATGACAACCAGG-3′; R-5′-GAATGTCCGCACCTGAGTGA-3′, Gpx1: F-5′-CCGGGACTACACCGAAATGA-3′; R-5′-TGCCATTCTCCTGATGTCCG-3′, Gapdh (F-5′-GCATCTTCTTGTGCAGTGCC-3′ and R-5′-TACGGCCAAATCCGTTCACA-3′), were designed by the NCBI Primer-BLAST tool (http://www.ncbi.nlm.nih.gov/tools/primer-blast/) and synthesized by Integrated DNA Technologies.
Results
Quercetin ameliorates changes to the basic sperm parameters in diabetic rats
Administration of 10, 25 and 50 mg/kg/b.w. quercetin to normal, non-diabetic rats did not cause significant changes to sperm count (Figure 1 A). In untreated diabetic rats, the sperm count was markedly lower compared to normal, non-diabetic rats. In these rats, treatment with quercetin at 10, 25 and 50 mg/kg/b.w. resulted in a steady and significant increase in sperm count.
Figure 1
A – Sperm count, B – sperm motility, C – sperm viability, D – HOS tail-coiled sperm, E – abnormal sperm, F – (i) normal, (ii) rod head, (iii) pin head, (iv) bent middle piece, (v) bent neck, (vi) bent neck and (vii) tail, (viii) rod head and enlarged tail, (ix) HOS tail coiled sperm
Arrow shows live sperm and dotted arrow shows dead sperm. Values represent mean ± SEM of six different observations. *P < 0.05 compared to NC, #p < 0.05 compared to DC. NC – normal control, DC – diabetic control, NC + Q10 – normal receiving 10 mg/ kg/b.w. quercetin, NC + Q25 – normal receiving 25 mg/kg/b.w. quercetin, NC + Q50 – normal receiving 50 mg/kg/b.w. quercetin, DC + Q10 – diabetic receiving 10 mg/kg/b.w. quercetin, DC + Q25 – diabetic receiving 25 mg/kg/b.w. quercetin, DC + Q50 – diabetic receiving 50 mg/kg/b.w. quercetin, scale bar = 50 μm.
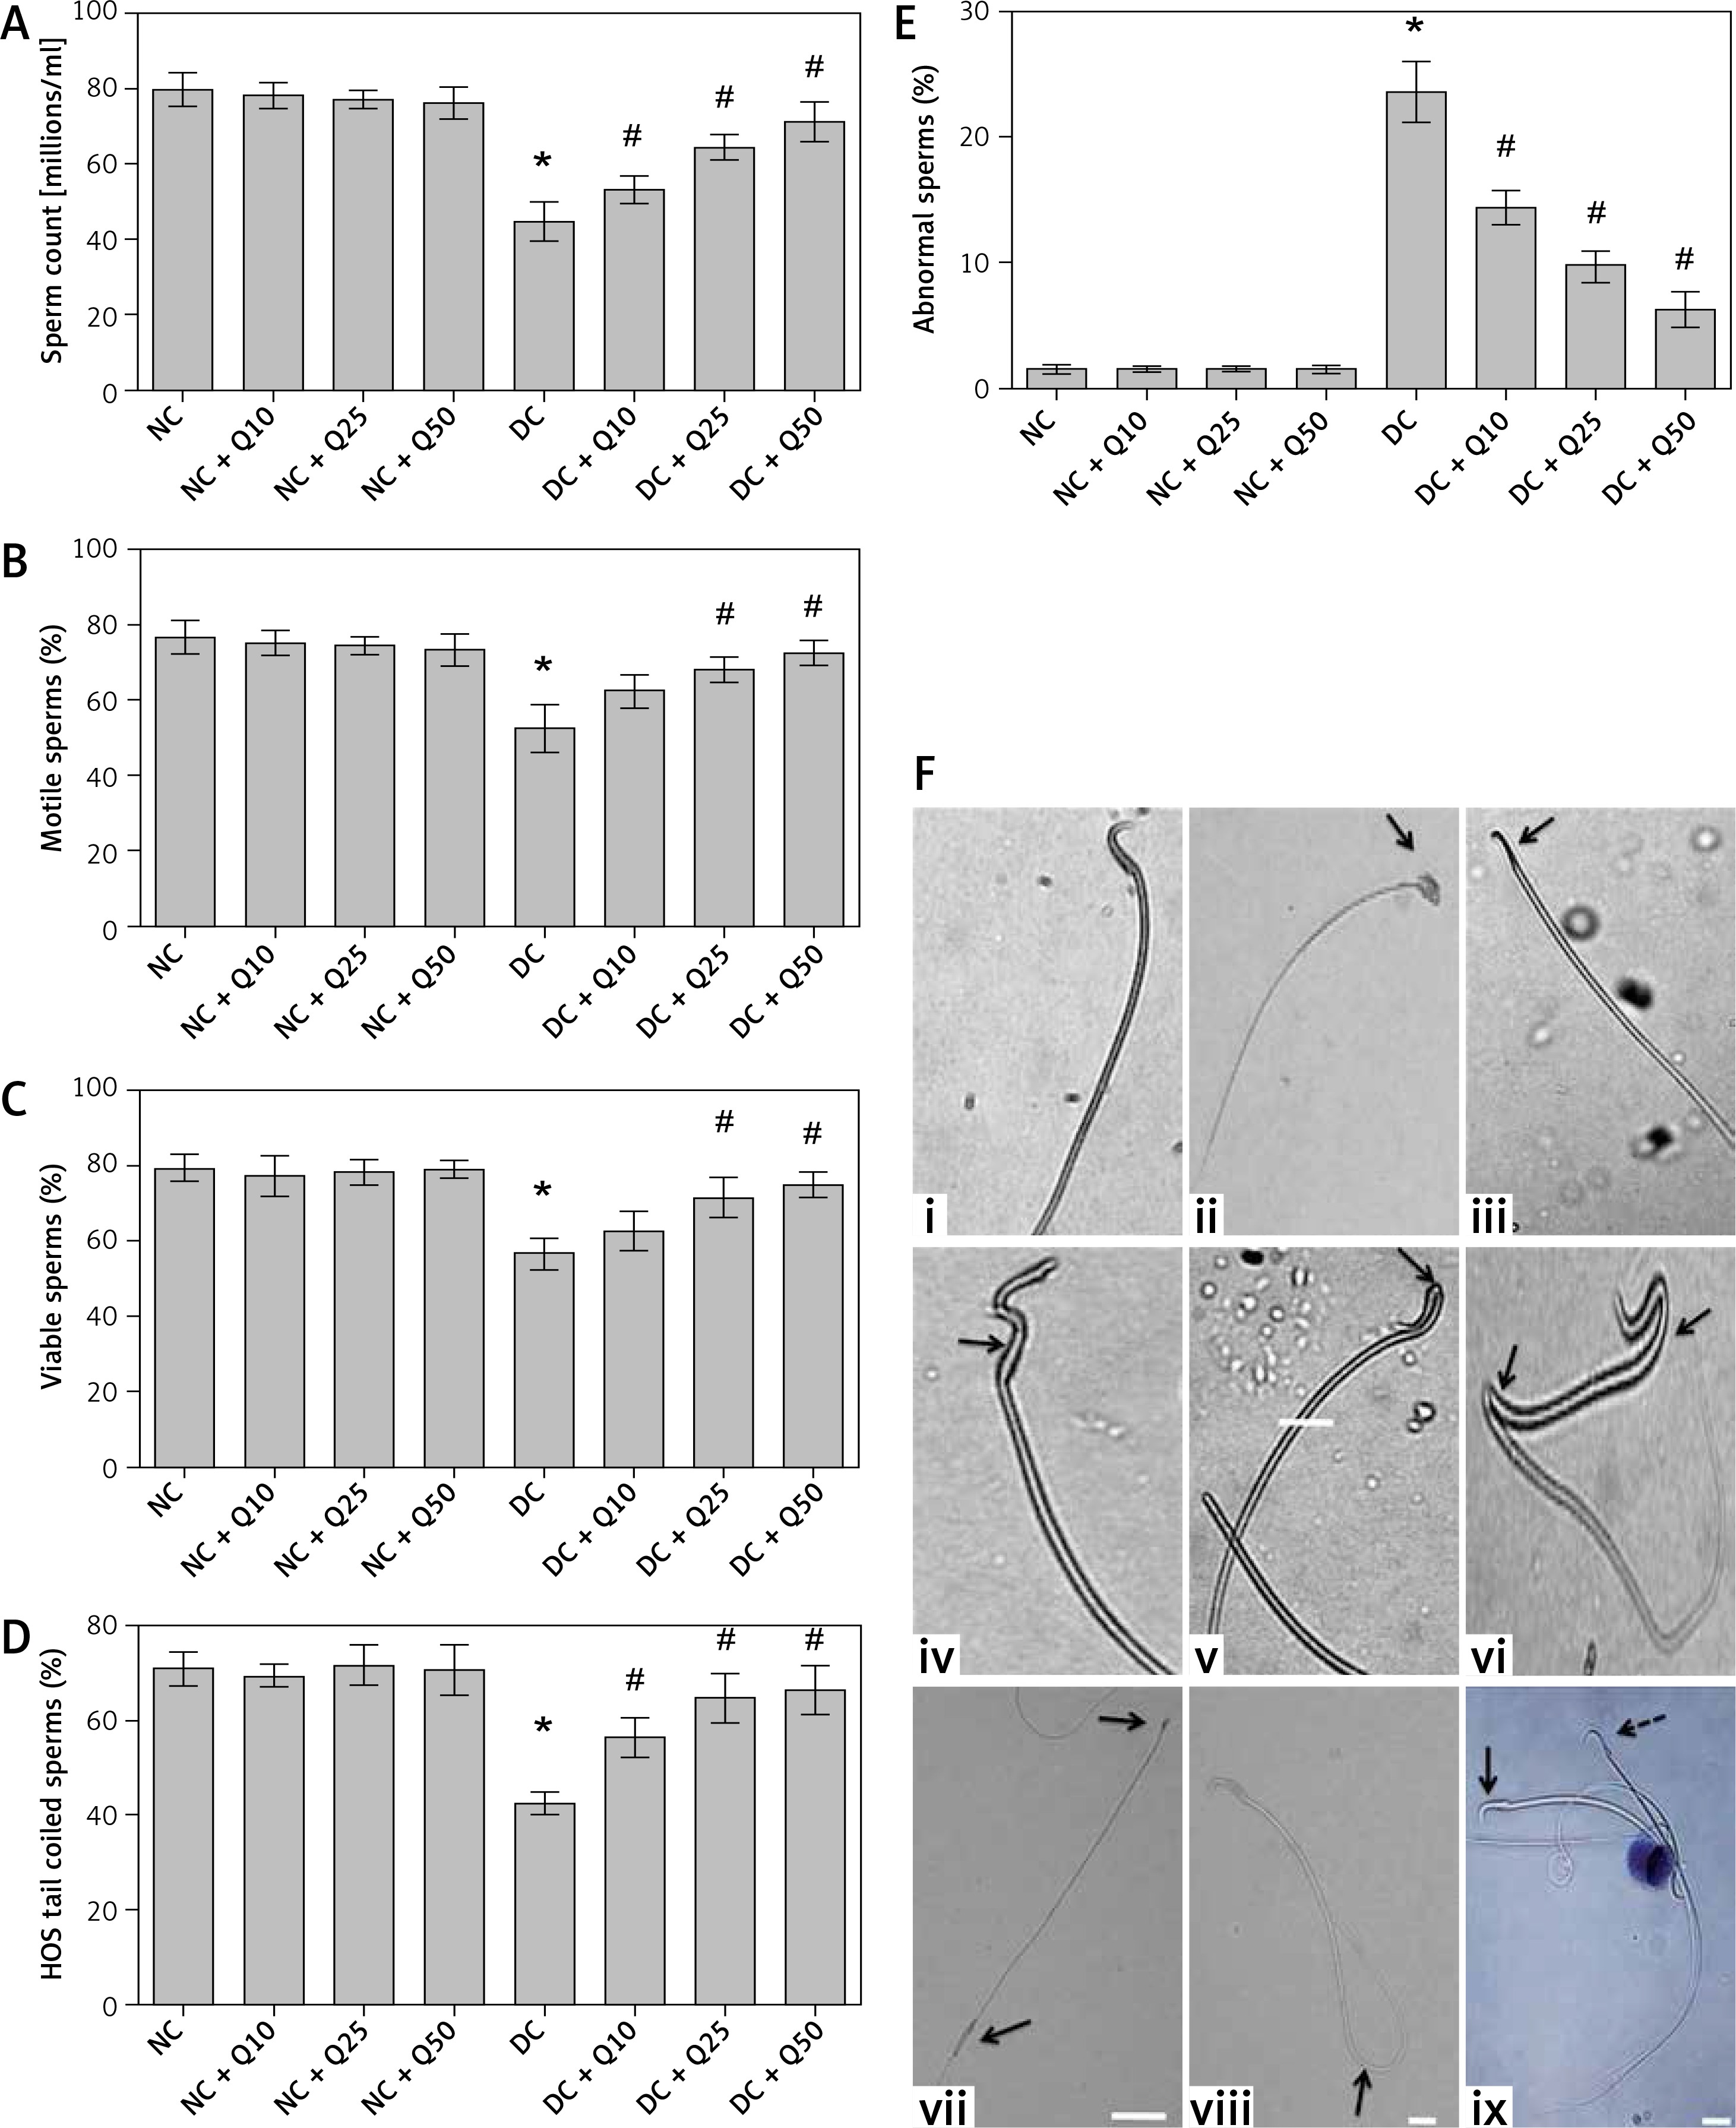
Administration of 10, 25 and 50 mg/kg/b.w. quercetin to normal, non-diabetic rats did not cause significant changes to the percentage of motile sperm. In untreated diabetic rats, the percentage of motile sperm markedly decreased (p < 0.05). The percentage of motile sperm in diabetic rats steadily increased following increasing doses of quercetin, but the increase was only significant following treatment with 25 and 50 mg/kg/b.w. quercetin (p < 0.05).
In Figure 1 C, administration of three doses of quercetin did not cause significant changes to the percentage of viable sperm in normal, non-diabetic rats, which was higher than diabetic rats. However, in untreated diabetic rats, the percentage of viable sperm is significantly decreased (p < 0.05 as compared to non-diabetic rats). Administration of 10, 25 and 50 mg/kg/b.w. quercetin resulted in a steady increase in percentage of sperm viability, but the sperm viability percentage was significantly higher only following administration of 25 and 50 mg/kg/b.w. quercetin (p < 0.05).
The percentage of HOS tail coiled sperm was highest in normal, non-diabetic rats, which was not affected by quercetin treatment (Figure 1 D). In untreated diabetic rats, the percentage of HOS tail coiled sperm markedly decreased compared to normal, non-diabetic rats (p < 0.05). In diabetic rats, treatment with 10, 25 and 50 mg/kg/b.w. quercetin resulted in a significantly higher HOS tail coiled sperm percentage (p < 0.05).
The percentage of abnormal sperm in normal, non-diabetic rats was low, and this was not affected by quercetin treatment (Figure 1 E). In diabetic rats, abnormal sperm percentage increased by approximately 21.5% compared to normal, non-diabetic rats. In these rats, treatment with increasing doses of quercetin resulted in the percentage of abnormal sperm steadily decreasing.
Figure 1 F shows different sperm morphologies, both normal and abnormal. Figure 1 F (i) shows sperm with normal morphology. Figures 1 F (ii) and (iii) show abnormal sperm with two different head abnormalities, i.e. broad head (ii) and pin head (iii). Figures 1 F (iv), (v) and (vi) show abnormal sperm with both head and mid-piece abnormalities. Figure 1 F (vii) shows sperm with both head and tail abnormalities, Figure 1 F (viii) shows normal sperm with coiled tail. Figures 1 F (ix) shows viable (live) and non-viable (dead) sperm.
Quercetin reduces sperm DNA fragmentation in diabetic rats
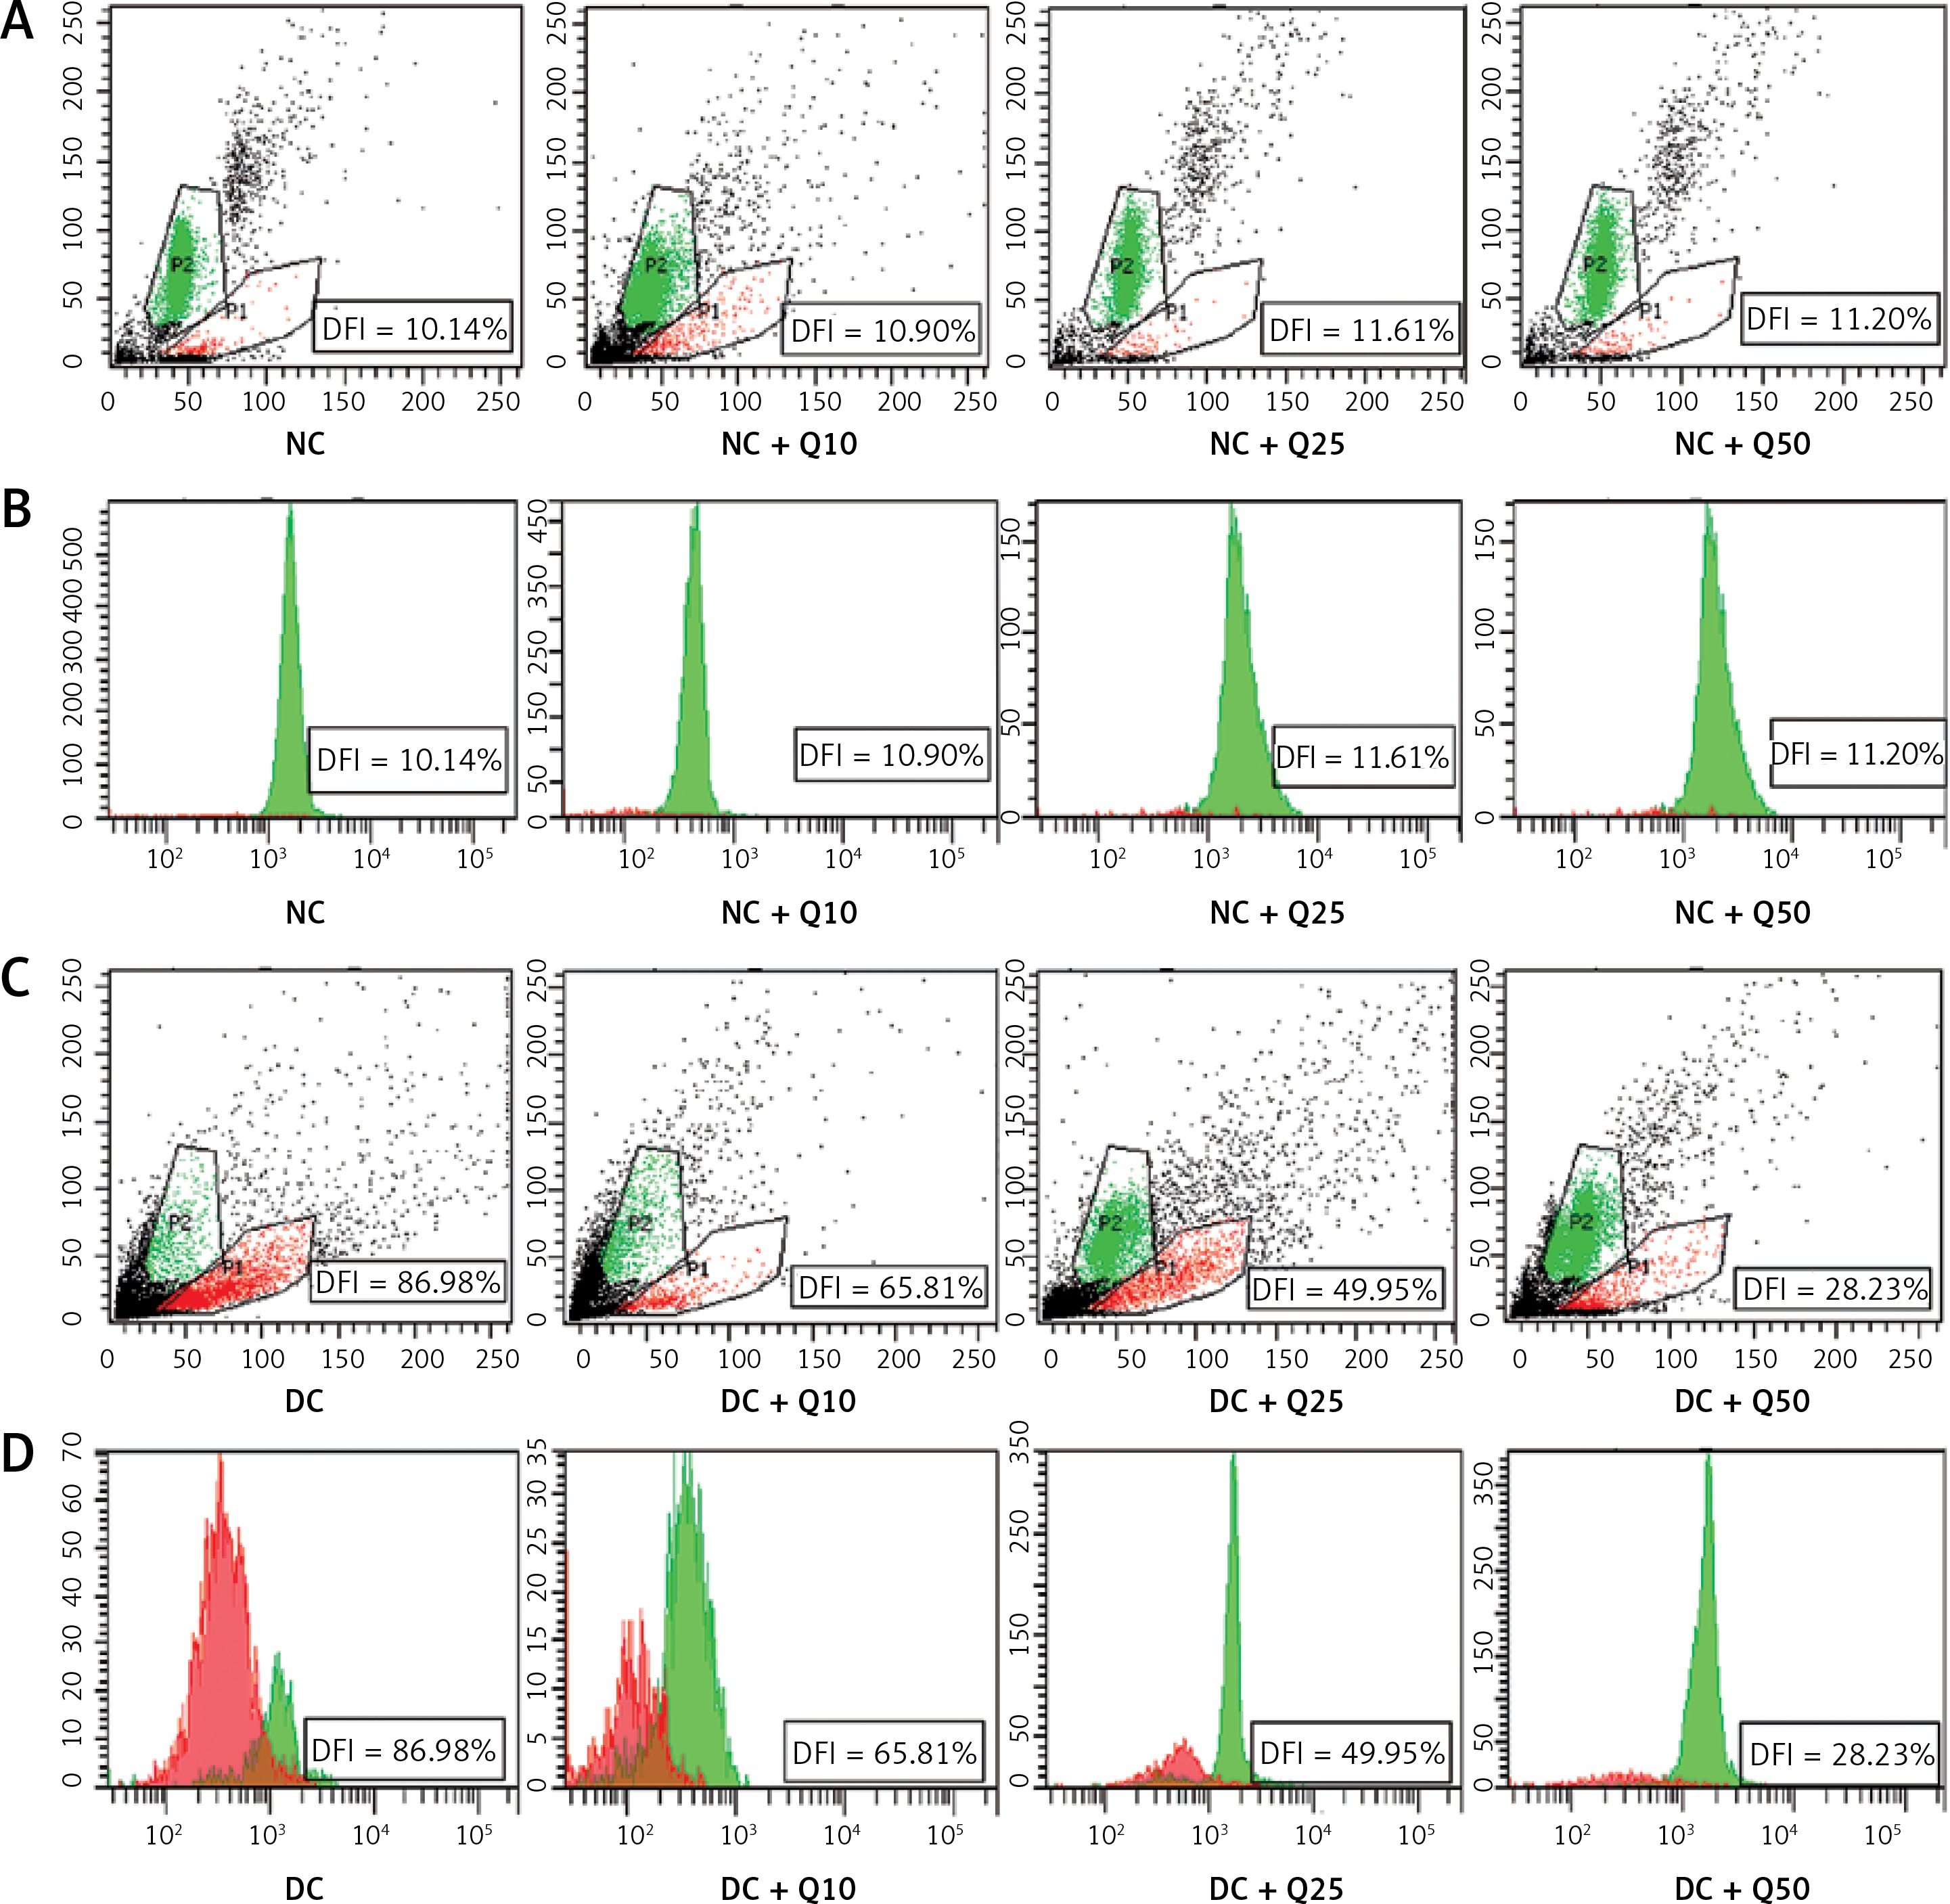
Flow cytometric analysis revealed that diabetic rat sperm have a higher DNA fragmentation index (DFI = 89.98%) compared to normal, non-diabetic rats’ sperm (p < 0.05) (Figure 2). However, in diabetic rats, the proportion of sperm with DNA damage significantly decreased following quercetin treatment (p < 0.05). Sperm from diabetic rats treated with 10 mg/kg/b.w. quercetin showed a 65.81% reduction in DFI. Similarly, DFI of sperm from diabetic rats treated with 25 and 50 mg/kg/b.w. quercetin significantly decreased (by 49.95% and 28.23% respectively) as compared to non-treated diabetic rats.
Figure 2
Sperm DNA fragmentation index (A, C). Scattergram represents fluorescence intensity of fragmented DNA (P1; red color, x-axis) versus double-stranded DNA (P2; green color, y-axis). Cytogram dots represent single sperm with dual-parameter green and red fluorescence acquired at 10-bit resolution on flow cytometer. Debris (bottom left corner) was excluded from the analysis. B and D – frequency distribution histogram of DNA fragmentation index (DFI). The area with red color represents fragmented DNA, area with green color represents double standard DNA
Values represent mean ± SEM of six rats. *P < 0.05 compared to NC, #p < 0.05 compared to DC. NC – normal control, DC – diabetic control, NC + Q10 – normal receiving 10 mg/kg/b.w. quercetin, NC + Q25 – normal receiving 25 mg/kg/b.w. quercetin, NC + Q50 – normal receiving 50 mg/kg/b.w. quercetin, DC + Q10 – diabetic receiving 10 mg/kg/b.w. quercetin, DC + Q25 – diabetic receiving 25 mg/kg/b.w. quercetin, DC + Q50 – diabetic receiving 50 mg/kg/b.w. quercetin.
Quercetin reduces oxidative stress and increases activity level of anti-oxidative enzymes in sperm of diabetic rats
In Figure 3 A, administration of 10, 25 and 50 mg/kg/b.w. quercetin did not cause significant changes in LPO level in the sperm of normal, non-diabetic rats. However, in diabetic rats, LPO level in the sperm was higher than in normal, non-diabetic rats, and this was decreased following quercetin treatment (p < 0.05) (Figure 3 A). Activity level of anti-oxidative enzymes such as SOD, CAT and GPx in normal non-diabetic rats was high and did not significantly change following quercetin treatment. In sperm of untreated diabetic rats, SOD, CAT and GPx activity levels were significantly lower than in normal, non-diabetic rats. In these rats, quercetin treatment caused a significant increase in SOD, CAT and GPx activity levels (p < 0.05) (Figures 3 B–D).
Figure 3
A – LPO, B – SOD activity level, C – CAT activity level, D – GPx activity level of sperm, E – level of LPO, F – SOD activity, G – CAT activity, H – GPx activity in sperm after 3 h of incubation with H2O2, I – Sod1, J – Cat, K – GPx1 mRNA levels in sperm
Values represent mean ± SEM of six rats. $,*P < 0.05 compared to NC, #p < 0.05 compared to DC. NC – normal control, DC – diabetic control, NC + Q10 – normal receiving 10 mg/kg/b.w. quercetin, NC + Q25 – normal receiving 25 mg/kg/b.w. quercetin, NC + Q50 – normal receiving 50 mg/kg/b.w. quercetin, DC + Q10 – diabetic receiving 10 mg/kg/b.w. quercetin, DC + Q25 – diabetic receiving 25 mg/kg/b.w. quercetin, DC + Q50 – diabetic receiving 50 mg/kg/b.w. quercetin.
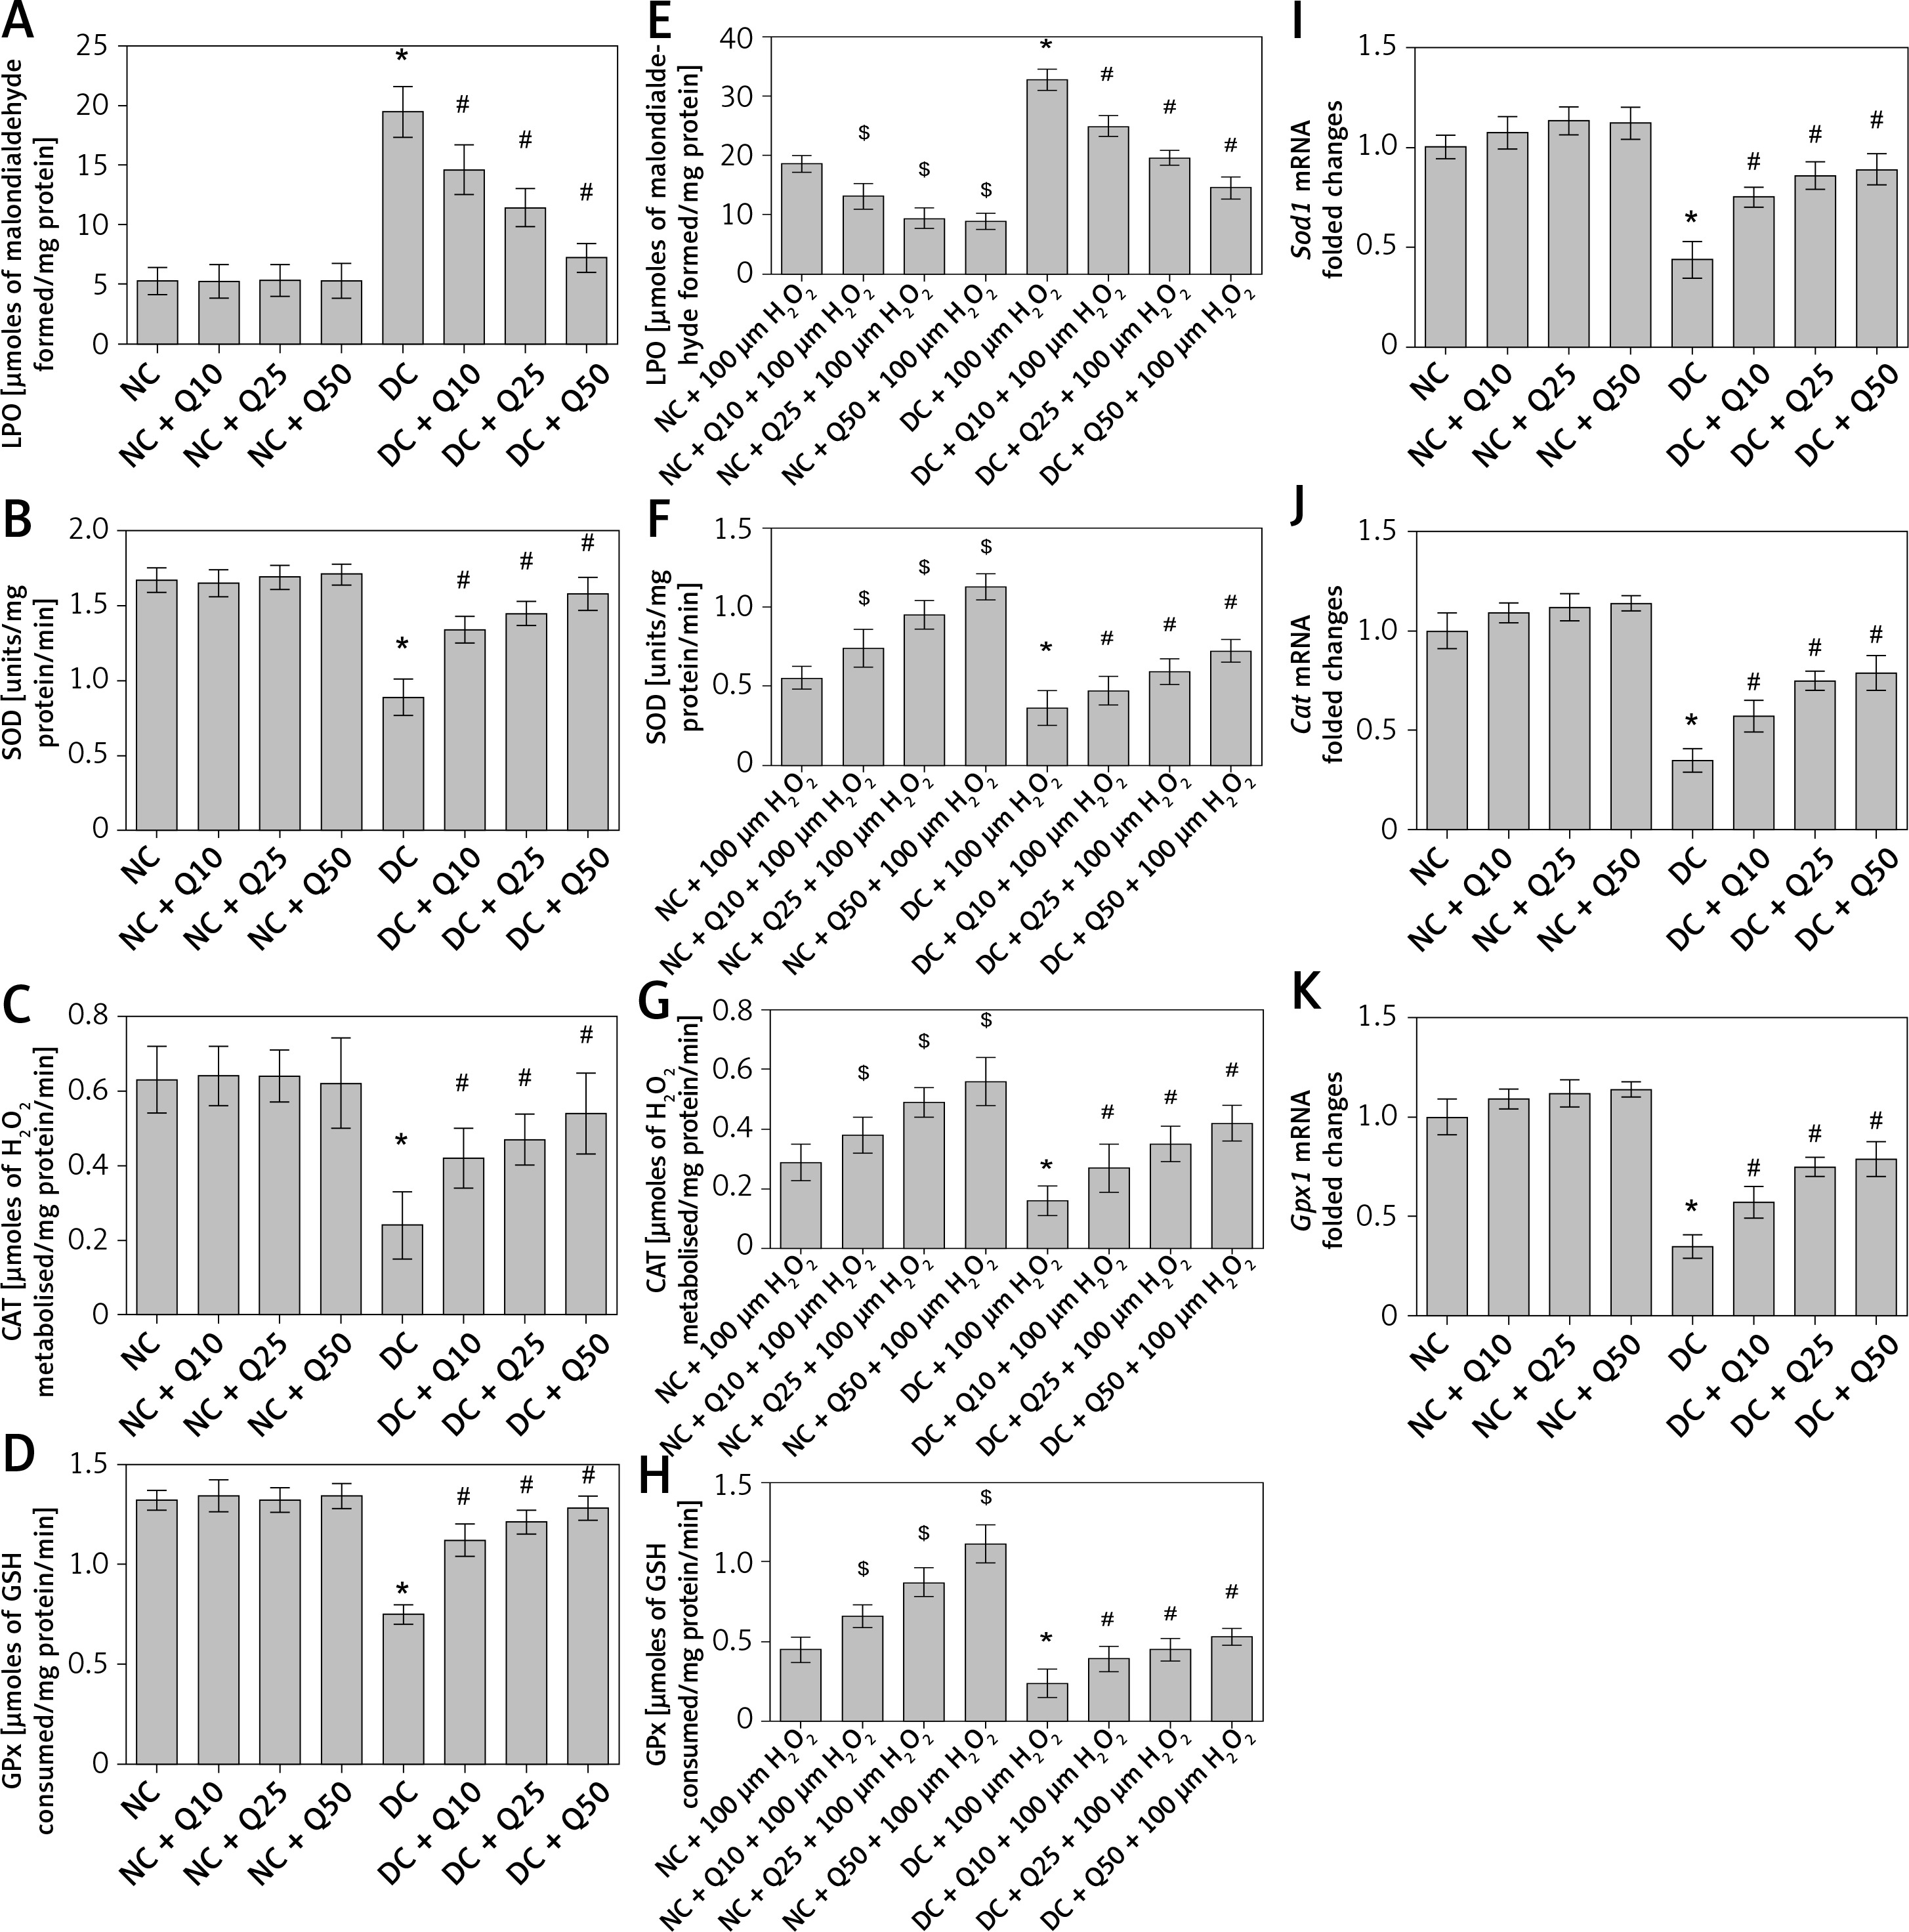
Moreover, levels of sperm Sod1, Cat and Gpx1 mRNA in normal, non-diabetic rats were significantly higher and this level did not change significantly following quercetin treatment. However, in diabetic rats’ sperm, the levels of Sod1, Cat and Gpx1 mRNAs were significantly decreased compared to normal, non-diabetic rats. Administration of quercetin to diabetic rats caused a significant increase in the levels of sperm Sod1, Cat and Gpx1 mRNAs (Figures 3 E–G).
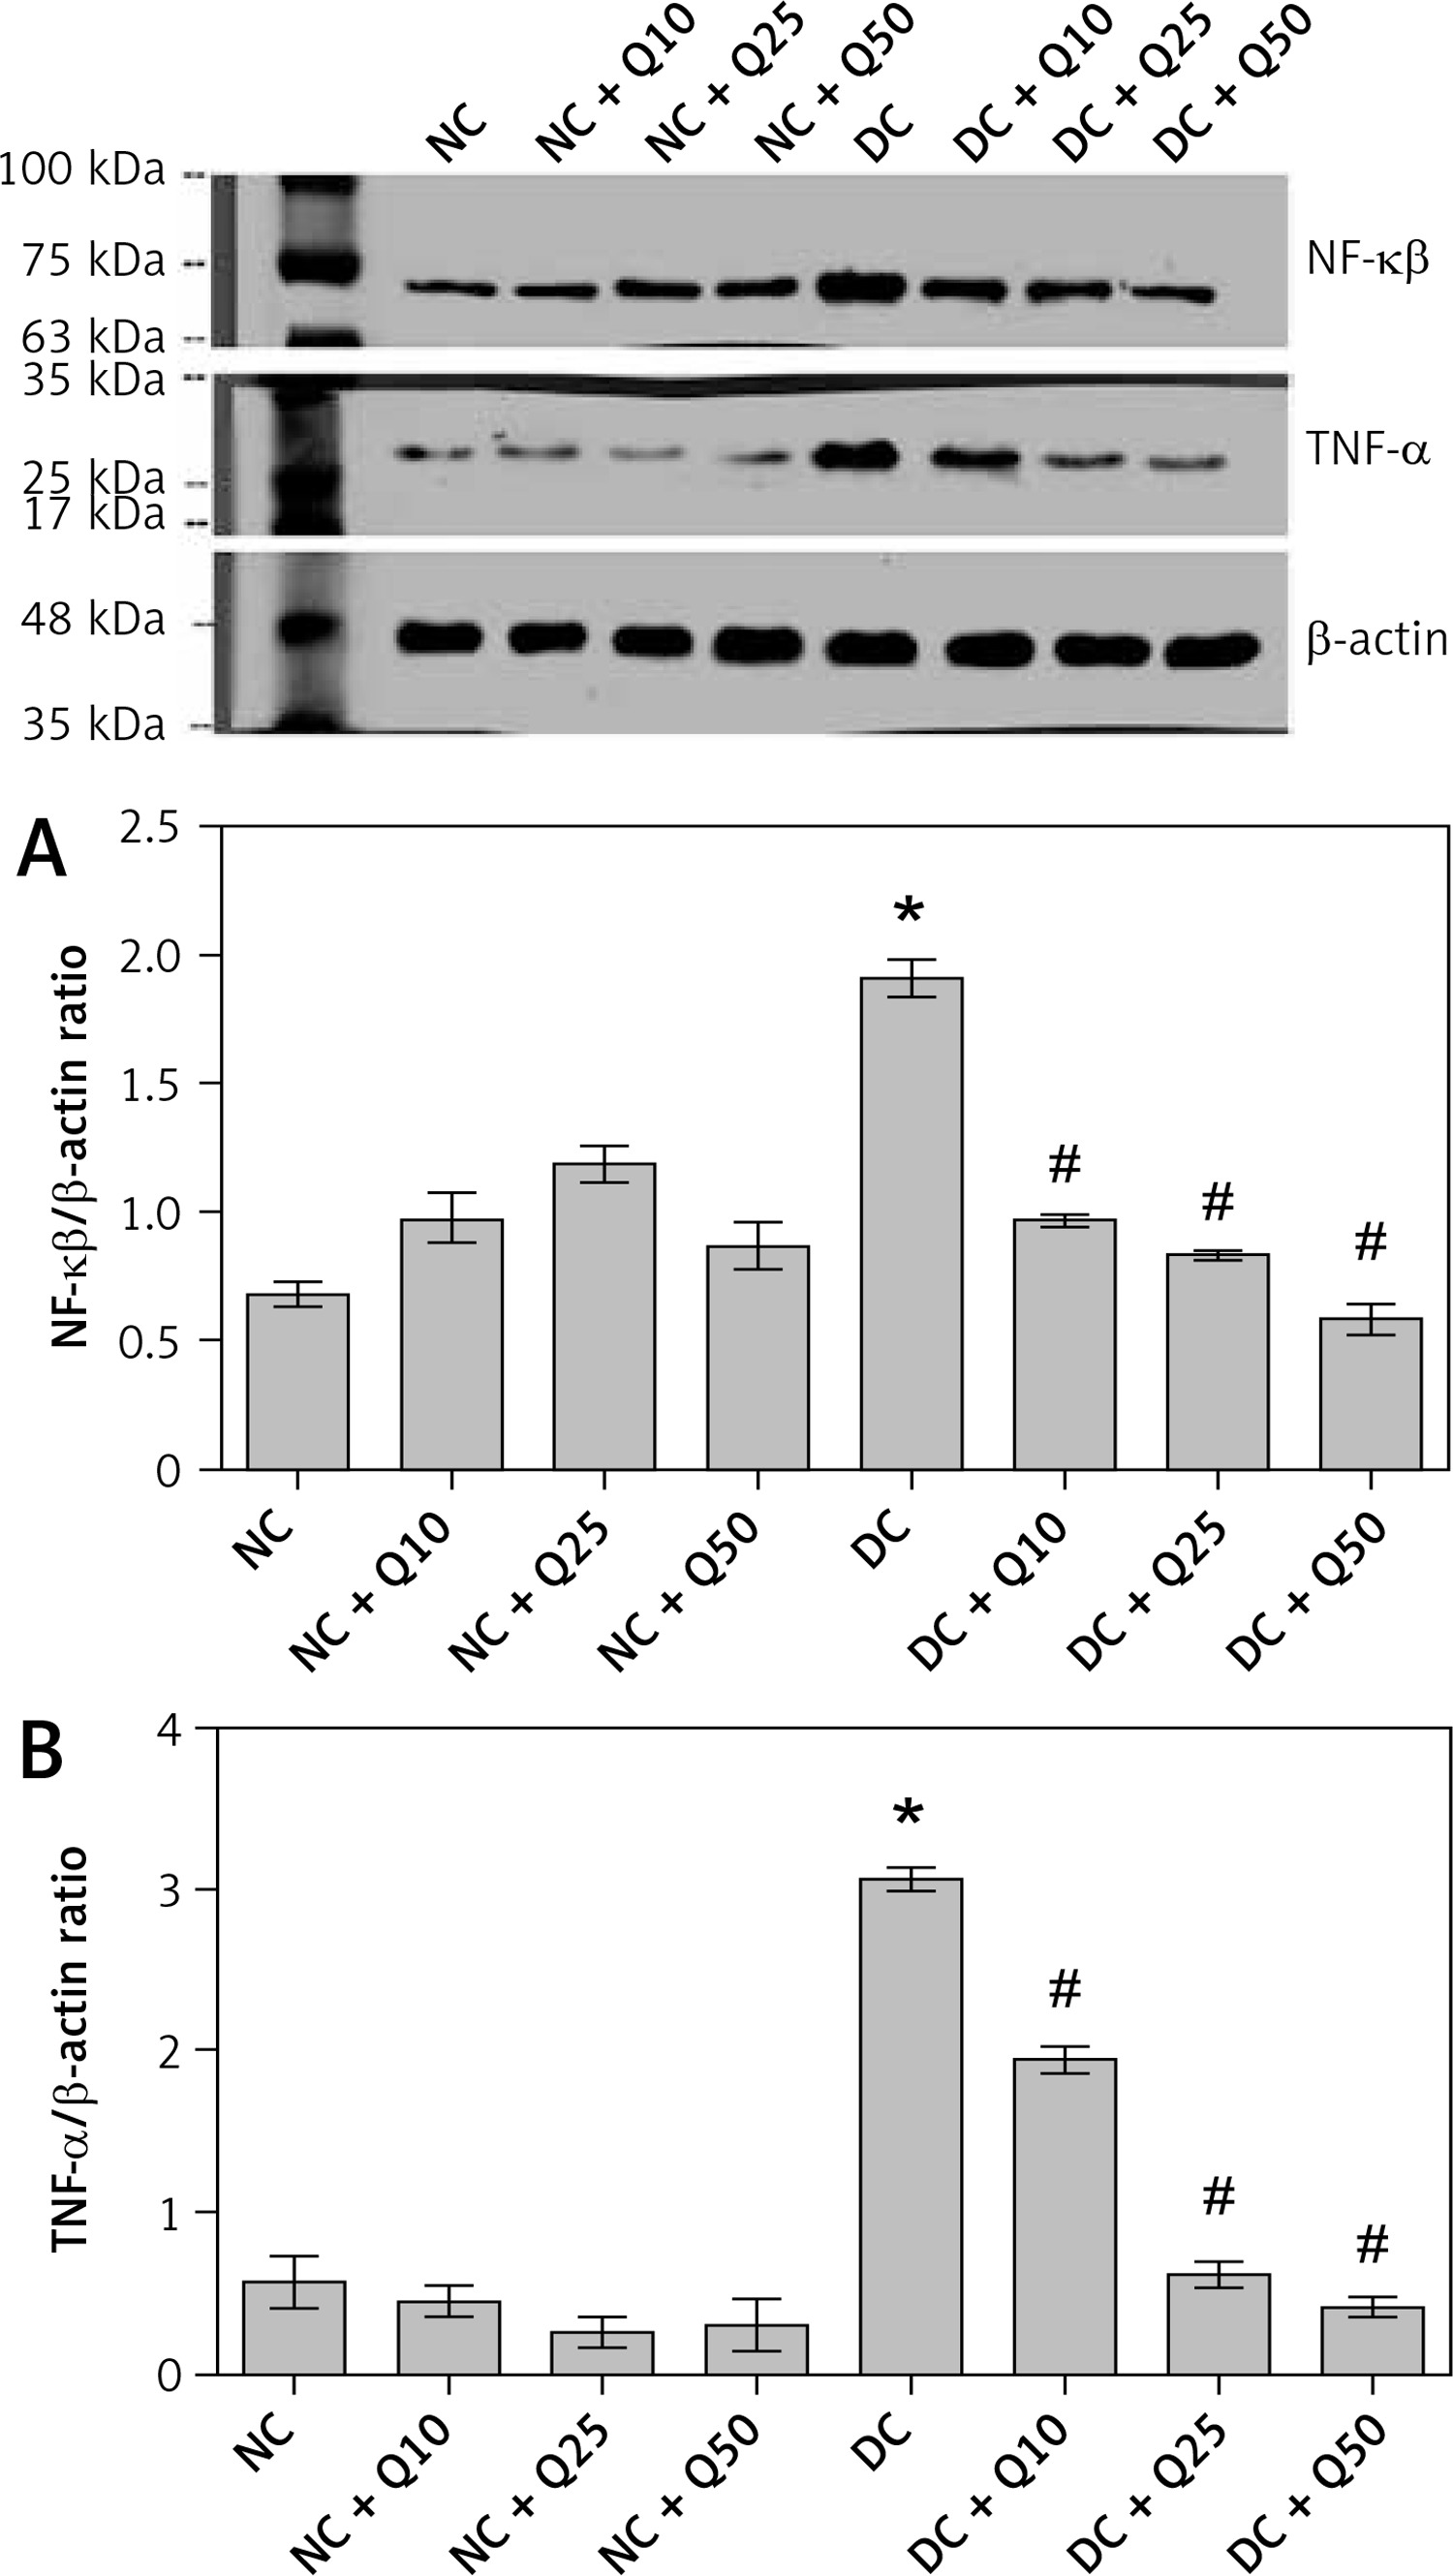
Quercetin reduces expression level of inflammatory marker proteins in sperm of diabetic rats
In Figures 4 A and B, the levels of inflammatory marker proteins, i.e. NF-κβ and TNF-α, in quercetin-treated non-diabetic rats was not significantly different compared to normal non-diabetic rats. In diabetic rats, levels of these proteins were significantly higher than in normal, non-diabetic rats. However, in these rats, quercetin treatment resulted in the levels of these proteins significantly decreasing (p < 0.05).
Figure 4
A – NF-κβ-p65 (MW = 65 kDa), B – TNF-α (MW = 26 kDa) Western blot images and protein expression level
Values represent mean ± SEM of six rats. *P < 0.05 compared to NC, #p < 0.05 compared to DC. NC – normal control, DC – diabetic control, NC + Q10 – normal receiving 10 mg/kg/b.w. quercetin, NC + Q25 – normal receiving 25 mg/kg/b.w. quercetin, NC + Q50 – normal receiving 50 mg/kg/b.w. quercetin, DC + Q10 – diabetic receiving 10 mg/kg/b.w. quercetin, DC + Q25 – diabetic receiving 25 mg/kg/b.w. quercetin, DC + Q50 – diabetic receiving 50 mg/kg/b.w. quercetin.
Discussion
In this study, we have shown that in-vivo administration of quercetin helps to ameliorate the decrease in sperm count, motility, viability and HOS tail-coiled sperm and the increase in sperm with morphological abnormalities in DM. In addition, oral quercetin treatment was also found to ameliorate the increase in sperm membrane and DNA damage and the decrease in sperm anti-oxidative capacity in DM. Furthermore, oral quercetin treatment was able to decrease the elevation of sperm inflammatory marker levels. In the present study, the increase in sperm count and motility in diabetic rats treated orally with quercetin could be due to the decrease in structural and functional abnormalities in the sperm, which were previously reported in DM [1, 32]. The protective effects of quercetin against sperm damage could be due to its ability to ameliorate the increase in FBG level, as quercetin was found to lower the FBG level in diabetes (our unpublished data). The increase in the number of tail-coiled sperm in diabetic rats receiving oral quercetin treatment suggested that membrane integrity of the sperm, which was reduced in DM [2, 33], was preserved to near normal. The increase in the percentage of viable sperm in diabetic rats receiving quercetin treatment might be due to the ability of this compound to ameliorate the increase in oxidative stress and inflammation, as previously reported to be high in DM [3, 34].
Diabetic sperm are highly susceptible to damage caused by rROS, as the sperm membrane contains a high amount of polyunsaturated fatty acids (PUFA) [4, 35]. Additionally, a high amount of glycolytic products can interact with sperm specific proteins and lipids, which further increase the ROS production [5, 36]. Quercetin treatment was able to reduce the LPO level in diabetic rat sperm; therefore this could help to ameliorate the increase in ROS, which helps to reduce the damage to the DNA and to the sperm membrane lipids. Quercetin’s ability to ameliorate DNA damage in diabetic rat sperm was reflected by the high value of the DNA fragmentation index. Fragmentation of sperm DNA will result in poor sperm quality and therefore will cause low sperm motility and abnormal sperm morphologies, all having deleterious effects on the sperm fertilizing capability [6, 37].
Our findings indicated that quercetin was able to prevent the increase in oxidative stress in diabetic rat sperm by preserving near normal SOD, CAT and GPx anti-oxidative enzymes. Sperm anti-oxidative enzymes (SOD, CAT and GPx) help to scavenge harmful ROS. SOD helps to remove oxygen free radicals [7, 38], while catalase helps to convert H2O2 to H2O and oxygen [8, 39]. GPx detoxifies H2O2 to H2O and oxygen and highly cytotoxic products including lipid peroxides and organic hydroperoxides [40]. Ability of quercetin to prevent the increase in oxidative stress could prevent the increase in sperm inflammation as oxidative stress can activate the transcription of inflammatory genes such as NF-κβ [41]. Following quercetin treatment, translocation of NF-κβ from the cytoplasm into the nucleus and subsequently activation of the genes including TNF-α were markedly decreased. In this study, we found that levels of TNF-α in diabetic rat sperm treated with quercetin were markedly decreased.
The effect of quercetin on the sperm when orally given was the opposite of its reported in-vitro effect. In-vitro administration of quercetin was found to cause decreased human sperm motility [1, 42]. An irreversible and dose-dependent fall in sperm motility was observed following 5–200 µm quercetin treatment and a decrease in sperm viability was observed at higher quercetin concentrations (50–100 µm) [2, 43]. It is possible that the difference in quercetin’s effects might be due to a different route of administration in which quercetin could be metabolized in the gut and liver into quercetin-3-glucuronide (Q3G) and quercetin-3′-sulfate (Q3′S), the two major metabolites of quercetin [3, 44] when given orally. However, quercetin has been shown to exhibit significant ROS scavenging effects and prevents sperm alterations caused by ROS even when administered directly in in-vitro studies [4, 45]. Sperm DNA damage, induced by arsenic, was found to be significantly reversed toward the control level following supplementation with quercetin [5].
While we observed that oral quercetin treatment could have a protective effect on sperm in DM, future studies can be performed to identify changes to the testicular sections of diabetic rats with regards to sperm count, thickness of the germinal epithelium and the number of Leydig cells, as these portions of the male reproductive tract are involved in spermatogenesis. In conclusion, in-vivo administration of quercetin results in nearnormal sperm function and morphology in DM and these effects were most likely due to the ability of this compound to ameliorate sperm oxidative stress and inflammation. Quercetin could therefore be used as an agent that helps to improve fertility in men with DM.